. 2015 May 27:9:39.
doi: 10.3389/fnint.2015.00039. eCollection 2015.

Beyond reward prediction errors: the role of dopamine in movement kinematics

Affiliations

Beyond reward prediction errors: the role of dopamine in movement kinematics

Joseph W Barter et al. Front Integr Neurosci. .

Abstract

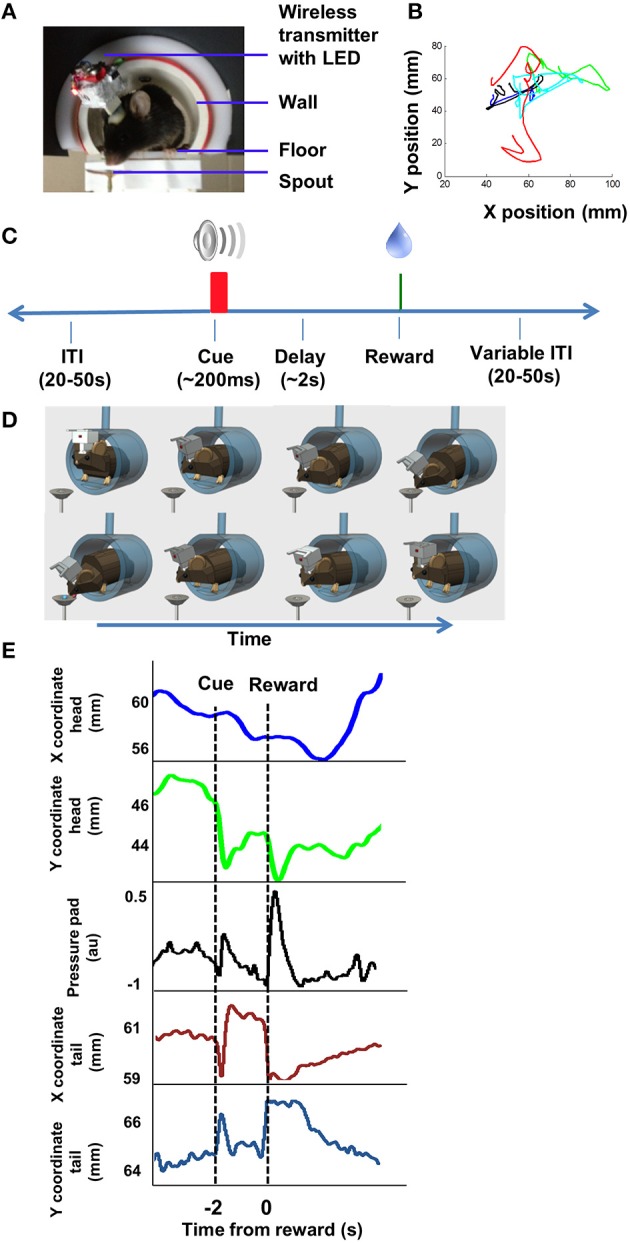
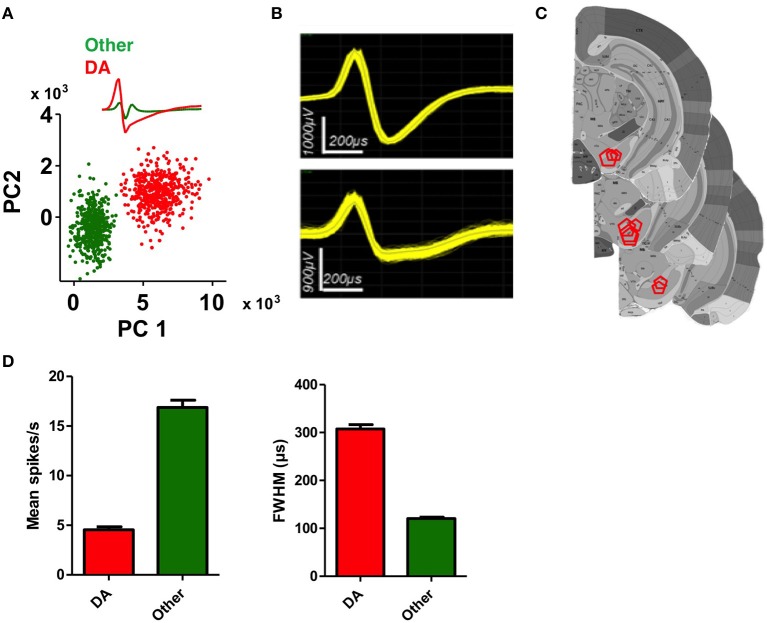
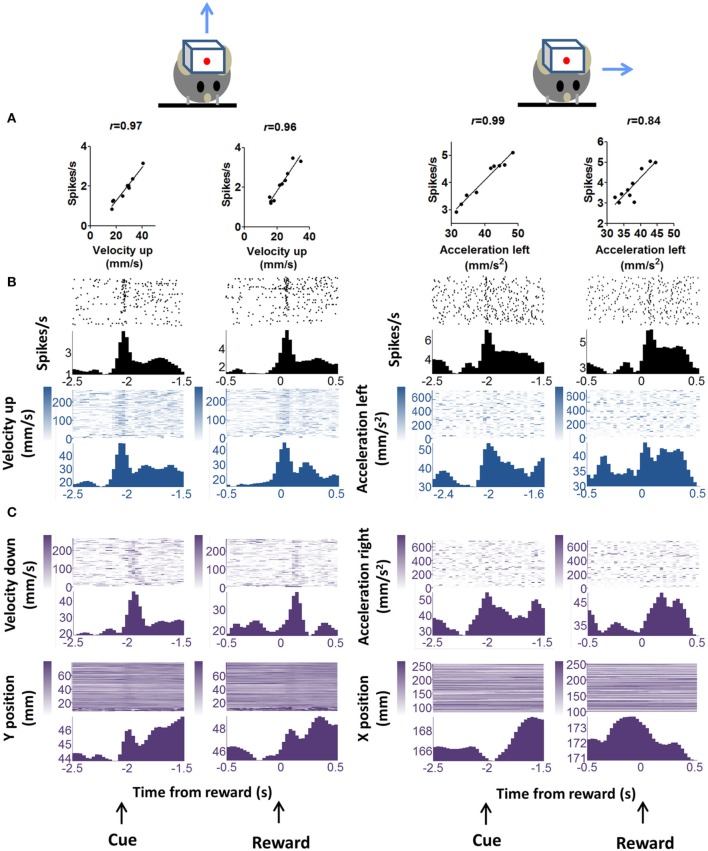
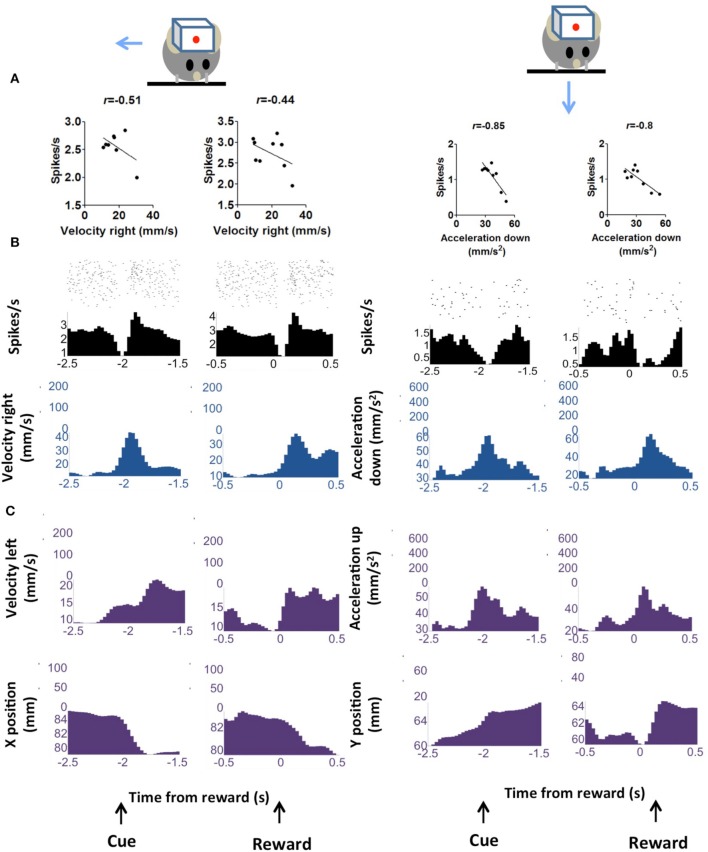
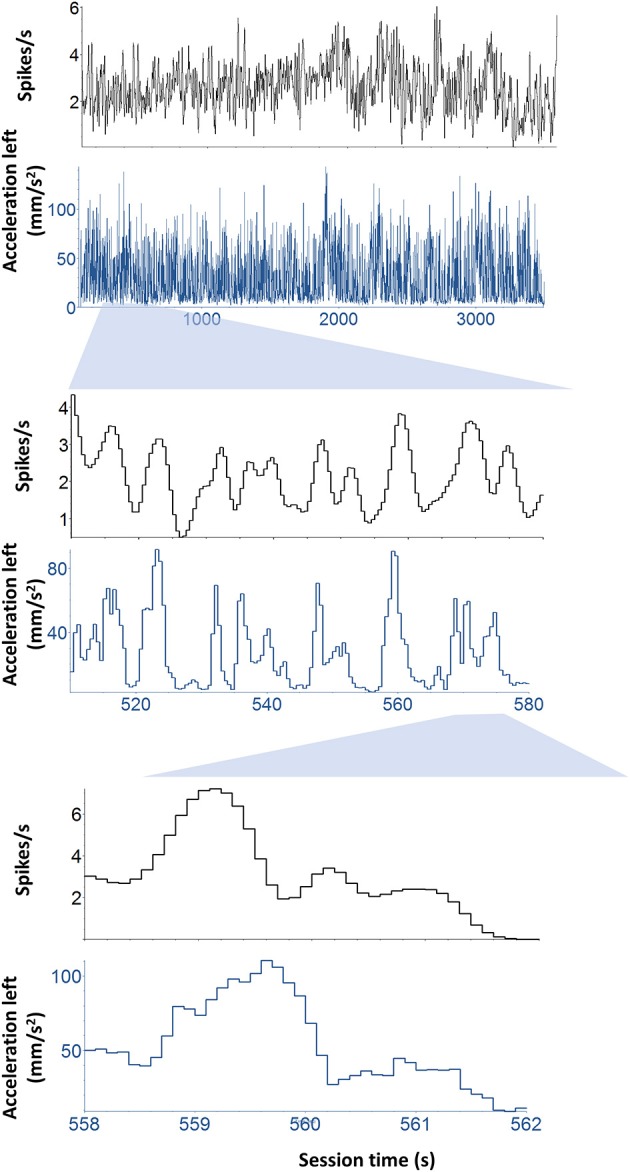
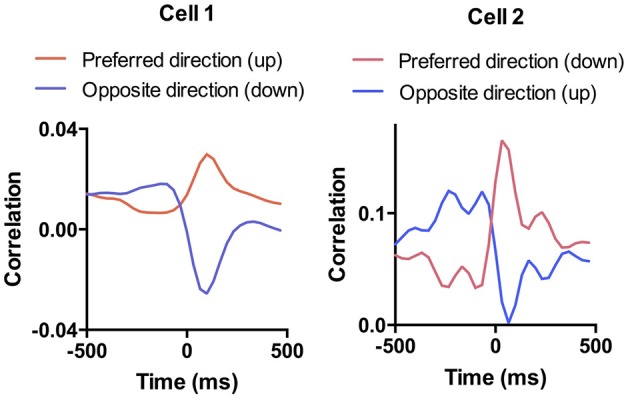
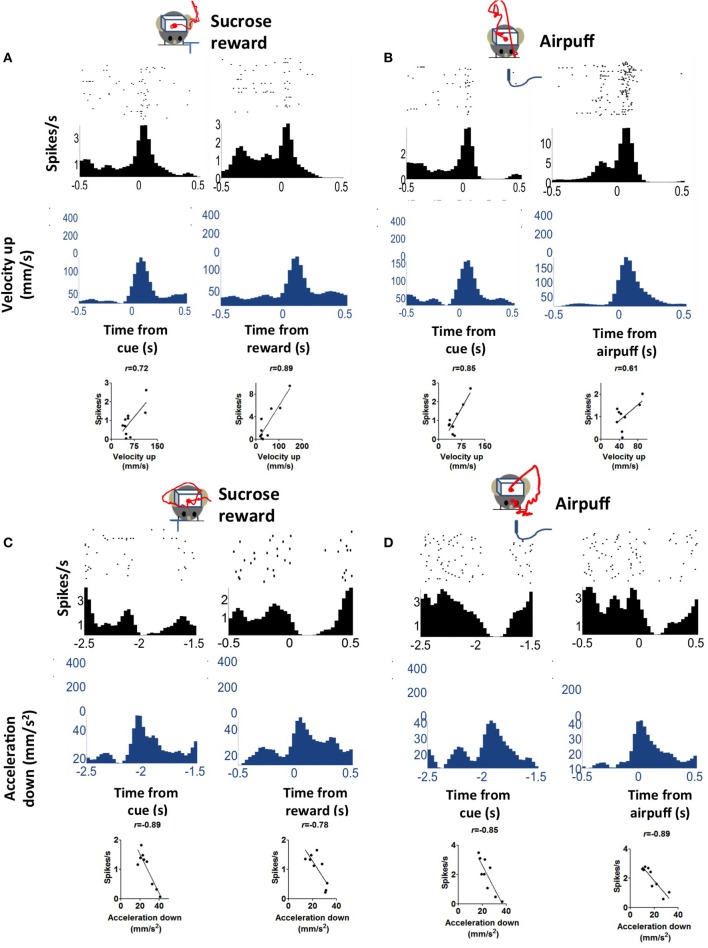
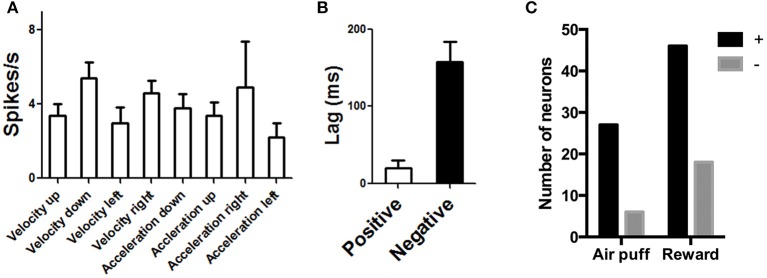
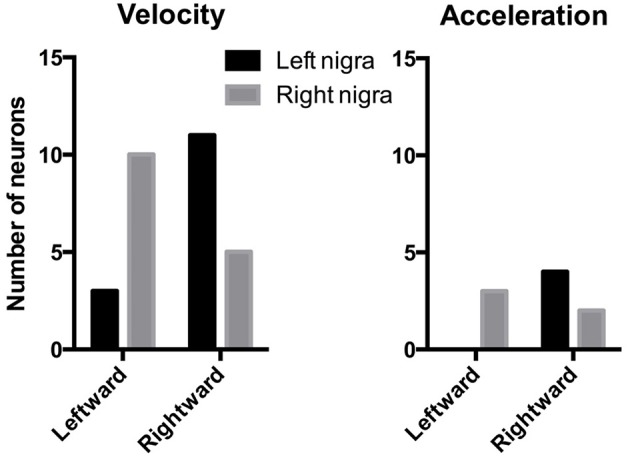
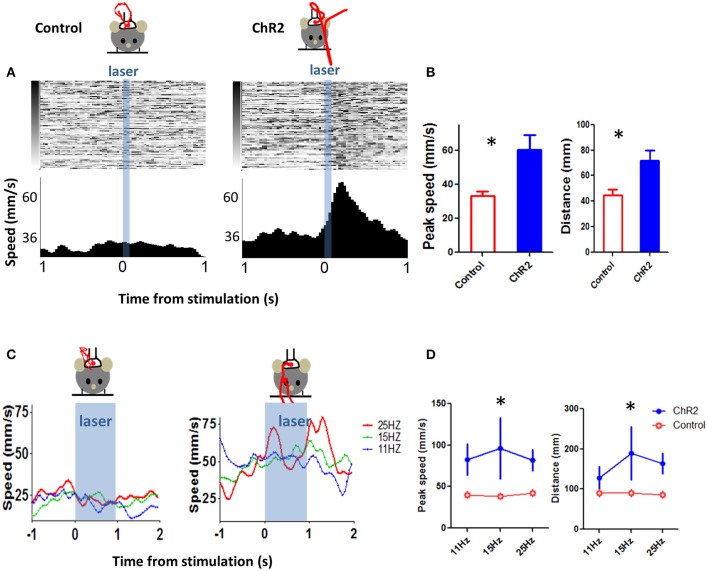
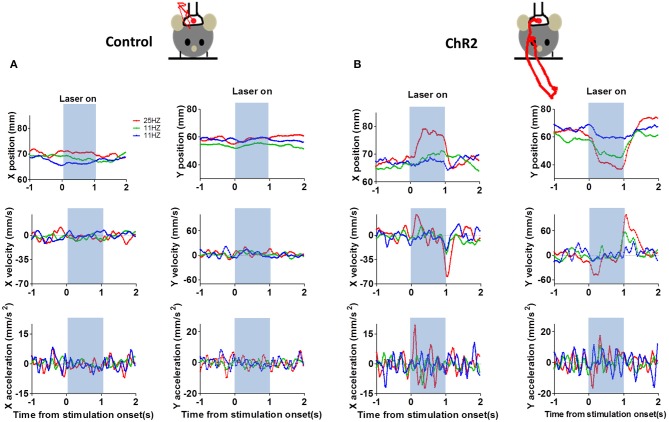
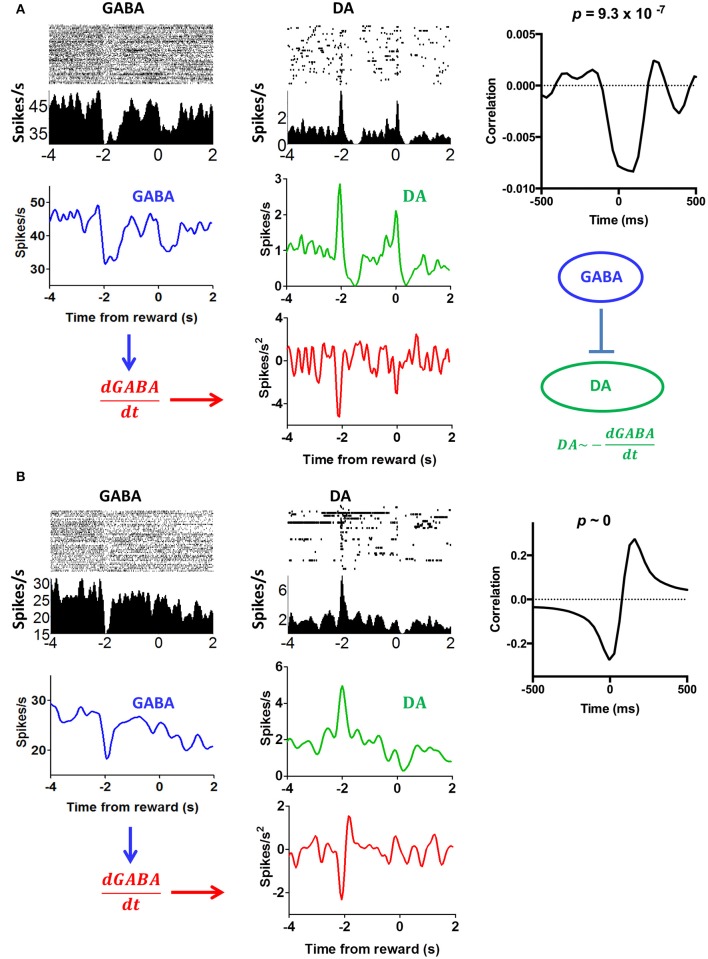
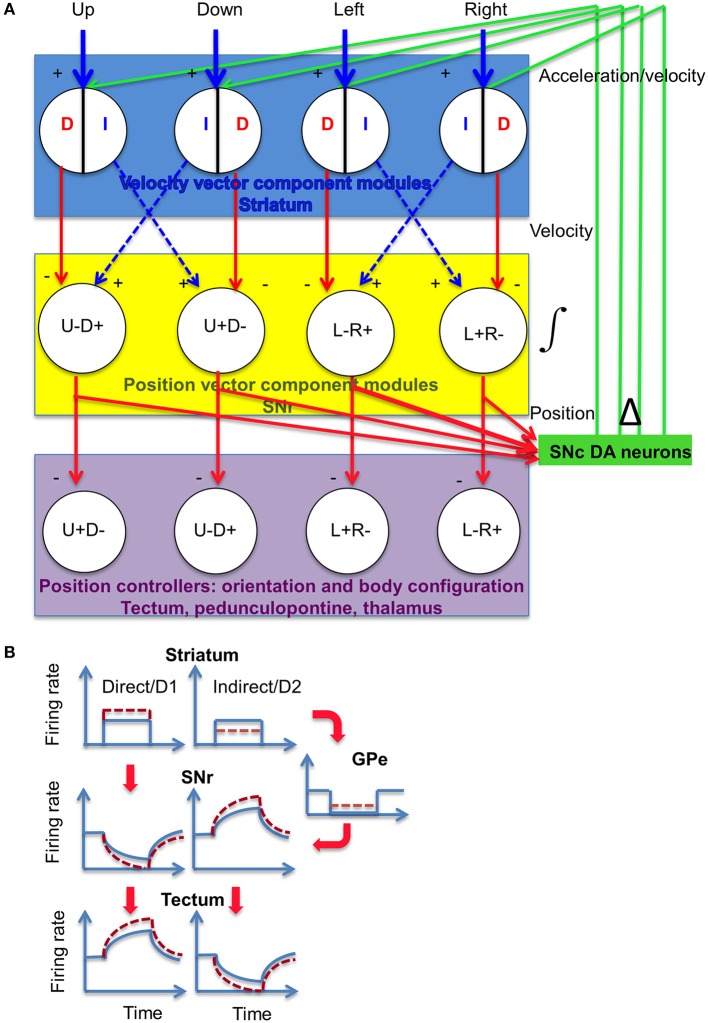
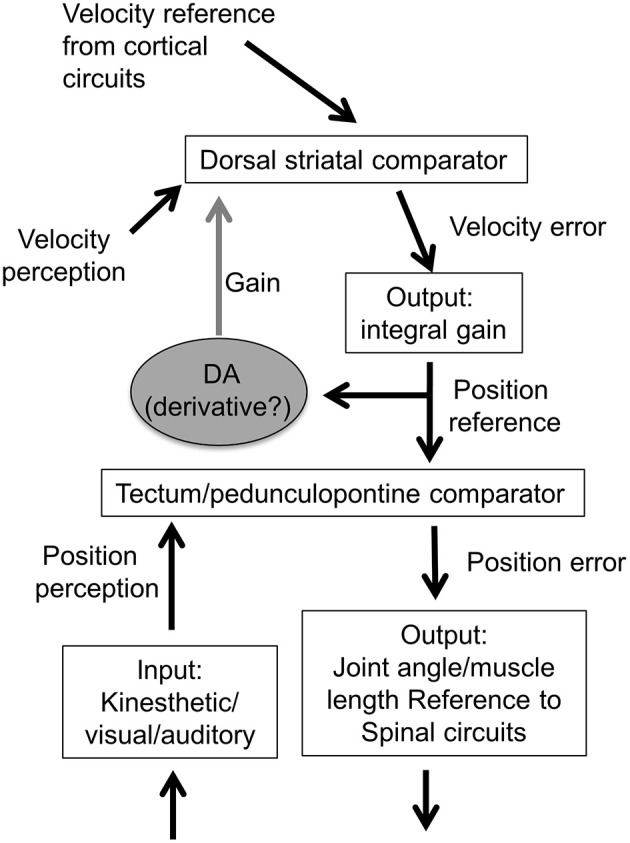
We recorded activity of dopamine (DA) neurons in the substantia nigra pars compacta in unrestrained mice while monitoring their movements with video tracking. Our approach allows an unbiased examination of the continuous relationship between single unit activity and behavior. Although DA neurons show characteristic burst firing following cue or reward presentation, as previously reported, their activity can be explained by the representation of actual movement kinematics. Unlike neighboring pars reticulata GABAergic output neurons, which can represent vector components of position, DA neurons represent vector components of velocity or acceleration. We found neurons related to movements in four directions-up, down, left, right. For horizontal movements, there is significant lateralization of neurons: the left nigra contains more rightward neurons, whereas the right nigra contains more leftward neurons. The relationship between DA activity and movement kinematics was found on both appetitive trials using sucrose and aversive trials using air puff, showing that these neurons belong to a velocity control circuit that can be used for any number of purposes, whether to seek reward or to avoid harm. In support of this conclusion, mimicry of the phasic activation of DA neurons with selective optogenetic stimulation could also generate movements. Contrary to the popular hypothesis that DA neurons encode reward prediction errors, our results suggest that nigrostriatal DA plays an essential role in controlling the kinematics of voluntary movements. We hypothesize that DA signaling implements gain adjustment for adaptive transition control, and describe a new model of the basal ganglia (BG) in which DA functions to adjust the gain of the transition controller. This model has significant implications for our understanding of movement disorders implicating DA and the BG.

Keywords: basal ganglia; dopamine; movement; reward prediction error; striatum; substantia nigra.


Figures

Figure 1
Figure 1
Behavior and video tracking in unrestrained mice. (A) Mice perched on an elevated platform housed in a tube, wearing a miniaturized 16 channel wireless headstage (~3.8 g). The camera (not shown) is facing the animal. (B) Illustration of movement trajectory. The mouse starts to move following presentation of the cue (CS), and moves again following the presentation of the reward (US, 13 μl 20% sucrose solution). Each color illustrates the path on a single trial, showing variability from trial to trial. (C) Illustration of the Pavlovian trace conditioning task used (Barter et al., 2015). (D) Cartoon illustration of the movements. Top row illustrates movement toward the spout; bottom row illustrates movement back to the starting position. (E) Illustration of movement tracked by the head LED. Pressure pads were placed underneath the animal, so that changes in pressure exerted by the hind paws can be measured. Pressure pad measures as well as video tracking of the tail demonstrate that the movements were not restricted to the head. Position coordinates are mm from frame edge.
Figure 2
Figure 2
Identification of DA neurons in the substantia nigra. (A) Classification of a putative DA neuron and a non-DA neuron using principal component analysis (PCA). (B) Representative waveforms of putative DA neurons. (C) Summary of electrode placements shown in coronal brain sections take from the Allen Brain Atlas (Lein et al., 2006). (D) Average firing rate and spike width (FWHM, full width at half maximum) of putative DA neurons and non-DA neurons. DA neurons are characterized by lower firing rates and wider spike widths (unpaired t-tests, ps < 0.0001).
Figure 3
Figure 3
“Burst” DA neurons show positive correlation with kinematic variables. (A) Firing rate of representative neuron showing positive correlation with vector components of velocity and acceleration. Two major movements are detected during the trial, one in response to the cue and the other in response to reward delivery. These are displayed separately. “Velocity up” means velocity in the upward direction. Blue arrows indicate movement direction, but note that only the vector components are indicated. Actual movements would consist of both x and y components. The correlation analysis uses data displayed in the raster plots below. A 1 s peri-event window (either cue or reward) was used. (B) Peri-event raster plots of the neurons and the correlated kinematic variables. (C) The major alternative kinematic variables are shown. These are not highly correlated with neural activity as determined by our unbiased cross-correlation analysis.
Figure 4
Figure 4
“Pause” DA neurons is negative correlated with kinematic variables. (A) Firing rate of representative neuron showing negative correlation with vector components of velocity and acceleration. Two major movements are detected during the trial, one in response to the cue and the other in response to reward delivery. These are displayed separately. (B) Peri-event raster plots of the neurons and the correlated kinematic variables. (C) The major alternative kinematic variables are shown.
Figure 5
Figure 5
Continuous correlation between neural activity and kinematics. Illustration of a representative neuron and its correlation with kinematics independent of task-related events such as cue and reward. To dissociate kinematic variables from these task events. Rather than selecting only data from the trial, we performed an unbiased correlation between firing rate and the kinematic variables for the entire session, including inter-trial-intervals. This unbiased analysis was used to classify the neurons.
Figure 6
Figure 6
Selectivity of DA responses. To illustrate the direction selectivity of DA neurons, we compared the session-wide cross-correlation between neural activity and velocity in opposite directions. Shown are two examples in which the cell is positive correlated with movement in one direction and negatively correlated with movement in the opposite direction. This pattern is similar to what we observed previously in SNr GABAergic output neurons (Barter et al., 2015).
Figure 7
Figure 7
Correlation between firing rate and acceleration is similar on appetitive (sucrose reward) and aversive (air puff) trials. (A) An example of a positively correlated DA neuron on reward trials. The red line represents average movement trajectory from the session. (B) The same neuron on air puff trials. Note that the actual trajectories differed significantly between reward and air puff trials, but the upward components of velocity are similar, as shown here. (C) An example of a negatively correlated DA neuron on reward trials. (D) The same neuron on air puff trials.
Figure 8
Figure 8
Population data for DA neurons on rewarded and air puff trials. (A) Different classes of DA neurons show comparable firing rates. (B) Using cross correlation analysis, we also found the lag is much longer for negatively correlated neurons, suggesting that, in these neurons, a pause in firing precedes some movement.(C) The proportion of positively and negatively correlated neurons is similar for aversive and rewarding sessions.
Figure 9
Figure 9
Lateralization of direction-specific neurons. Among velocity-related DA neurons, there are more rightward neurons in the left nigra, and more leftward neurons in the right nigra. There was no significant lateralization among acceleration-related neurons, though the sample size is much smaller.
Figure 10
Figure 10
Expression of channelrhodopsin 2 in dopamine neurons in Th::Ai32 mice. (A) Locations of bilateral optic fibers based on histological verification of coronal brain slices. Representative GFP fluorescence, indicating ChR2 expression, is colocalized with TH in the substantia nigra of Th::Ai32 transgenic mice. Scale bar is 50 μm (upper panels). Lower panels are zoomed in images from the box shown in the upper right panel (scale bar 5 μm). (B) GFP fluorescence is absent in Th-Cre control mice. Same conventions as (A). (C) Optic fiber placements for Th::Ai32 (n = 4; black circles) or Th-Cre (n = 3; yellow circles) mice. Atlas images are from the Allen Brain Atlas (Lein et al., 2006). Available from: http://mouse.brain-map.org/.
Figure 11
Figure 11
Optogenetic stimulation of DA neurons can elicit movements. (A) To mimic burst firing of DA neurons, we selectively stimulated DA neurons using optogenetics. We generated a transgenic mouse line (Th-Cre × Ai32) to selectively express ChR2 in DA (tyrosine hydroxylase-positive) neurons. A brief stimulation at 40 Hz (3 ms pulse width, 5 pulses) generated movement, in the ChR2 (Th::Ai32) mouse but not in a control mouse (Th-Cre) that also received the same light stimulation. Control mice were implanted with fibers and stimulated using identical procedures. Red trace represents movement trajectory. (B) Peak speed and distance for ChR2 (Th::Ai32) and control (Th-Cre) mice. *p < 0.05. (C) Left, movement kinematics plotted for different stimulation frequencies (11, 15, and 25 Hz, 3 ms pulse width, 1 s duration. (D) Peak speed during stimulation train and distance traveled (at the end of the train) at different stimulation frequencies. *p < 0.05.
Figure 12
Figure 12
Detailed movement kinematics during optogenetic stimulation. (A) Representative horizontal (x) and vertical (y) components of the movements in a control mouse (Th-Cre). Position, velocity, and acceleration are plotted separately. Red traces show movement trajectories produced by the stimulation. (B) Representative data from a Th::Ai32 mouse.
Figure 13
Figure 13
Comparison of putative nigral GABA and DA neurons from the same electrode array. (A) The activity of the GABA neuron reflects y position coordinates, an example of representation of instantaneous position coordinates reported in our recent study (Barter et al., 2015). The activity of DA neuron reflects velocity in the upward direction. If we take the derivative of the GABA output, we can generate a mirror image of the DA activity. This result, then, is in support of disinhibition: the reduction in GABA output is accompanied by an increase in DA firing. Note that these projections are mostly collaterals of fibers terminating in other areas such as the tectum and thalamus. Cross-correlogram shows the relationship between DA firing and the derivative of the GABA output from the entire session. (B) Another example illustrating the relationship between DA and GABA neurons from a different mouse.
Figure 14
Figure 14
Proposed model for DA modulation of striatal outputs. (A) SNr neurons receive projections from the striatum and external globus pallidus, via the direct (D, striatonigral) and indirect (I, striatopallidal) pathways. The net effect on the SNr could be either inhibitory (minus sign) or excitatory (disinhibitory, plus sign). Both types of signals represent velocity error signals from the velocity controller. The dorsal striatum is hypothesized to contain at least four different modules, each responsible for movement in a specific direction. Striatal neurons can signal velocity error signals (Kim et al., 2014), which is integrated by the SNr and converted into position reference signal to position controllers in the midbrain and diencephalon (Barter et al., 2015). Using the outputs from the different modules, this circuit can perform vector addition to generate the actual movement vector. The magnitude of the signal entering the integrator is proportional to the rate of change in the integrator output. (B) Illustration of activity in the BG circuit, using a square pulse to represent a transient burst of action potentials with constant firing rate from striatal projection neurons. Dotted lines indicate altered firing rates as a result of DA modulation. DA is known to exert opposite effects on striatonigral neurons and striatopallidal neurons. Striatonigral neurons, which express D1 receptors, are increased by D1 activation, whereas striatopallidal neurons are inhibited by D2 activation(Gerfen and Surmeier, 2011). Moreover, activation of D1 receptors can also potentiate GABA release at the striatonigral terminals (Chuhma et al., 2011), whereas activation of D2 receptors can reduce GABA release at the pallidonigral terminals (Connelly et al., ; de Jesús Aceves et al., 2011). The net effect is consistent for the targets of SNr output. DA modulation has the net effect of potentiating the firing rate in a given position vector component, and further suppressing the antagonistic component. By increasing the rate of change in the position reference, the actual movement velocity is increased. As shown, both movement amplitude and speed are altered, but these variables can be independently controlled.
Figure 15
Figure 15
Model of cascade control hierarchy for velocity and position control. The velocity control system is hierarchically higher than the position control system. There are multiple position controllers, including those for orientation and body configuration, which can command hierarchically lower controllers for joint angle, muscle length, and muscle tension (not shown here). The lowest level is the tension or force controller, with alpha motor neurons acting as the comparator and muscles as the output function (Yin, 2014a).

References

    1. Alchian A. A., Allen W. R. (1977). Exchange and Production: Competition, Coordination, and Control. Belmont, CA: Wadsworth Publishing Company.
    1. Alexander G. E., DeLong M. R., Strick P. L. (1986). Parallel organization of functionally segregated circuits linking basal ganglia and cortex. Annu. Rev. Neurosci. 9, 357–381. 10.1146/annurev.ne.09.030186.002041 - DOI - PubMed
    1. Barter J. W., Castro S., Sukharnikova T., Rossi M. A., Yin H. H. (2014). The role of the substantia nigra in posture control. Eur. J. Neurosci. 39, 1465–1473. 10.1111/ejn.12540 - DOI - PubMed
    1. Barter J. W., Li S., Sukharnikova T., Rossi M. A., Bartholomew R. A., Yin H. H. (2015). Basal ganglia outputs map instantaneous position coordinates during behavior. J. Neurosci. 35, 2703–2716. 10.1523/JNEUROSCI.3245-14.2015 - DOI - PMC - PubMed
    1. Boyden E. S., Zhang F., Bamberg E., Nagel G., Deisseroth K. (2005). Millisecond-timescale, genetically targeted optical control of neural activity. Nat. Neurosci. 8, 1263–1268. 10.1038/nn1525 - DOI - PubMed