. 2015 May 28:7:85.
doi: 10.3389/fnagi.2015.00085. eCollection 2015.

Myogenic-specific ablation of Fgfr1 impairs FGF2-mediated proliferation of satellite cells at the myofiber niche but does not abolish the capacity for muscle regeneration

Affiliations

Myogenic-specific ablation of Fgfr1 impairs FGF2-mediated proliferation of satellite cells at the myofiber niche but does not abolish the capacity for muscle regeneration

Zipora Yablonka-Reuveni et al. Front Aging Neurosci. .

Abstract

Skeletal muscle satellite cells (SCs) are Pax7(+) myogenic stem cells that reside between the basal lamina and the plasmalemma of the myofiber. In mature muscles, SCs are typically quiescent, but can be activated in response to muscle injury. Depending on the magnitude of tissue trauma, SCs may divide minimally to repair subtle damage within individual myofibers or produce a larger progeny pool that forms new myofibers in cases of overt muscle injury. SC transition through proliferation, differentiation and renewal is governed by the molecular blueprint of the cells as well as by the extracellular milieu at the SC niche. In particular, the role of the fibroblast growth factor (FGF) family in regulating SCs during growth and aging is well recognized. Of the several FGFs shown to affect SCs, FGF1, FGF2, and FGF6 proteins have been documented in adult skeletal muscle. These prototypic paracrine FGFs transmit their mitogenic effect through the FGFRs, which are transmembrane tyrosine kinase receptors. Using the mouse model, we show here that of the four Fgfr genes, only Fgfr1 and Fgfr4 are expressed at relatively high levels in quiescent SCs and their proliferating progeny. To further investigate the role of FGFR1 in adult myogenesis, we have employed a genetic (Cre/loxP) approach for myogenic-specific (MyoD(Cre)-driven) ablation of Fgfr1. Neither muscle histology nor muscle regeneration following cardiotoxin-induced injury were overtly affected in Fgfr1-ablated mice. This suggests that FGFR1 is not obligatory for SC performance in this acute muscle trauma model, where compensatory growth factor/cytokine regulatory cascades may exist. However, the SC mitogenic response to FGF2 is drastically repressed in isolated myofibers prepared from Fgfr1-ablated mice. Collectively, our study indicates that FGFR1 is important for FGF-mediated proliferation of SCs and its mitogenic role is not compensated by FGFR4 that is also highly expressed in SCs.

Keywords: MyoDCre; Pax7; alpha7 integrin; cardiotoxin injury; fibro/adipogenic progenitors; fibroblast growth factor; muscle spindles; satellite cells.


Figures

FIGURE 1
FIGURE 1
Fgfr expression in freshly isolated SCs from limb and diaphragm muscles of MyoDCre/+/R26mTmG/+ mice. Myogenic and non-myogenic cell populations were sorted by flow cytometry (based on GFP and Tomato fluorescence, respectively, and cell surface antigens) and analyzed by quantitative RT-PCR. Gene expression values were normalized to Eef2 reference gene expression (ΔCt). Average Ct values for Eef2 gene (±SD) were 23.49 ± 0.09 (limb myogenic), 22.90 ± 0.04 (diaphragm myogenic), 20.84 ± 0.01 (limb non-myogenic), and 20.42 ± 0.01 (diaphragm non-myogenic).
FIGURE 2
FIGURE 2
MyoD-driven Cre induces effective deletions of Fgfr1 and Fgfr2 in the myogenic lineage without modulating gene expression levels of Fgfr3 and Fgfr4. Myogenic (GFP+) and non-myogenic (Tomato+) cell populations were sorted by flow cytometry (as in Figure 1) from limb and diaphragm muscles (denoted as L and D, respectively) of MyoDCre/+/R26mTmG/+/Fgfr1fl/fl/Fgfr2fl/fl (mR1Δ/Δ/R2Δ/Δ) and control MyoDCre/+/R26mTmG/+ (R1+/+/R2+/+) mice. (A) Representative images of sorted GFP+ and Tomato+ cell populations isolated from hindlimb muscles and cultured for 7 days before being processed for simultaneous DNA and RNA isolation and further PCR and RT-PCR analyses, respectively. As shown here, the myogenic (GFP+) cultures displayed the initiation of myotube formation that became more prominent by culture days 10–14 (not shown), while the non-myogenic (Tomato+) cultures were void of myotubes. (B) PCR analysis of the presence of the different Fgfr1 and Fgfr2 alleles (wt, flox, or Δ alleles) at the genomic level. The detection of PCR products of the Cre-mediated genomic deletions (Δ) solely in myogenic (GFP+) cells confirms the muscle-specific deletion of Fgfr1 and Fgfr2 genes. (C) Semi-quantitative RT-PCR analysis of Fgfr transcript levels. Fgfr1 and Fgfr2 transcripts were absent in myogenic (GFP+) cells from mR1Δ/Δ/R2Δ/Δ mice (in agreement with the genomic analysis), while expressed at a relatively high (Fgfr1) and low (Fgfr2) levels, in control myogenic (GFP+) cells from R1+/+/R2+/+ mice. In contrast, Fgfr3, Fgfr4, and c-Met were each detected at a similar level in the myogenic cultures from mR1Δ/Δ/R2Δ/Δ vs. R1+/+/R2+/+ mouse strains. The observed higher Fgfr4 expression levels in diaphragm (vs. limb) myogenic cultures from both mR1Δ/Δ/R2Δ/Δ and R1+/+/R2+/+ mice appear to coincide with the higher myogenin expression levels observed.
FIGURE 3
FIGURE 3
Muscle tissue of adult mR1Δ/Δ/R2Δ/Δ mice does not appear different from that of control muscle from R1+/+/R2+/+ mice. Representative images of H&E stained cross sections of TA/EDL from 10-month-old (A) mR1Δ/Δ/R2Δ/Δ and (B) R1+/+/R2+/+ mice. For each panel, regions delineated in the low magnification image of the whole TA/EDL (A,B) are shown as higher magnification views (A1–B2) identified with corresponding colored frames. Muscles from both mouse strains harbored typical histology with larger and smaller diameter myofibers with peripheral nuclei.
FIGURE 4
FIGURE 4
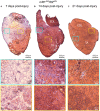
Muscle tissue of adult mR1Δ/Δ/R2Δ/Δ mice retains regenerative activity. Representative images of H&E stained cross sections of TA/EDL from 4-month-old mR1Δ/Δ/R2Δ/Δ mice, showing extensive damage at 7 days post cardiotoxin-induced injury, and progressive recovery at 14 and 21 days post-injury. For each panel, regions delineated in the low magnification image of the whole TA/EDL are shown as higher magnification views (A1–C2) identified with corresponding colored frames; dotted lines in the low magnification images delineate the outer limits of the region that has been effectively injured. Morphology of control contralateral TAs (NaCl-injected, not shown) appeared similar to that of the uninjured muscle depicted in Figure 3. (A) As seen on day 7 post-injury, cardiotoxin injection caused massive myofiber degeneration, resulting in large necrotic regions in which empty remnants of the original myofibers (A1) and infiltration of inflammatory cells (A2) are detected; regions with small regenerating myofibers with central myonuclei (hallmark of regenerating myofibers) were occasionally observed (A2). (B) On day 14 post-injury, regenerating myofibers were more abundant (B2), but regions showing infiltration of inflammatory cells were still occasionally present (B1); asterisk in (B) and (B2) indicates the scar left at the needle injection point. (C) By day 21 post-injury, most of the original injured region showed successful regeneration based on the presence of larger (relative to day 14) myofibers containing central nuclei and overall tissue morphology (C2); infiltration of inflammatory cells was only minimally detected at this stage (C1).
FIGURE 5
FIGURE 5
Fluorescent images of cross sections prepared from TA isolated 21 days post-injury from a 4-month-old mR1Δ/Δ/R2Δ/Δ mouse (also harboring the R26mTmG allele) depicting GFP and Tomato fluorescence, indicative of myogenic and non-myogenic structures, respectively, with DAPI+ nuclei. (A–A”) The use of the R26mTmG allele together with the MyoDCre driver (used for recombining the floxed Fgfr1 and Fgfr2 alleles) demonstrates that as expected, the regenerated myofibers identified by their central nuclei, were GFP+, hence, of MyoD lineage origin. The capillaries and connective tissue surrounding myofibers are Tomato+ (i.e., of non-MyoD+ origin). (B–B”) In addition to the standard myofibers (extrafusal), a muscle spindle (arrowhead, higher magnification view in top left insert) can be observed within a regenerating region. While the spindle capsule and the material surrounding each intrafusal myofiber are of a non-MyoD+ origin (Tomato+), similar to the standard myofibers, the intrafusal myofibers are of MyoD-lineage origin (GFP+). Note the distinctive smaller diameter size of the intrafusal myofibers compared to the larger extrafusal myofibers. Asterisk indicates the scar (Tomato+) left at the needle injection point. Notably, as shown in panels (A) and (B), sites with groups of smaller diameter extrafusal myofibers were observed in addition to the larger diameter myofibers. Morphology of control contralateral TAs (NaCl-injected, not shown) exhibited no differences when compared to uninjured muscle depicted in Figure 3.
FIGURE 6
FIGURE 6
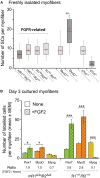
Satellite cells (SCs) in isolated EDL myofibers from mR1Δ/Δ/R2Δ/Δ mice do not display a drastic change in their number but exhibit impaired proliferative response to FGF2. (A) Quantification of SCs in freshly isolated myofibers from different mouse strains as listed under the X-axis. SCs were quantified on individual myofibers by Pax7 immunostaining combined with DAPI-staining to highlight both SCs and myonuclei. Data are summarized as boxplots, depicting the quartile distribution and mean ± SEM (red marks) for the number of SCs per myofiber; the whiskers on each side of the box are taken to the minimum and maximum values. MyoD-null and α7integrin-null data are included for comparison, as these mutations do drastically affect SC numbers. For each strain as listed from left to right under the X-axis, the number of myofibers analyzed was 48, 18, 54, 18, 120, 96, 88, and 95, respectively. (B) Single myofibers were maintained in suspension for 3 days with or without FGF2 supplement (5 ng/ml), then fixed and analyzed by immunostaining for the expression of the myogenic markers Pax7, MyoD and myogenin as a means to investigate SC dynamics. For typical Pax7/MyoD/myogenin immunostaining images see our previous mouse myofiber studies (Yablonka-Reuveni et al., 1999a; Shefer et al., 2006; Keire et al., 2013); examples of MyoD staining that depict the proliferative response of SCs to FGF2 supplementation are shown in Figure 7. To quantify the effect of FGF2 on SCs, the ratio in average cell numbers between FGF2-treated and untreated myofibers was determined for each marker (indicated under X-axis legend). Asterisks denote statistically significant differences in the number of labeled cells per myofiber between FGF2-treated and untreated myofibers (single asterisk p < 0.05; triple asterisks p < 0.001). For each condition as listed from left to right under the X-axis, the number of myofibers analyzed was 19, 21, 18, 21, 16, 17, 17, 12, 16, 12, 15, and 13, respectively.
FIGURE 7
FIGURE 7
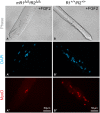
Examples of EDL myofibers isolated from (A–A”) mR1Δ/Δ/R2Δ/Δ or (B–B”) R1+/+/R2+/+ mice and cultured in suspension for 3 days with FGF2 supplement and then immunostained for MyoD, which is expressed by proliferating and differentiating SCs. DAPI counterstaining detected both the MyoD+ cells and the myofiber nuclei, but only nuclei at the focal level of the MyoD+ cells can be seen in the images shown. The apparent difference in diameter between the two examples of myofibers shown in (A) vs. (B) is arbitrary and does not reflect a strain difference, as clearly demonstrated by the cross section images shown in Figure 3.
FIGURE 8
FIGURE 8
Immuno-detection of FGFR4 protein in muscle tissue and primary myogenic culture from wildtype mice. (A,B”) Detection of FGFR4 in hindlimb muscle sections; positive cells are presumptive SCs based on their location underneath the myofiber basal lamina highlighted by laminin immunostaining Notably, SC identification using Pax7 immunostaining is precluded as it would require antigen retrieval step which is not compatible with the conditions used here for FGFR4 detection on unfixed cryosections. As expected, SCs (FGFR4+) were more abundant in (A–A”) the younger aged mouse (12 days old, gastrocnemius muscle) than in (B–B”) the 30-day-old mouse (TA muscle). Corresponding arrowheads denote common locations in the lower and higher magnification images. (C–D’) Detection of FGFR4 in primary myogenic cultures from adult mice; the myogenic nature of the cultured cells was verified with double immunostaining for desmin as in (Yablonka-Reuveni et al., 1999a; data not shown). (C,C’) FGFR4 protein expression is unique to the myogenic cells while residual non-myogenic cells present in this standard primary culture are negative. (D,D’) FGF2 treatment (20 ng/ml in DMEM containing 2% horse serum for 16 hours) of mouse primary myogenic cultures results in the downregulation of FGFR4. Following the overnight treatment with FGF2, FGFR4-immunosignal is restricted to a perinuclear compartment likely reflecting receptor desensitization through its internalization and targeting to endosomes.

Similar articles

Cited by

References

    1. Abe G., Ide H., Tamura K. (2007). Function of FGF signaling in the developmental process of the median fin fold in zebrafish. Dev. Biol. 304 355–366. 10.1016/j.ydbio.2006.12.040 - DOI - PubMed
    1. Allen R. E., Boxhorn L. K. (1989). Regulation of skeletal muscle satellite cell proliferation and differentiation by transforming growth factor-beta, insulin-like growth factor I, and fibroblast growth factor. J. Cell. Physiol. 138 311–315. 10.1002/jcp.1041380213 - DOI - PubMed
    1. Allen R. E., Dodson M. V., Luiten L. S. (1984). Regulation of skeletal muscle satellite cell proliferation by bovine pituitary fibroblast growth factor. Exp. Cell Res. 152 154–160. 10.1016/0014-4827(84)90239-8 - DOI - PubMed
    1. Alterio J., Courtois Y., Robelin J., Bechet D., Martelly I. (1990). Acidic and basic fibroblast growth factor mRNAs are expressed by skeletal muscle satellite cells. Biochem. Biophys. Res. Commun. 166 1205–1212. 10.1016/0006-291X(90)90994-X - DOI - PubMed
    1. Anderson J. E. (2006). The satellite cell as a companion in skeletal muscle plasticity: currency, conveyance, clue, connector and colander. J. Exp. Biol. 209 2276–2292. 10.1242/jeb.02088 - DOI - PubMed