. 2015 May 27:6:483.
doi: 10.3389/fmicb.2015.00483. eCollection 2015.

Effect of in-feed administration and withdrawal of tylosin phosphate on antibiotic resistance in enterococci isolated from feedlot steers

Affiliations

Effect of in-feed administration and withdrawal of tylosin phosphate on antibiotic resistance in enterococci isolated from feedlot steers

Alicia G Beukers et al. Front Microbiol. .

Abstract

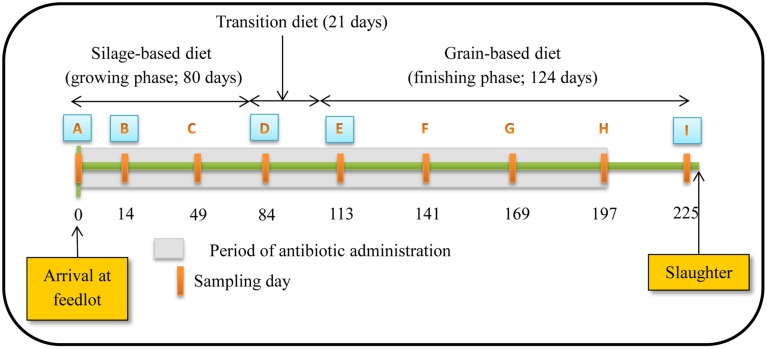
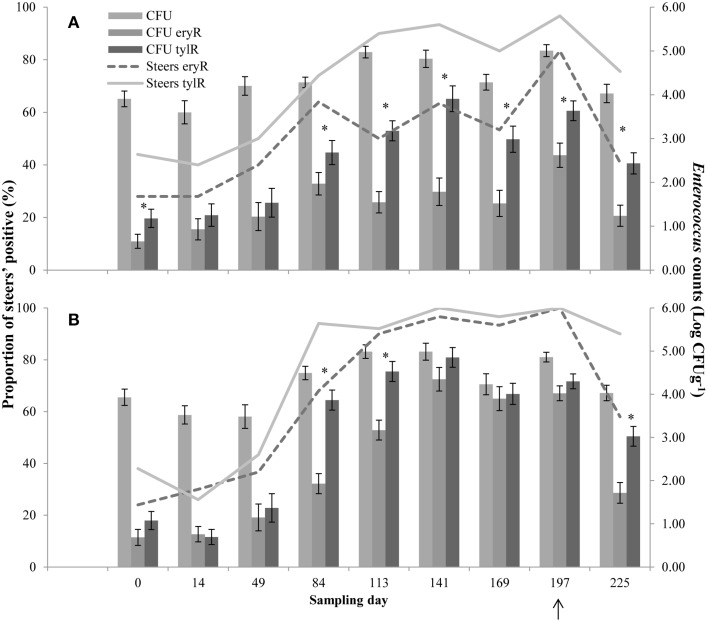
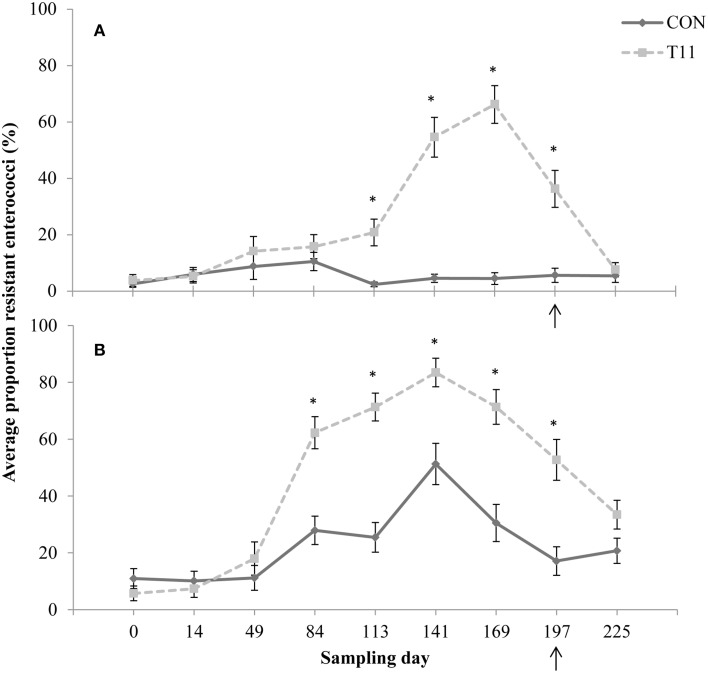
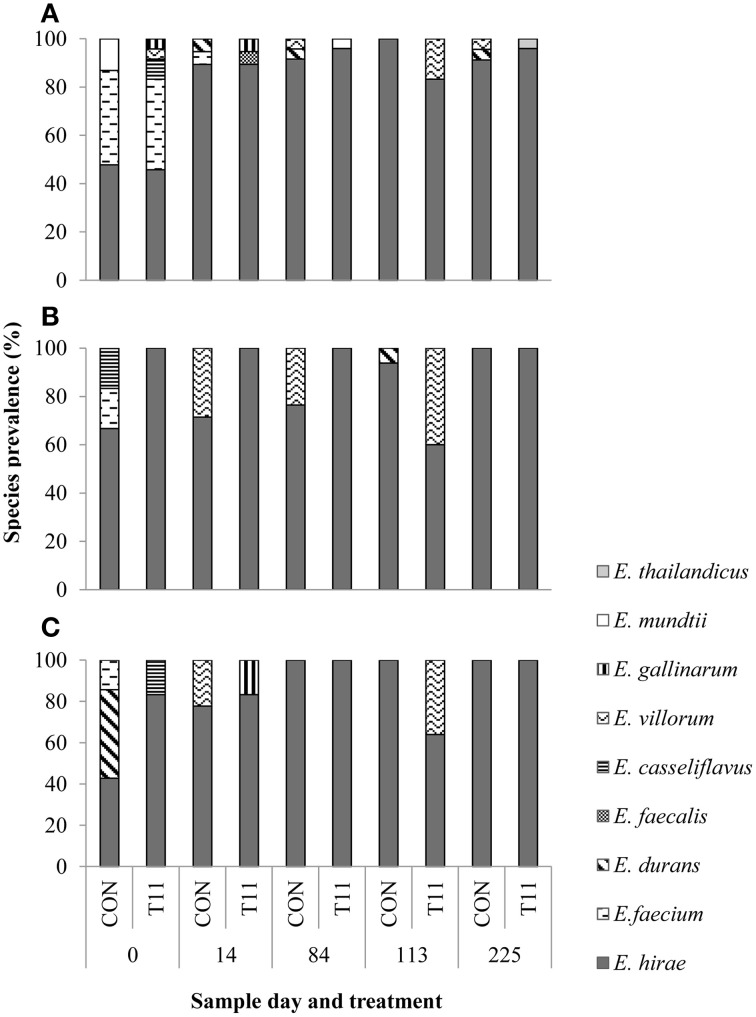
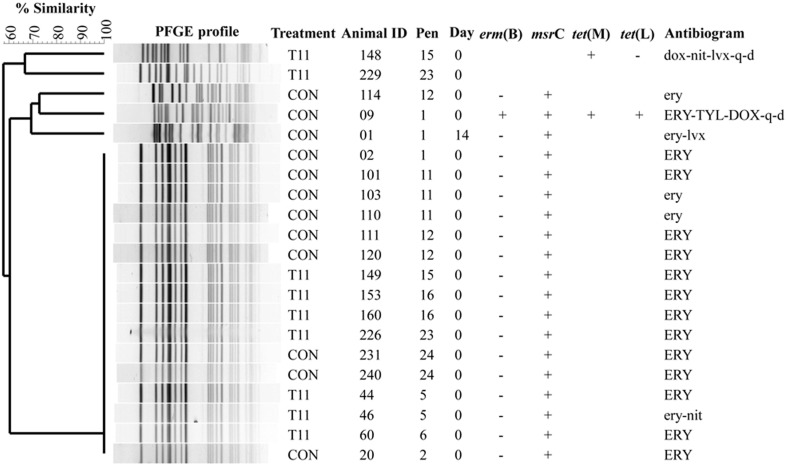
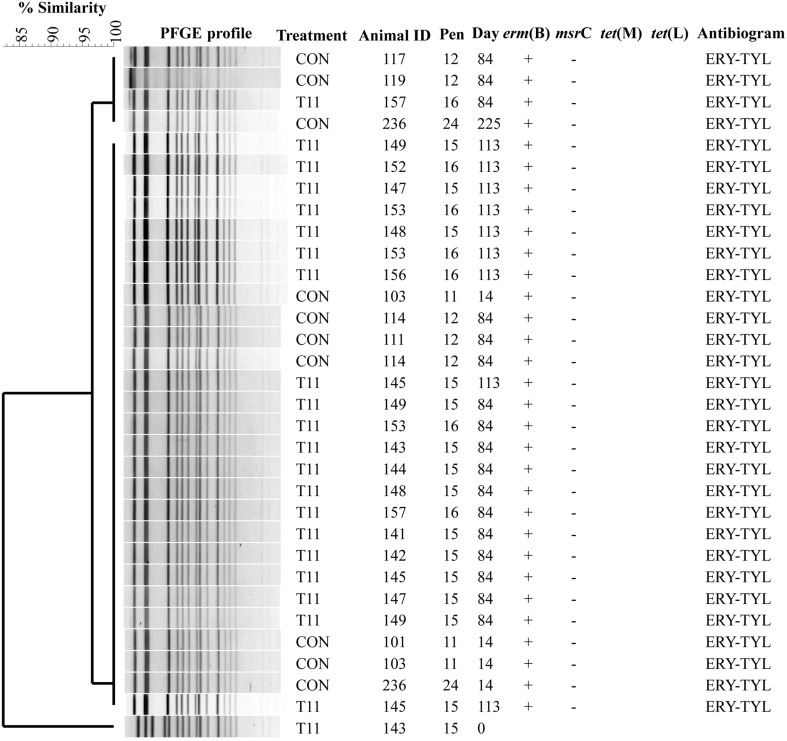
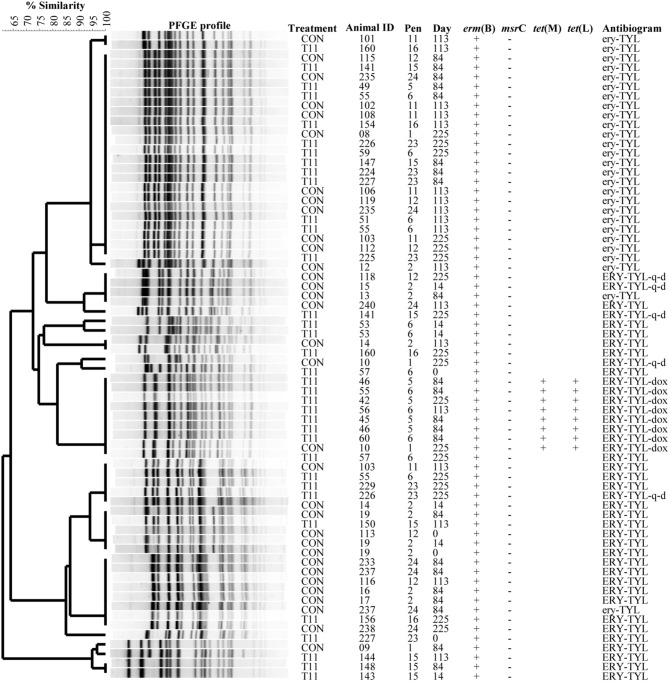
Tylosin phosphate is a macrolide commonly administered to cattle in North America for the control of liver abscesses. This study investigated the effect of in-feed administration of tylosin phosphate to cattle at subtherapeutic levels and its subsequent withdrawal on macrolide resistance using enterococci as an indicator bacterium. Fecal samples were collected from steers that received no antibiotics and steers administered tylosin phosphate (11 ppm) in-feed for 197 days and withdrawn 28 days before slaughter. Enterococcus species isolated from fecal samples were identified through sequencing the groES-EL intergenic spacer region and subject to antimicrobial susceptibility testing, identification of resistance determinants and pulsed-field gel electrophoresis profiling. Tylosin increased (P < 0.05) the proportion of ery(R) and tyl(R) enterococci within the population. Just prior to its removal, the proportion of ery(R) and tyl(R) resistant enterococci began decreasing and continued to decrease after tylosin was withdrawn from the diet until there was no difference (P > 0.05) between treatments on d 225. This suggests that antibiotic withdrawal prior to slaughter contributes to a reduction in the proportion of macrolide resistant enterococci entering the food chain. Among the 504 enterococci isolates characterized, Enterococcus hirae was found to predominate (n = 431), followed by Enterococcus villorum (n = 32), Enterococcus faecium (n = 21), Enterococcus durans (n = 7), Enterococcus casseliflavus (n = 4), Enterococcus mundtii (n = 4), Enterococcus gallinarum (n = 3), Enterococcus faecalis (n = 1), and Enterococcus thailandicus (n = 1). The diversity of enterococci was greater in steers at arrival than at exit from the feedlot. Erythromycin resistant isolates harbored the erm(B) and/or msrC gene. Similar PFGE profiles of ery(R) E. hirae pre- and post-antibiotic treatment suggest that increased abundance of ery(R) enterococci after administration of tylosin phosphate reflects selection for strains that were already present within the gastrointestinal tract of cattle at arrival.

Keywords: antimicrobial resistance; beef cattle; enterococci; erythromycin; subtherapeutic macrolides; tylosin.


Figures

Figure 1
Figure 1
Schematic representation of experiment timeline (Figure reproduced from Sharma et al., 2008). Numbers indicate day of feeding period. Periodic orange rectangles indicate points where fecal samples were collected from steers. A, B, D, E and I represent points where isolates were selected for assessing antibiotic susceptibility, PFGE profiles and identifying resistance determinants. Grey shaded area represents the period that tylosin was administered in the diet.
Figure 2
Figure 2
Proportion of steers positive for eryR enterococci (Steers eryR) or tylR enterococci (Steers tylR) and Enterococcus counts (log CFUg−1) of, total population (CFU), eryR enterococci (CFU eryR) or tylR enterococci (CFU tylR) for CON (A) or T11 (B) treatments. Arrow indicates when antibiotics were withdrawn from the diet. An “*” indicates days for which there was a significant difference between eryR and tylR Enterococcus counts (P < 0.05). For each treatment (day 0, 14, 84, 113, and 225 n = 50; day 49, 141, 169, and 197 n = 30).
Figure 3
Figure 3
Proportion of erythromycin-resistant (A) or tylosin-resistant (B) fecal enterococci isolates for both treatments across all sampling days. Arrow indicates when antibiotics were withdrawn from the diet. Line styles distinguish the treatment. An “*” indicates days for which there was a significant difference between treatments (P < 0.05). For each treatment (day 0, 14, 84, 113, and 225 n = 50; day 49, 141, 169, and 197 n = 30).
Figure 4
Figure 4
Species distribution of characterized isolates from (A) BEA (bile esculin azide agar), (B) BEAE (bile esculin azide agar amended with erythromycin [8 μg/mL]) and (C) BEAT (bile esculin azide agar amended with tylosin [32 μg/mL]). Prevalence was calculated by dividing the number of isolates for each species by the total number of isolates from each sample day and treatment.
Figure 5
Figure 5
Dendrogram of PFGE SmaI profiles from isolates identified as Enterococcus faecium. A “+” indicates PCR positive and “−” indicates PCR negative to the respective genes. A “blank” space indicates the gene was not screened for in the respective isolate. For the antibiogram, upper case denotes complete resistance and lower case denotes incomplete resistance.
Figure 6
Figure 6
Dendrogram of PFGE SmaI profiles from isolates identified as Enterococcus villorum. A “+” indicates PCR positive and “−” indicates PCR negative to the respective genes. A “blank” space indicates the gene was not screened for in the respective isolate. For the antibiogram, upper case denotes complete resistance and lower case denotes incomplete resistance.
Figure 7
Figure 7
Dendrogram of PFGE SmaI profiles from isolates identified as erythromycin resistant Enterococcus hirae. A “+” indicates PCR positive and “−”indicates PCR negative to the respective genes. A “blank” space indicates the gene was not screened for in the respective isolate. For the antibiogram, upper case denotes complete resistance and lower case denotes incomplete resistance.

References

    1. Aarestrup F. M. (1999). Association between the consumption of antimicrobial agents in animal husbandry and the occurrence of resistant bacteria among food animals. Int. J. Antimicrob. Agents 12, 279–285. 10.1016/S0924-8579(99)90059-6 - DOI - PubMed
    1. Alexander T. W., Reuter T., Sharma R., Yanke L. J., Topp E., McAllister T. A. (2009). Longitudinal characterization of resistant Escherichia coli in fecal deposits from cattle fed subtherapeutic levels of antimicrobials. Appl. Environ. Microbiol. 75, 7125–7134. 10.1128/AEM.00944-09 - DOI - PMC - PubMed
    1. Alexander T. W., Yanke L. J., Topp E., Olson M. E., Read R. R., Morck D. W., et al. . (2008). Effect of subtherapeutic administration of antibioitics on the prevalence of antibiotic-resistant Escherichia coli bacteria in feedlot cattle. Appl. Environ. Microbiol. 74, 4405–4416. 10.1128/AEM.00489-08 - DOI - PMC - PubMed
    1. Alfouzan W., Al-Sheriday S., Al-Jabban A., Dhar R., Al-Mutairi A. R., Udo E. (2014). A case of multiple splenic abscesses due to Enterococcus hirae. JMM Case Rep. 1, 3 10.1099/jmmcr.0.001214 - DOI
    1. Anderson J. F., Parrish T. D., Akhtar M., Zurek L., Hirt H. (2008). Antibiotic resistance of enterococci in American bison (Bison bison) from a nature preserve compared to that of enterococci in pastured cattle. Appl. Environ. Microbiol. 74, 1726–1730. 10.1128/AEM.02164-07 - DOI - PMC - PubMed

LinkOut - more resources