. 2015 May 27:6:253.
doi: 10.3389/fimmu.2015.00253. eCollection 2015.

A Systematic Approach to Identify Markers of Distinctly Activated Human Macrophages

Affiliations

A Systematic Approach to Identify Markers of Distinctly Activated Human Macrophages

Bayan Sudan et al. Front Immunol. .

Abstract

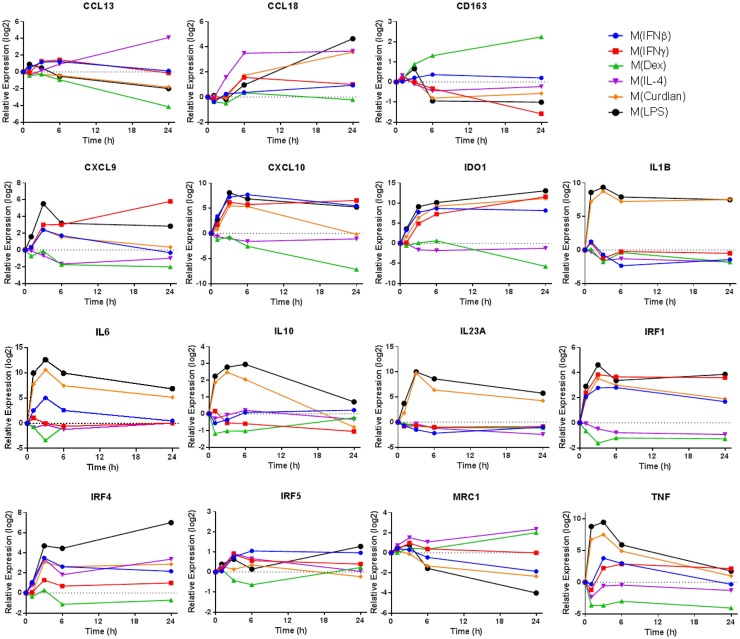
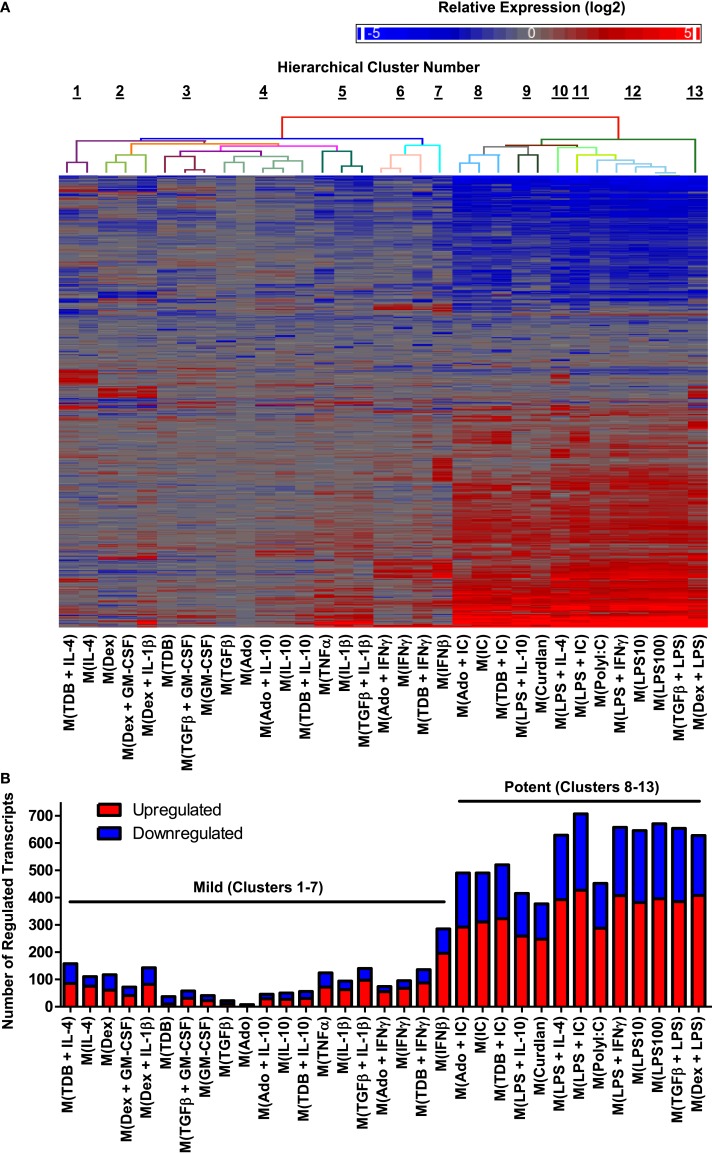
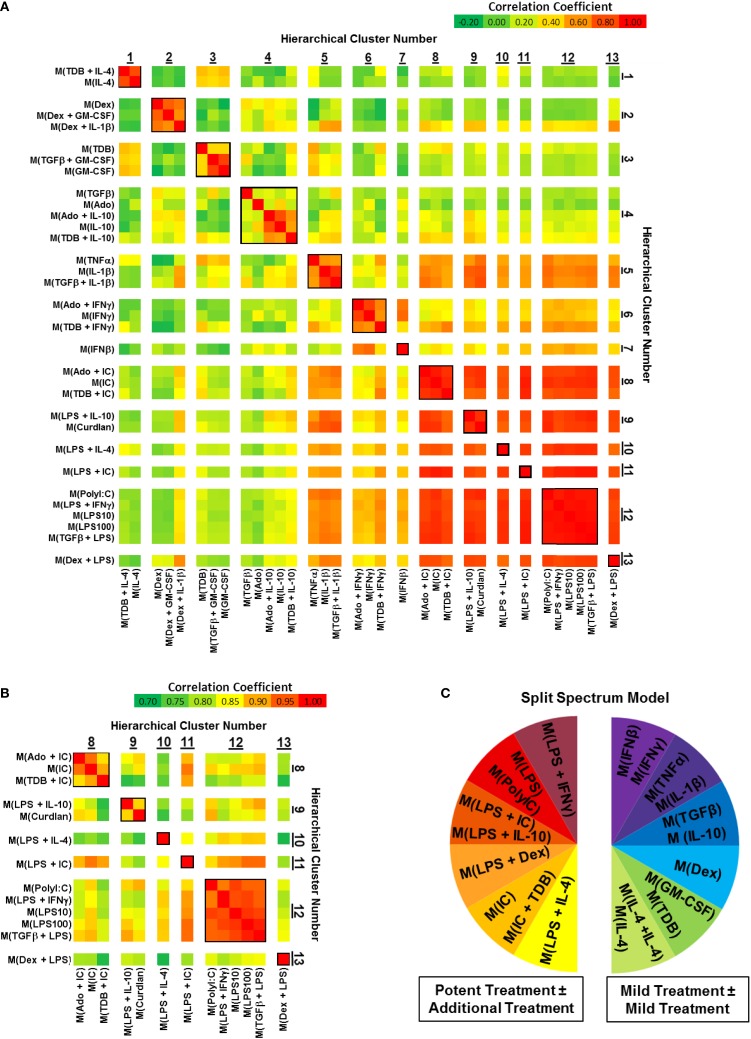
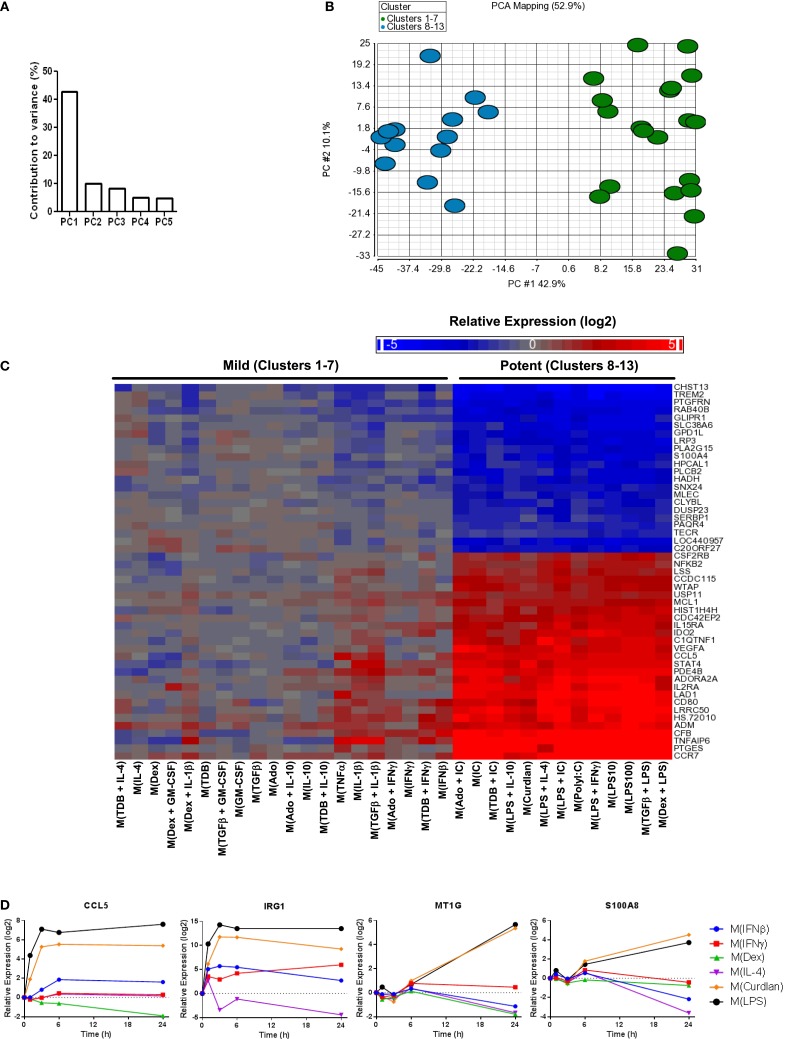
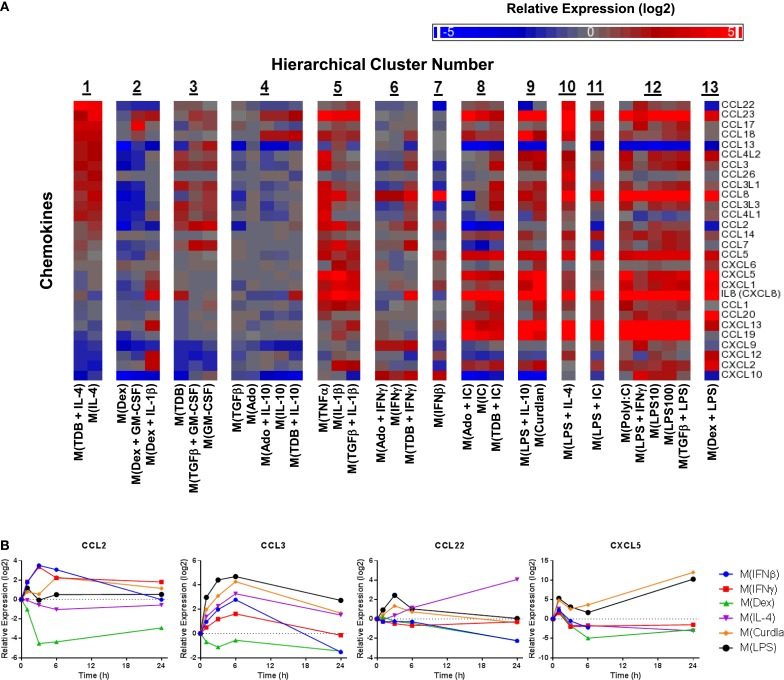
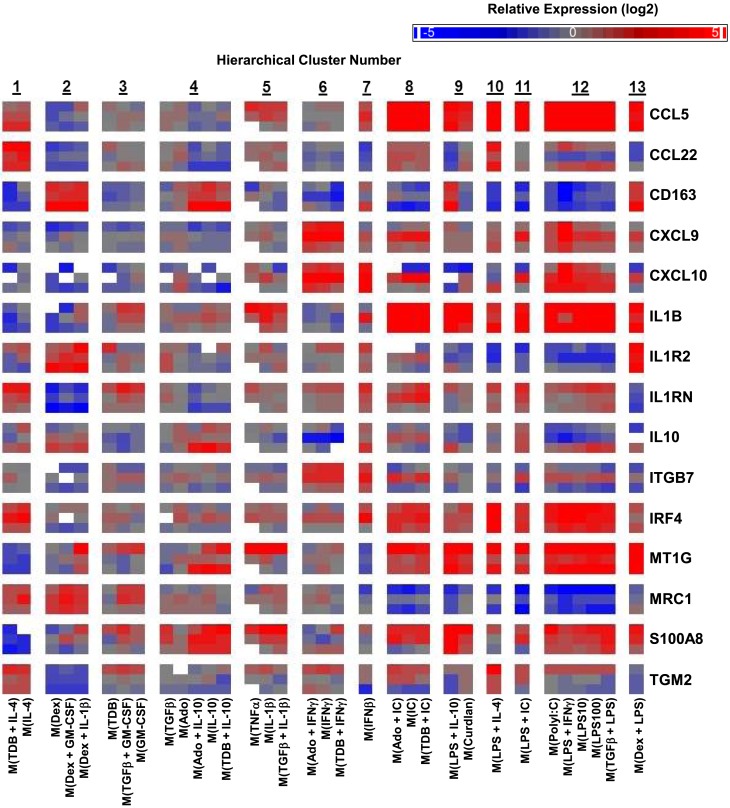
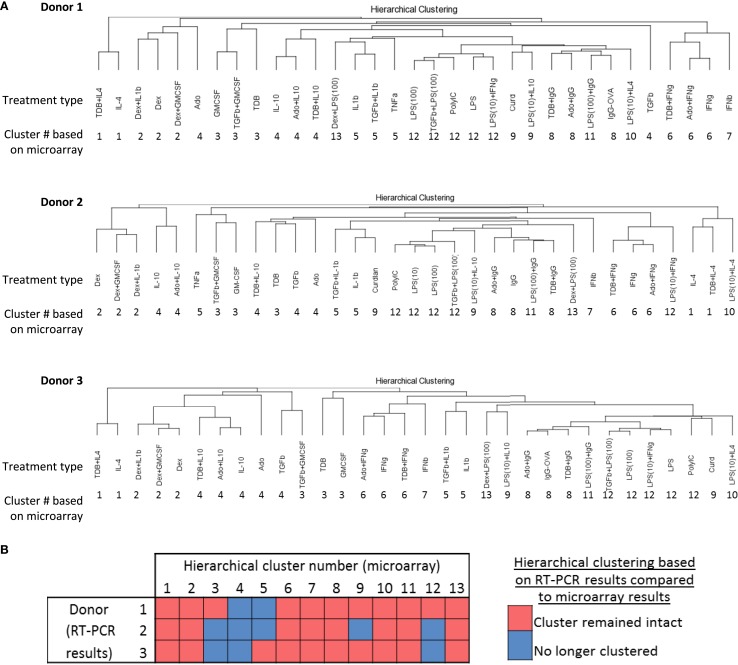
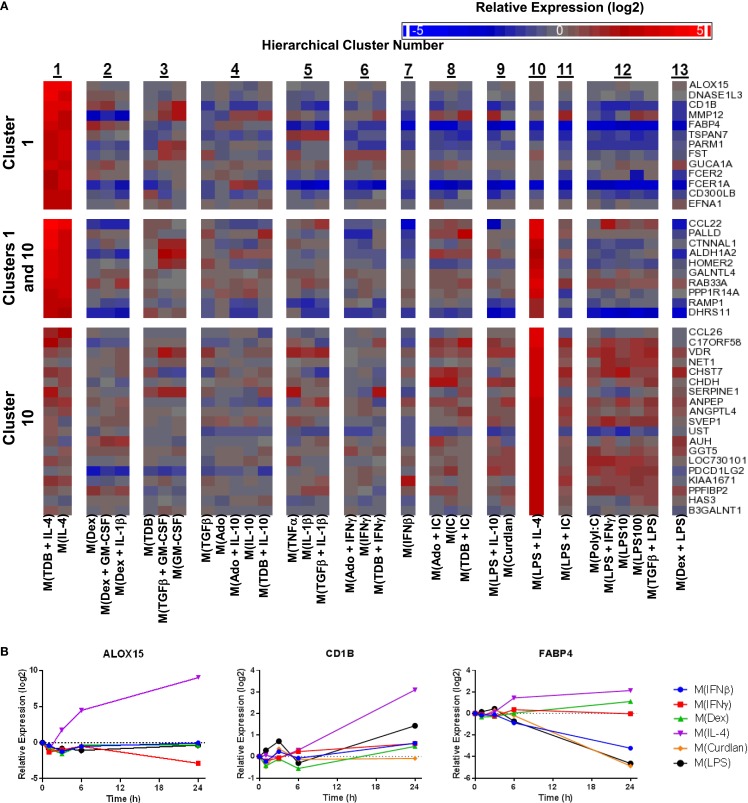
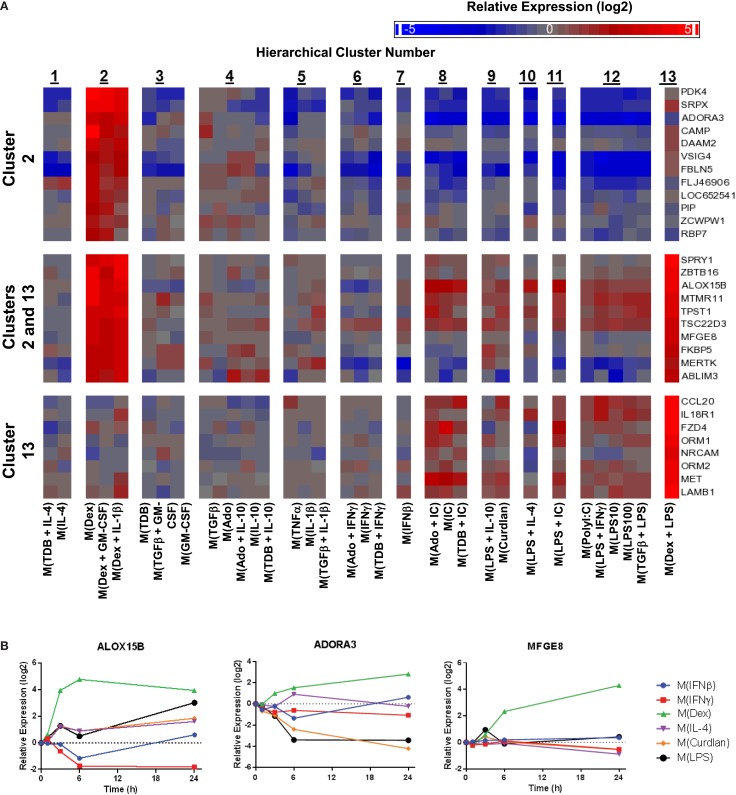
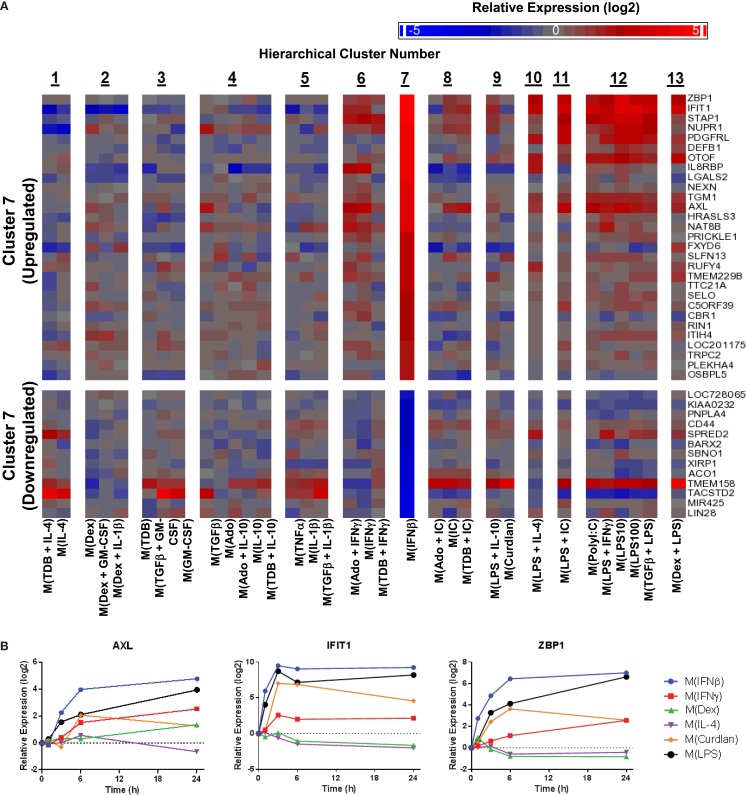
Polarization has been a useful concept for describing activated macrophage phenotypes and gene expression profiles. However, macrophage activation status within tumors and other settings are often inferred based on only a few markers. Complicating matters for relevance to human biology, many macrophage activation markers have been best characterized in mice and sometimes are not similarly regulated in human macrophages. To identify novel markers of activated human macrophages, gene expression profiles for human macrophages of a single donor subjected to 33 distinct activating conditions were obtained and a set of putative activation markers were subsequently evaluated in macrophages from multiple donors using integrated fluidic circuit (IFC)-based RT-PCR. Using unsupervised hierarchical clustering of the microarray screen, highly altered transcripts (>4-fold change in expression) sorted the macrophage transcription profiles into two major and 13 minor clusters. Among the 1874 highly altered transcripts, over 100 were uniquely altered in one major or two related minor clusters. IFC PCR-derived data confirmed the microarray results and determined the kinetics of expression of potential macrophage activation markers. Transcripts encoding chemokines, cytokines, and cell surface were prominent in our analyses. The activation markers identified by this study could be used to better characterize tumor-associated macrophages from biopsies as well as other macrophage populations collected from human clinical samples.

Keywords: activation markers; human macrophages; integrated fluidic circuit RT-PCR; macrophage polarization; microarray.


Figures

Figure 1
Figure 1
Expression kinetics of previously proposed macrophage activation markers. At 1, 3, 6, and 24 h time points, RNA was collected from untreated MDM controls as well as M(IFNβ), M(IFNγ), M(Dex), M(IL-4), M(Curdlan), and M(LPS). Using IFC-based RT-PCR, the changes in expression for each indicated transcript relative to the untreated MDM controls was determined at each time point for the six types of activated MDMs (N = 1).
Figure 2
Figure 2
Hierarchical clustering of gene expression profiles from activated human MDMs separated into 2 major clusters and 13 minor clusters. Microarrays were performed using RNA collected from MDMs at 24 h post-treatment with 33 distinct activation conditions (N = 1). (A) A set of 1874 regulated transcripts defined as having >4-fold change in expression levels relative to untreated controls was compiled and displayed as a heat map (log2 scale). Gene expression profiles were sorted according to unsupervised hierarchical clustering of genes and treatments. Dissimilarity distances between gene expression profiles are displayed using a color-coded dendrogram to indicate 13 hierarchical clusters. See Section “Results” for dissimilarity distance cut-off rationale. Arranged in the same order as shown here, transcript names and quantitation of expression level changes are available in Table S1 in Supplementary Material. (B) Number of upregulated and down-regulated transcripts within each gene expression profile. Potent and mild macrophage activation conditions are indicated.
Figure 3
Figure 3
Comparing correlation coefficients supported the separation of gene expression profiles into two clusters, which can be modeled as a “split spectrum.” Correlation coefficients were calculated for using the 1874 regulated transcript data set (N = 1). (A) Each pairwise combination of the 33 gene expression profiles are displayed as a heat map with a range of coefficients of −0.2 to 1.0. (B) Each pairwise combination of the 13 “potent” gene expression profiles in clusters 8–13 are displayed as a heat map with a restricted range of coefficients from 0.7 to 1.0. (C) A “Split Spectrum” model of macrophage activation can be used to emphasize the high degree of correlation between treatments with at least one potent macrophage-activating stimulus.
Figure 4
Figure 4
Transcripts universally regulated by “potent” macrophage-activating conditions in clusters 8–13 were the largest source of variance in the polarized MDM gene expression profiles. Principal components analysis was performed using the data set of 1874 regulated transcripts from the 33 gene expression profiles. (A) The contribution of PC1–PC5 to the variance is shown. (B) Scatterplot displays gene expression profiles according to PC1 and PC2 scores with color coding based on “mild” (clusters 1–7) and “potent” (clusters 8–13) categorization. (C) The 50 transcripts that contributed the most to PC1 were sorted according to unsupervised hierarchical clustering results. Changes in transcript expression levels relative to untreated MDMs are depicted as a heat map (log2 scale). (D) Using IFC-based RT-PCR and samples from Figure 1, the changes in expression for each indicated transcript relative to the untreated MDM controls was determined at the 1, 3, 6, and 24 h time points for the six types of activated MDMs (N = 1).
Figure 5
Figure 5
Evaluation of chemokines as MDM activation markers. (A) All C–C and C–X–C chemokines were selected from the set of 1874 regulated transcripts and sorted according to average expression level changes in response to the two macrophage-activation treatment conditions within cluster 1. (B) Using IFC-based RT-PCR and samples from Figure 1, the changes in expression for each indicated transcript relative to the untreated MDM controls was determined at the 1, 3, 6, and 24 h time points for the six types of activated MDMs (N = 1).
Figure 6
Figure 6
Variability in donor-to-donor MDM gene expression responses was often limited to specific clusters. IFC-based RT-PCR was used to determine the expression of 48 transcripts (45 putative macrophage activation markers and 3 endogenous controls) in MDMs at 24 h post-treatment with 33 distinct activation conditions (columns) (N = 3). Shown here are the results for 15 of the activation marker transcripts. The RNA collected from the first donor (first row for each indicated transcript) had been used in the microarray studies and the RNA from two additional donors (second and third row for each indicated transcript) was collected in independent experiments. Blank areas within clusters represent samples did not meet the Ct cut-off of 25 or, in the case of the third M(TNFα) sample, did not load properly into the IFC device.
Figure 7
Figure 7
Comparing unsupervised hierarchical clustering of 33 activated macrophage types based on 1874 regulated transcripts against hierarchical clustering based on a 45-transcript subset of putative activation markers. IFC PCR was used to determine the expression of 48 transcripts in MDMs at 24 h post-treatment with 33 distinct activation conditions (columns) (N = 3). The RNA collected from the first donor had been used in the microarray studies and the RNA from two additional donors was collected in independent experiments. Data points were omitted when the ΔCt value was unreliable as defined by either the macrophage activation marker or the endogenous control not meeting the Ct cut-off of 25. (A) Unsupervised hierarchical clustering was performed using calculated ΔΔCt values derived from IFC PCR. Dissimilarity distances between gene expression profiles are displayed as dendrograms for each donor. For comparison purposes, the hierarchical cluster number is displayed below each macrophage-activating treatment type. (B) A summary is shown for comparisons between microarray-derived clusters from donor 1 and IFC PCR-derived clusters from donors 1, 2, and 3.
Figure 8
Figure 8
Evaluation of activation markers in MDMs responding to treatments with IL-4. (A) Putative macrophage activation markers were screened for within the microarray data that met two criteria: (i) a >4-fold expression level change in response to activation conditions that included IL-4 (samples within cluster 1 and/or cluster 10) relative to untreated MDMs and (ii) a >2-fold expression level change relative to the activating conditions that did not include IL-4. (A) Changes in select putative activation markers as determined by microarray analysis are shown as a heat map (log2 scale) (N = 1) (B) Using IFC-based RT-PCR and samples from Figure 1, the changes in expression for each indicated transcript relative to the untreated MDM controls was determined at the 1, 3, 6, and 24 h time points for the six types of activated MDMs (N = 1).
Figure 9
Figure 9
Evaluation of activation markers in MDMs responding to treatments with dexamethasone. (A) Putative macrophage activation markers were screened for within the microarray data that met similar criteria as described in Figure 7A with a focus on transcripts that changed in response dexamethasone treatment (samples within clusters 2 and/or 13). (B) Using IFC-based RT-PCR and samples from Figure 1, the changes in expression for each indicated transcript relative to the untreated MDM controls was determined at the 1, 3, 6, and 24 h time points for the six types of activated MDMs (N = 1).
Figure 10
Figure 10
Evaluation of activation markers in MDMs responding to treatment with IFNβ. (A) Putative macrophage activation markers were screened for within the microarray data that met similar criteria as described in Figure 7A with a focus on transcripts that changed in response IFNβ treatment (cluster 7). (B) Using IFC-based RT-PCR and samples from Figure 1, the changes in expression for each indicated transcript relative to the untreated MDM controls was determined at the 1, 3, 6, and 24 h time points for the six types of activated MDMs (N = 1).

Similar articles

Cited by

References

    1. Stein M, Keshav S, Harris N, Gordon S. Interleukin 4 potently enhances murine macrophage mannose receptor activity: a marker of alternative immunologic macrophage activation. J Exp Med (1992) 176:287–92.10.1084/jem.176.1.287 - DOI - PMC - PubMed
    1. Mantovani A, Sozzani S, Locati M, Allavena P, Sica A. Macrophage polarization: tumor-associated macrophages as a paradigm for polarized M2 mononuclear phagocytes. Trends Immunol (2002) 23:549–55.10.1016/S1471-4906(02)02302-5 - DOI - PubMed
    1. Mills CD, Kincaid K, Alt JM, Heilman MJ, Hill AM. M-1/M-2 macrophages and the Th1/Th2 paradigm. J Immunol (2000) 164:6166–73.10.4049/jimmunol.164.12.6166 - DOI - PubMed
    1. Mosser DM, Edwards JP. Exploring the full spectrum of macrophage activation. Nat Rev Immunol (2008) 8:958–69.10.1038/nri2448 - DOI - PMC - PubMed
    1. Mantovani A, Sica A, Sozzani S, Allavena P, Vecchi A, Locati M. The chemokine system in diverse forms of macrophage activation and polarization. Trends Immunol (2004) 25:677–86.10.1016/j.it.2004.09.015 - DOI - PubMed