. 2015 Jun 15;10(6):e0129091.
doi: 10.1371/journal.pone.0129091. eCollection 2015.

Lead Induces Apoptosis and Histone Hyperacetylation in Rat Cardiovascular Tissues

Affiliations

Lead Induces Apoptosis and Histone Hyperacetylation in Rat Cardiovascular Tissues

Li-Hui Xu et al. PLoS One. .

Abstract

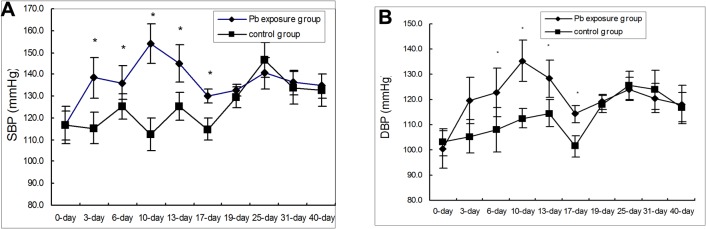
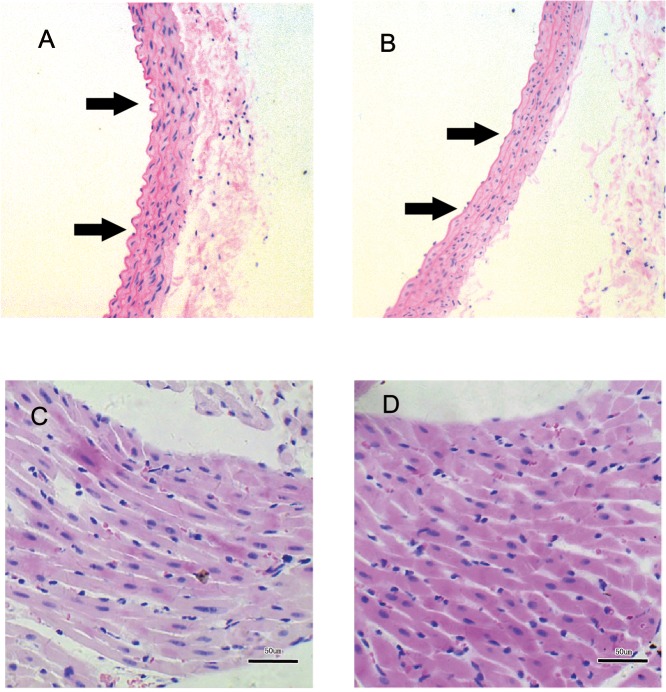
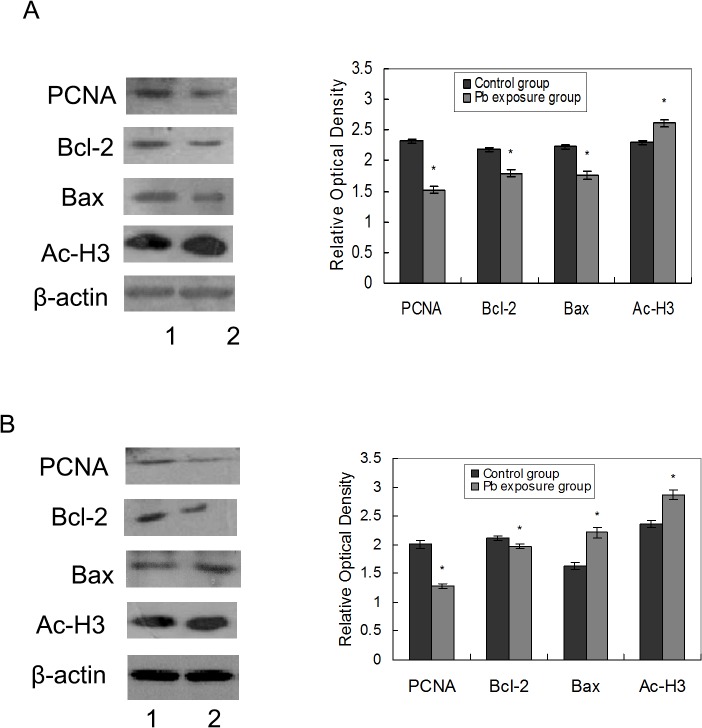
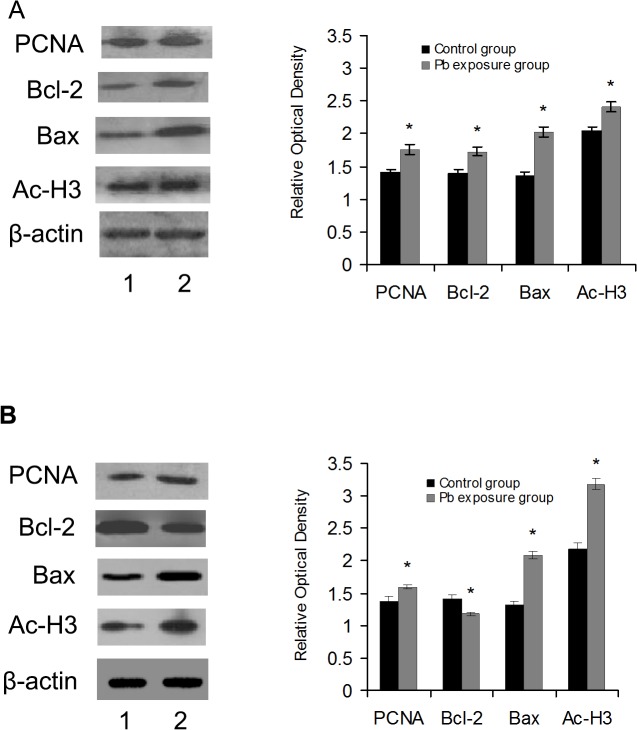
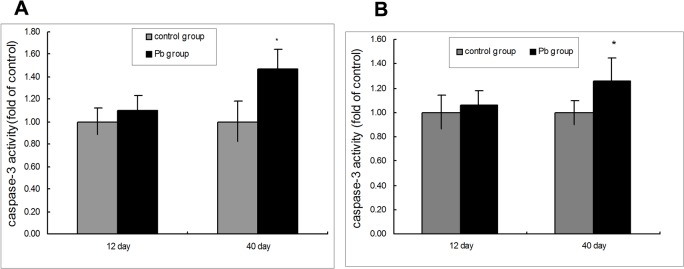
Acute and chronic lead (Pb) exposure might cause hypertension and cardiovascular diseases. The purpose of this study was to evaluate the effects of early acute exposure to Pb on the cellular morphology, apoptosis, and proliferation in rats and to elucidate the early mechanisms involved in the development of Pb-induced hypertension. Very young Sprague-Dawley rats were allowed to drink 1% Pb acetate for 12 and 40 days. Western blot analysis indicated that the expression of proliferating cell nuclear antigen (PCNA) decreased in the tissues of the abdominal and thoracic aortas and increased in the cardiac tissue after 12 and 40 days of Pb exposure, respectively. Bax was upregulated and Bcl-2 was downregulated in vascular and cardiac tissues after 40 days of Pb exposure. In addition, an increase in caspase-3 activity was observed after 40 days of exposure to Pb. In terms of morphology, we found that the internal elastic lamina (IEL) of aorta lost the original curve and the diameter of cardiac cell was enlarged after 40 days. Furthermore, the exposure led to a marked increase in acetylated histone H3 levels in the aortas and cardiac tissue after 12 and 40 days, than that in the control group. These findings indicate that Pb might increase the level of histone acetylation and induce apoptosis in vascular and cardiac tissues. However, the mechanism involved need to be further investigated.


Conflict of interest statement

Competing Interests: The authors have declared that no competing interests exist.

Figures

Fig 1
Fig 1. Effect of Pb exposure on blood pressure.
A. Effects of Pb exposure on systolic blood pressure. B. Effects of Pb exposure on diastolic blood pressure. n = 6 Data are the means ± SD. *p < 0.05 compared with the control group
Fig 2
Fig 2. The histological structure of SD rat aorta and cardiac tissue by H&E staining method at day 40 after Pb exposure.
A is the aorta tissue of control rat and B is the aorta tissue of Pb exposed rat (100×). C is the cardiac tissue of control rat and D is the cardiac tissue of Pb exposed rat (400×).
Fig 3
Fig 3. Effects of Pb on vascular tissue protein expression.
Effects of Pb exposure on the protein expression of PCNA, Bcl-2, Bax, and acetyl-H3 in abdominal and thoracic aorta tissue at 12 days after Pb exposure (A) and 40 days after Pb exposure (B). The corresponding bar graphs represent densitometric quantification. n = 6 experiments. Probability values are indicated above bars: *p < 0.05 versus control. 1 stand for control group, 2 stand for Pb exposure group.
Fig 4
Fig 4. Effects of Pb on cardiac tissue protein expression.
Effects of Pb exposure on the protein expression of PCNA, Bcl-2, Bax and acetyl-H3 in cardiac tissue at 12 day after Pb exposure (A) and 40 day after Pb exposure (B). The corresponding bar graphs represent densitometric quantification. n = 6 experiments. Probability values are indicated above bars: *p < 0.05 versus control. 1 stand for control group, 2 stand for Pb exposure group.
Fig 5
Fig 5. Pb-induced caspase-3 activation in cardiovascular tissue.
(A) Caspase-3 activity in rat vascular following Pb exposure. (B) Caspase-3 activity in rat cardiac tissue following Pb exposure. The rats were treated with 1% Pb acetate for 12 and 40 days. n = 6. Data are the means ± SD. *p < 0.05 compared with the control group. The relative activities of caspase-3 shown are calculated from the average of experiment. Each value was expressed as the ratio of caspase-3 activation level to the control level, and the value of the control was set to 1.

References

    1. Eum KD, Weisskopf MG, Nie LH, Hu H, Korrick SA. Cumulative Lead Exposure and Age at Menopause in the Nurses' Health Study Cohort. Environ Health Perspect. 2014; 122(3):229–234. 10.1289/ehp.1206399 - DOI - PMC - PubMed
    1. Huang PC, Su PH, Chen HY, Huang HB, Tsai JL, Huang HI, et al. Childhood blood lead levels and intellectual development after ban of leaded gasoline in Taiwan: a 9-year prospective study. Environ Int. 2012; 40:88–96. 10.1016/j.envint.2011.10.011 - DOI - PubMed
    1. Rossi-George A, Virgolini MB, Weston D, Thiruchelvam M, Cory-Slechta DA. Interactions of lifetime lead exposure and stress: behavioral, neurochemical and HPA axis effects. Neurotoxicology. 2011; 32(1):83–99. 10.1016/j.neuro.2010.09.004 - DOI - PMC - PubMed
    1. Kasten-Jolly J, Heo Y, Lawrence DA. Central nervous system cytokine gene expression: modulation by lead. J Biochem Mol Toxicol. 2011; 25(1):41–54. 10.1002/jbt.20358 - DOI - PMC - PubMed
    1. Ethier AA, Muckle G, Bastien C, Dewailly É, Ayotte P, Arfken C, et al. Effects of environmental contaminant exposure on visual brain development: a prospective electrophysiological study in school-aged children. Neurotoxicology. 2012; 33(5):1075–85. 10.1016/j.neuro.2012.05.010 - DOI - PubMed

MeSH terms