. 2015 Jul 15;137(27):8783-94.
doi: 10.1021/jacs.5b04136. Epub 2015 Jul 1.

Two-Electron Reduction versus One-Electron Oxidation of the Type 3 Pair in the Multicopper Oxidases

Affiliations

Two-Electron Reduction versus One-Electron Oxidation of the Type 3 Pair in the Multicopper Oxidases

Christian H Kjaergaard et al. J Am Chem Soc. .

Abstract

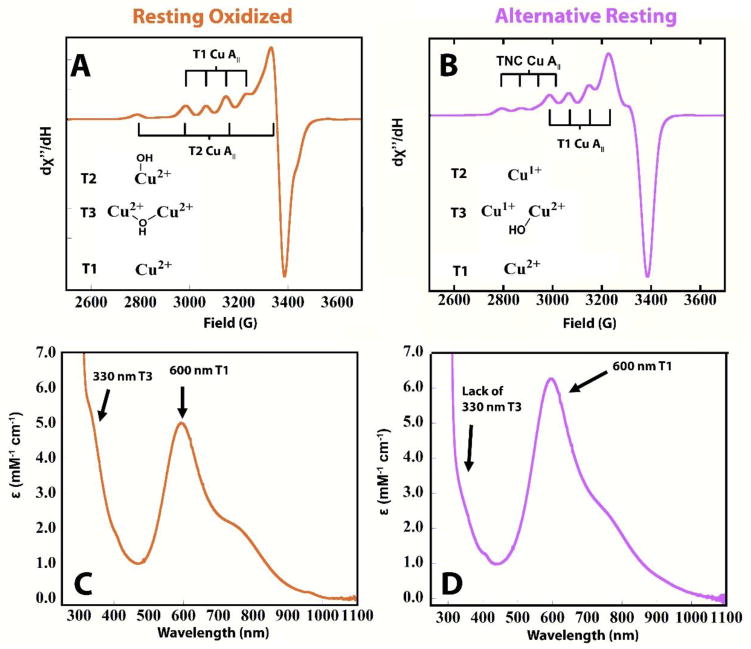
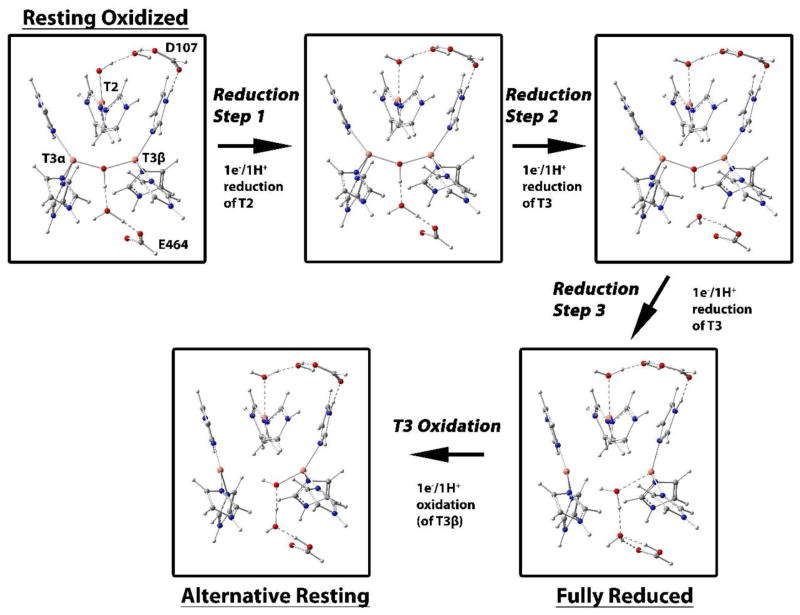
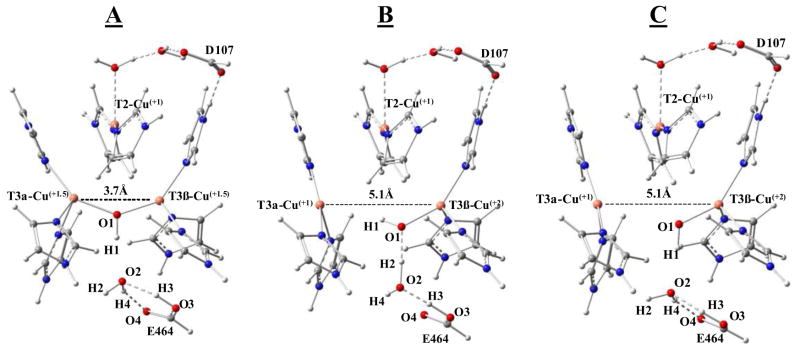
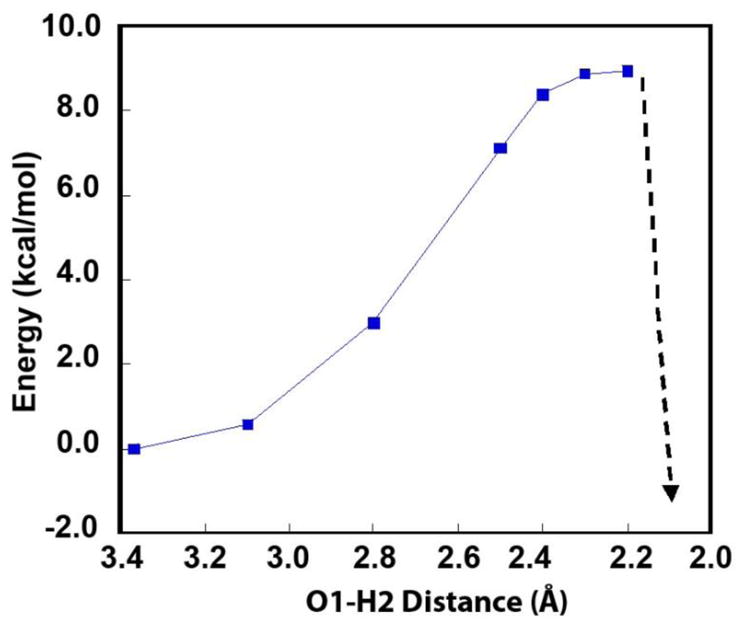
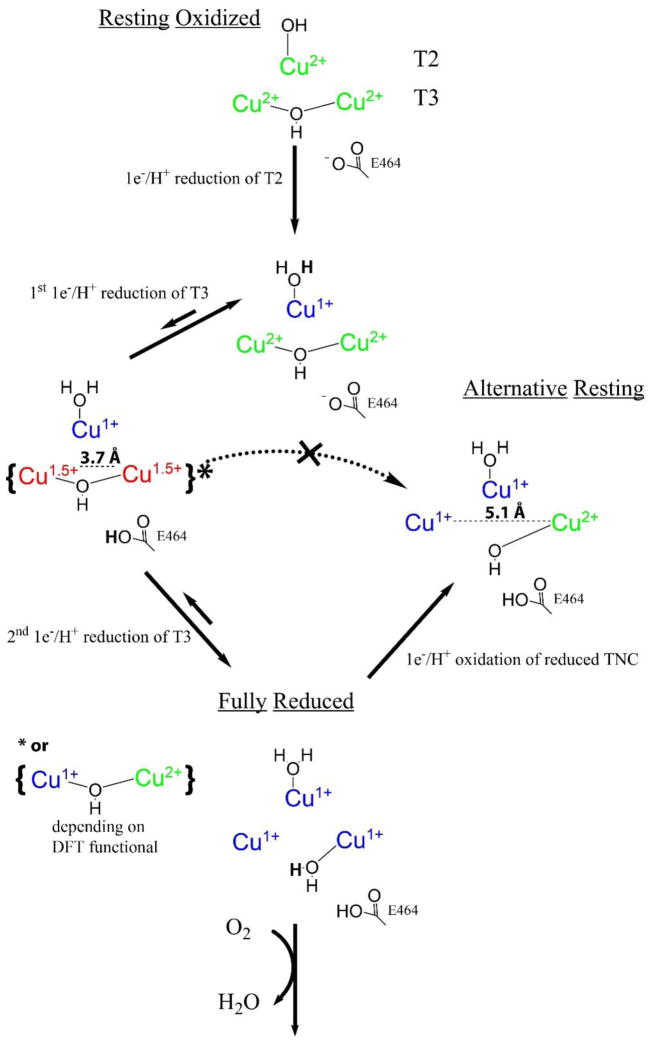
Multicopper oxidases (MCOs) utilize an electron shuttling Type 1 Cu (T1) site in conjunction with a mononuclear Type 2 (T2) and a binuclear Type 3 (T3) site, arranged in a trinuclear copper cluster (TNC), to reduce O2 to H2O. Reduction of O2 occurs with limited overpotential indicating that all the coppers in the active site can be reduced via high-potential electron donors. Two forms of the resting enzyme have been observed in MCOs: the alternative resting form (AR), where only one of the three TNC Cu's is oxidized, and the resting oxidized form (RO), where all three TNC Cu's are oxidized. In contrast to the AR form, we show that in the RO form of a high-potential MCO, the binuclear T3 Cu(II) site can be reduced via the 700 mV T1 Cu. Systematic spectroscopic evaluation reveals that this proceeds by a two-electron process, where delivery of the first electron, forming a high energy, metastable half reduced T3 state, is followed by the rapid delivery of a second energetically favorable electron to fully reduce the T3 site. Alternatively, when this fully reduced binuclear T3 site is oxidized via the T1 Cu, a different thermodynamically favored half oxidized T3 form, i.e., the AR site, is generated. This behavior is evaluated by DFT calculations, which reveal that the protein backbone plays a significant role in controlling the environment of the active site coppers. This allows for the formation of the metastable, half reduced state and thus the complete reductive activation of the enzyme for catalysis.


Figures

Figure 1
Figure 1
EPR and UVvis absorption spectra of RO (A, C), and AR (B, D) in P. anserina laccase.
Figure 2
Figure 2
EPR of AR in PaL (black), AR with three electron equivalents of ABTS (blue), and AR after subsequent exposure to O2 (red). The intense radical signals at ~3400–3500 gauss originate from oxidized ABTS. 0.1 M sodium phosphate buffer with 0.1 M NaCl, pH=6.
Figure 3
Figure 3
EPR of RO in PaL (black), RO with five electron equivalents of ABTS (blue), and RO after subsequent exposure to O2 (red). The intense radical signals at ~3400–3500 gauss originate from oxidized ABTS. 0.1 M sodium phosphate buffer with 0.1 M NaCl, pH=6.
Figure 4
Figure 4
Reductive titration of RO. UVvis spectra of RO obtained after addition of 0, 0.9, 1.8, 2.7, and 3.6 electron equivalents of dithionite (black to light blue). Arrows indicate decrease in intensity of the T1 and T3 Cu(II)’s, respectively. 0.1 M potassium phosphate buffer with 0.1 M KBr, pH=7.
Figure 5
Figure 5
EPR spectra of T1-reduced AR. (A) Experimental (black) and simulated (green) X-band EPR spectra. (B) Experimental (black) and simulated (green) Q-band EPR spectra.
Figure 6
Figure 6
Absorption spectra of T1-reduced AR. Room temperature (A) UVvis absorption, (B) CD, and (C) low temperature (4 K) MCD experimental spectra (red), overall simultaneous fit (green), and individually resolved bands from fit (black) with transition numbers indicated. (*) represents heme contaminant.
Figure 7
Figure 7
EPR of reoxidation of fully-reduced-PaL with AR-PaL. (A) Time points shown are at 2 min, 18.5 h, 64 h, and 136 h. (B) Parallel region of (A). (C) Perpendicular region of (A). Arrows indicate direction of change in the spectra over time.
Figure 8
Figure 8
Reoxidation of fully-reduced RvL by addition of ferricyanide. (A) EPR spectra of RvL before reduction (black), after reduction with dithionite (blue), and after subsequent addition of ferricyanide (red). (B) UVvis spectra of RvL before reduction (black), after reduction with dithionite (blue), and after subsequent addition of ferricyanide (red).
Figure 9
Figure 9
Exposure of ferricyanide-treated-RvL to O2. (A) Difference UVvis spectrum of ferricyanide-treated-RvL before and 30s after exposure to O2 (red), and spectrum of PI in RvL derivative (dashed) from ref . (B) CD spectra of ferricyanide-treated-RvL exposed to O2 after 25, 55, 85, 145, and 1200mins. Arrow indicates the decay of the PI-specific 365nm band. Note that ferricyanide was removed before acquisition of CD.
Figure 10
Figure 10
Reduction of the TNC in RO to the fully reduced TNC, and reoxidation of the fully reduced TNC to AR. Enlarged images are given in Figure S9.
Figure 11
Figure 11
Optimized structures of the one-electron reduced T3 site in RO reduction (A), the one-electron oxidized T3 site from the fully reduced TNC (B), and the one-electron reduced T3 site generated in the linear transit calculation by increasing the T3α to T3β Cu-Cu distance (C).
Figure 12
Figure 12
Energies of the linear transit calculation of decreasing the O1-H2 distance in species A in Figure 10A from 3.37Å to 2.1 Å.
Scheme 1
Scheme 1
Reduction and oxidation behavior of high potential MCOs.

References

    1. Wood PM. Biochem J. 1988;253:287–289. - PMC - PubMed
    1. Mano N, Kim HH, Heller A. J Phys Chem B. 2002;106:8842–8848.
    1. Thorseth MA, Tornow CE, Tse ECM, Gewirth AA. Coord Chem Rev. 2013;257:130–139.
    1. Solomon EI, Sundaram UM, Machonkin TE. Chem Rev. 1996;96:2563–2606. - PubMed
    1. Piontek K, Antorini M, Choinowski T. J Biol Chem. 2002;277:37663–37669. - PubMed

Publication types