. 2015 Jun 15:5:9867.
doi: 10.1038/srep09867.

Differential signaling mechanism for HIV-1 Nef-mediated production of IL-6 and IL-8 in human astrocytes

Affiliations

Differential signaling mechanism for HIV-1 Nef-mediated production of IL-6 and IL-8 in human astrocytes

Xun Liu et al. Sci Rep. .

Abstract

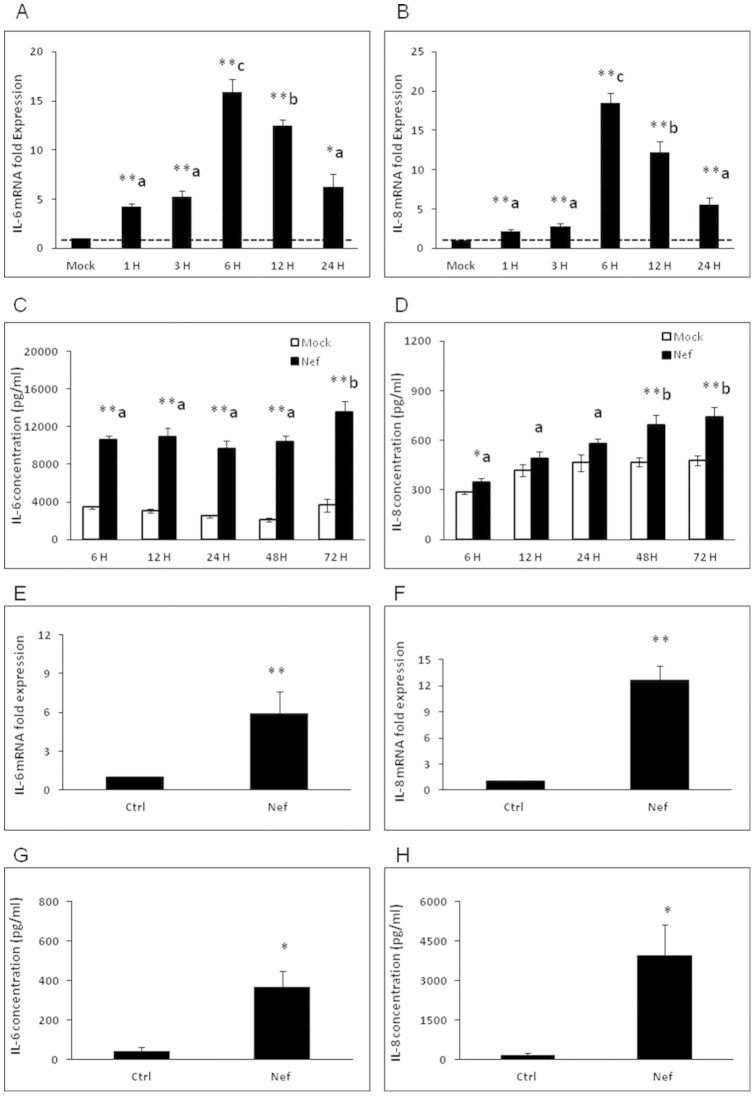
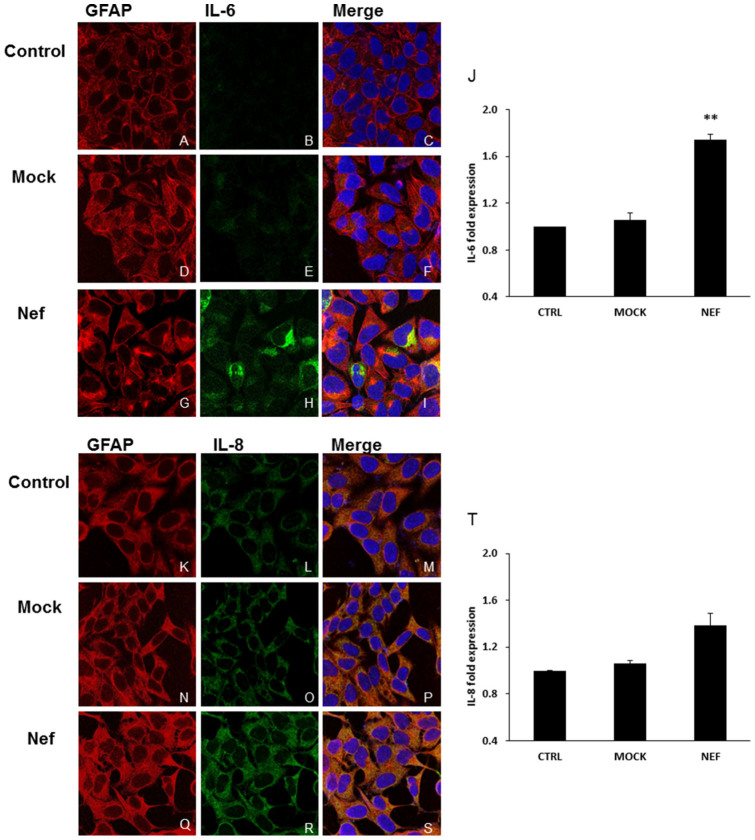
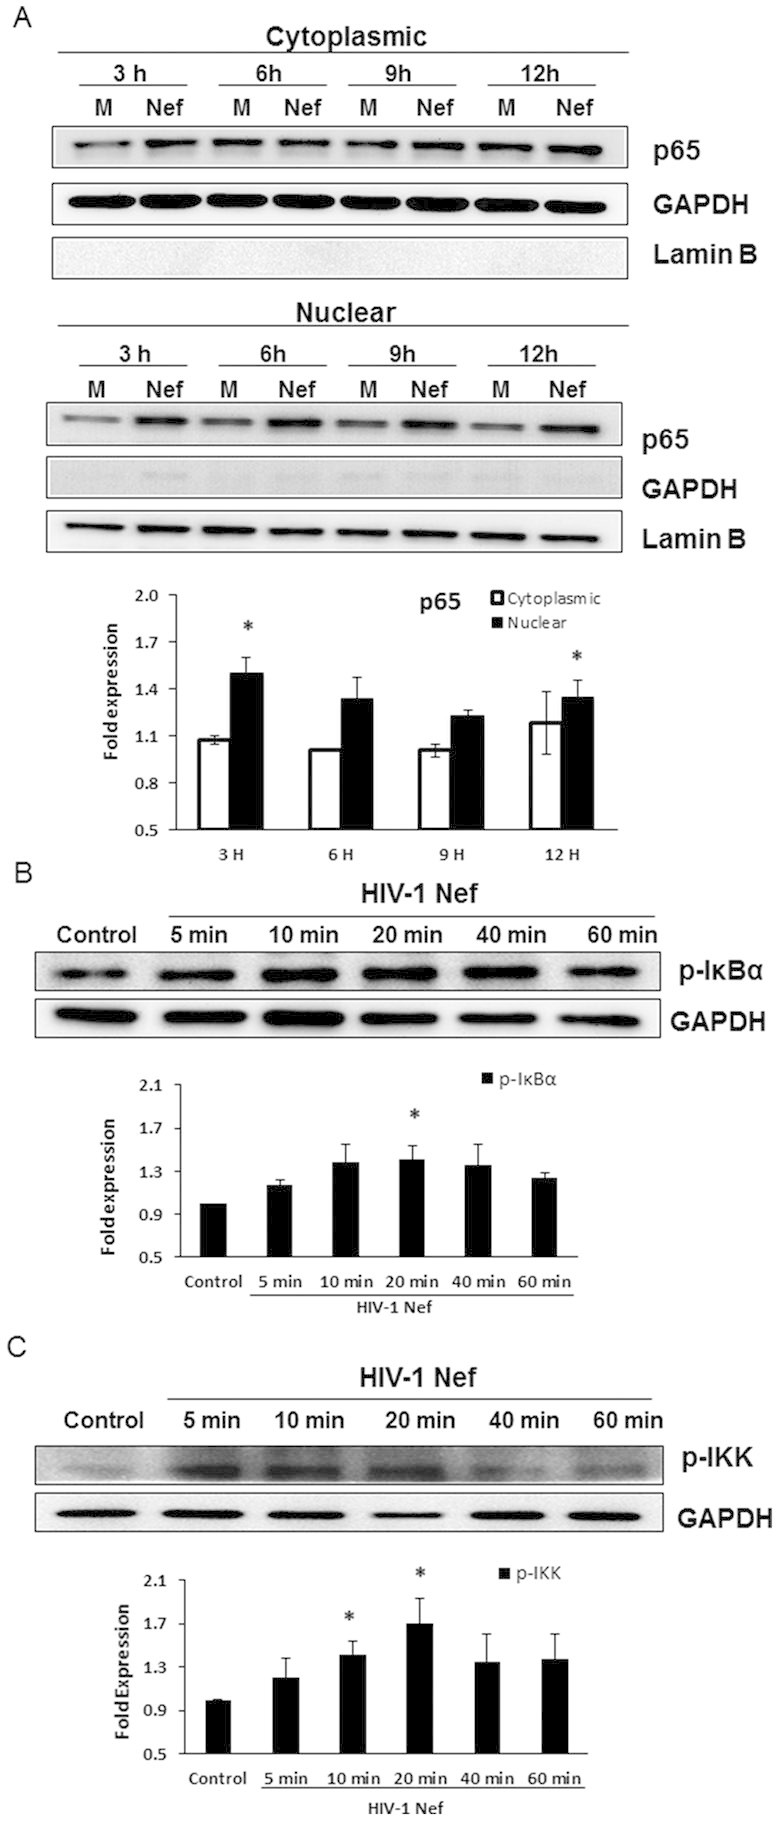
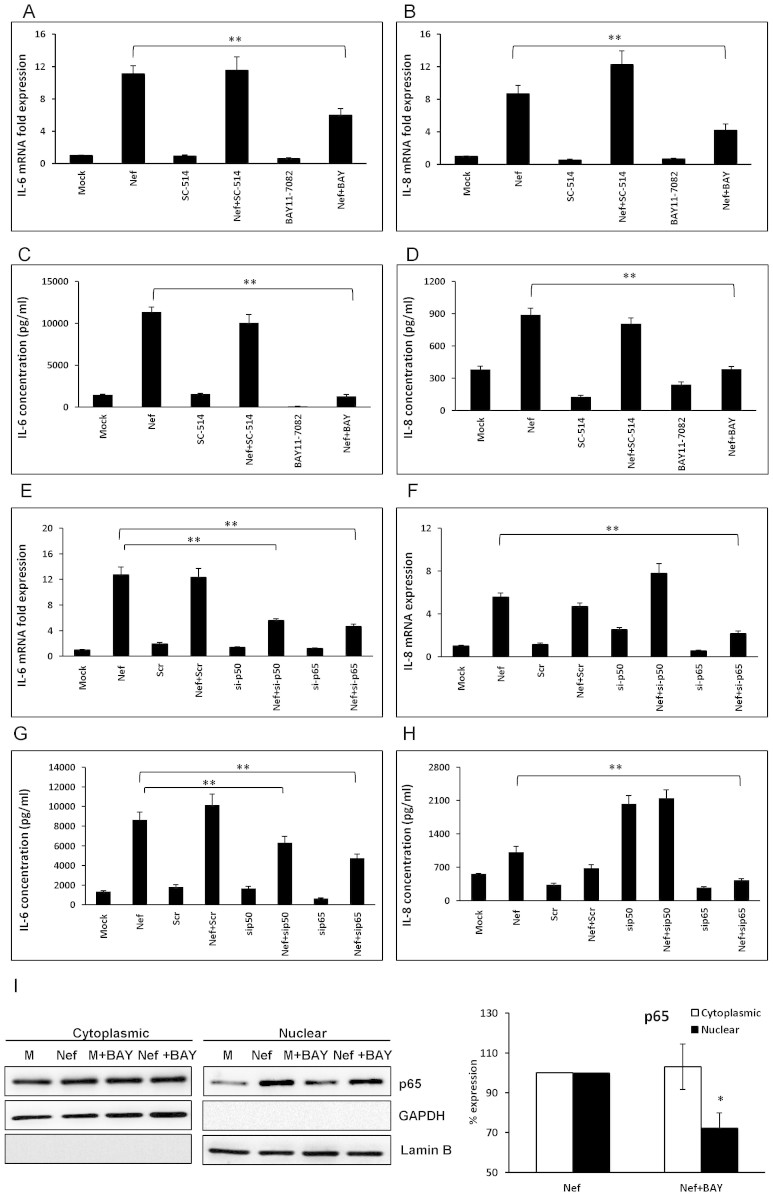
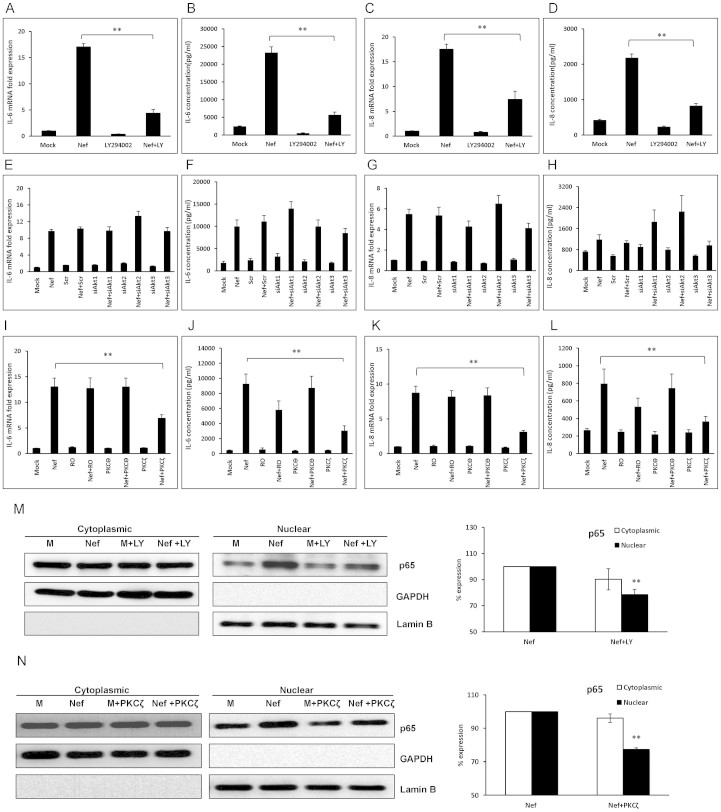
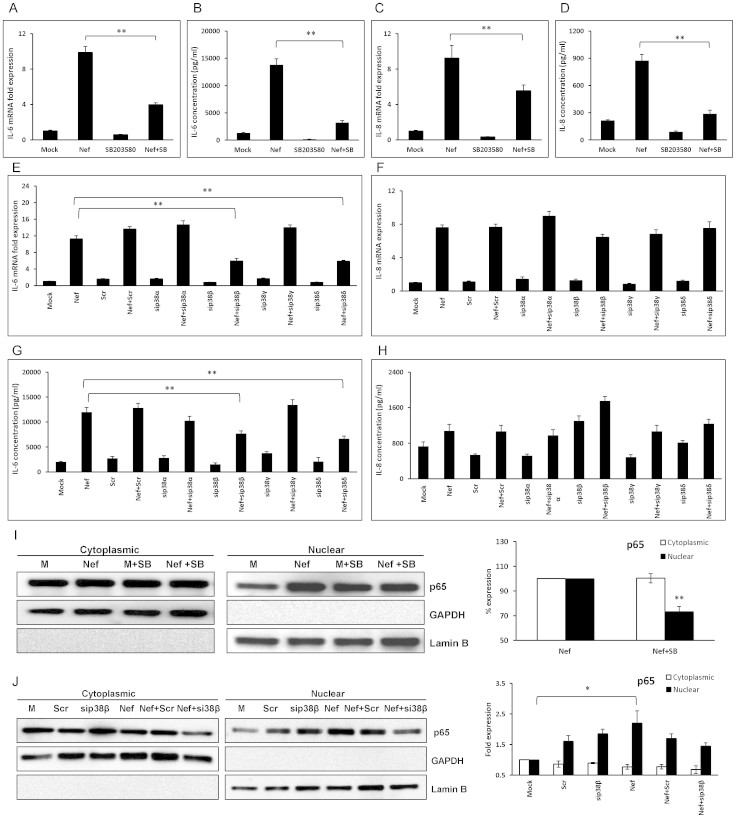
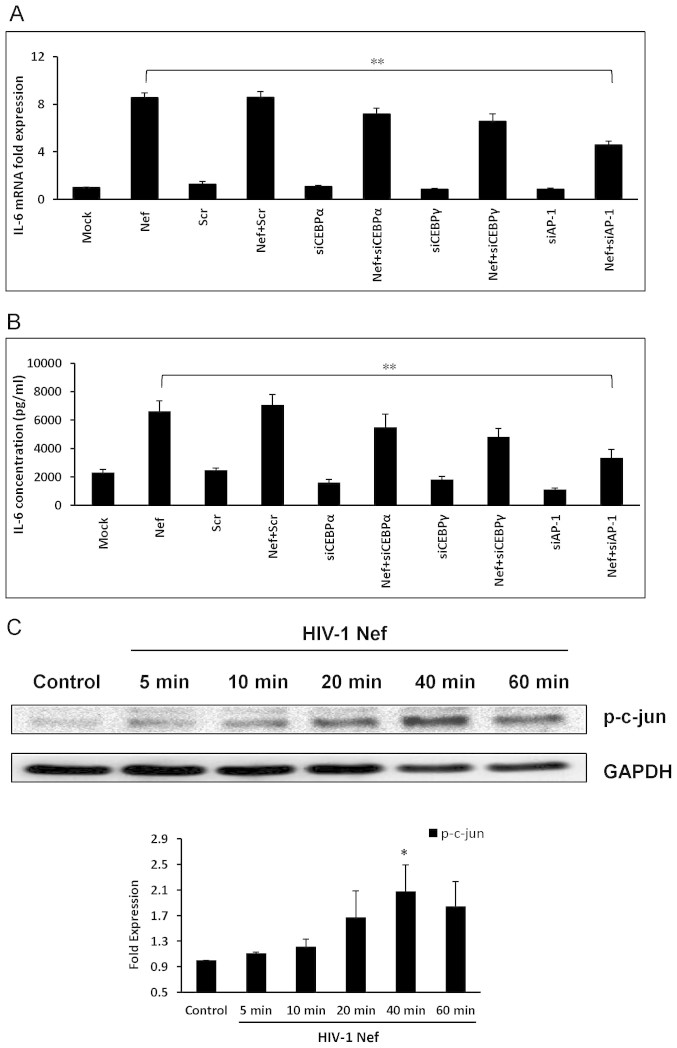
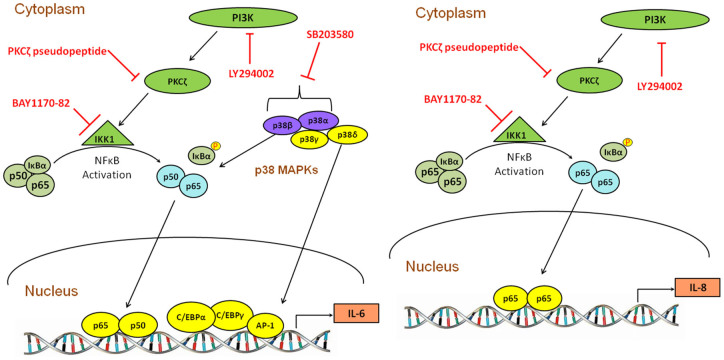
Variety of HIV-1 viral proteins including HIV-1 Nef are known to activate astrocytes and microglia in the brain and cause the release of pro-inflammatory cytokines, which is thought to be one of the mechanisms leading to HIV-1- mediated neurotoxicity. IL-6 and IL-8 have been found in the CSF of patients with HIV-1 associated dementia (HAD), suggesting that they might play important roles in HIV-1 neuropathology. In the present study we examined the effects of HIV-1 Nef on IL-6 and IL-8 induction in astrocytes. The results demonstrate that both IL-6 and IL-8 are significantly induced in HIV-1 Nef-transfected SVGA astrocytes and HIV-1 Nef-treated primary fetal astrocytes. We also determined the molecular mechanisms responsible for the HIV-1 Nef-induced increased IL-6 and IL-8 by using chemical inhibitors and siRNAs against PI3K/Akt/PKC, p38 MAPK, NF-κB, CEBP and AP-1. Our results clearly demonstrate that the PI3K/PKC, p38 MAPK, NF-κB and AP-1 pathways are involved in HIV-1 Nef-induced IL-6 production in astrocytes, while PI3K/PKC and NF-κB pathways are involved in HIV-1 Nef-induced IL-8 production. These results offer new potential targets to develop therapeutic strategy for treatment of HIV-1 associated neurological disorders, prevalent in > 40% of individuals infected with HIV-1.


Conflict of interest statement

The authors declare that they have no competing financial interests.

Figures

Figure 1
Figure 1. HIV-1 Nef induces IL-6 and IL-8 in SVGA astrocytes and human primary fetal astrocytes.
7 × 10⁵ SVGA astrocytes were seeded in a 6-well plate and were transfected with a plasmid encoding HIV-1 Nef for 5 h using Lipofectamine 2000™. The cells were harvested at the indicated times and RNA was isolated and the expression levels of IL-6 and IL-8 mRNA were determined by real time RT-PCR. Data in figures show fold-change relative to the mock-transfected wells at each time point (A–B). IL-6 and IL-8 concentrations released in the supernatants were measured at times indicated in the figure by multiplex cytokine assay (C–D). Each of the bars represents the mean ± SE of three independent experiments which were performed in triplicate. 1 × 10⁶ SVGA astrocytes were seeded in 12-well plates and were treated with HIV-1 Nef. The cells were harvested at 1 h ~ 6 h for total RNA isolation and the expression levels of IL-6 and IL-8 mRNA were determined by real time RT-PCR. Data in figures show the mean of peak expression of IL-6 and IL-8 depicted by fold-change relative to the untreated wells for all 6 donors (E–F). In separate experiments, IL-6 and IL-8 concentrations released in the supernatants were measured in 2 of 6 donors at 24 h by multiplex cytokine assay and data in figures show the mean of IL-6 and IL-8 concentrations (G–H). Each of the bars represents mean ± SE of individual donors. Statistical analyses were performed using one-way ANOVA. * represents p-value ≤ 0.05 and ** represents p-value ≤ 0.01. An LSD post-hoc test was performed to compare cytokine expression levels at different time points. Treatments that are significantly different from each other (i.e. p ≤ 0.05) are labeled with different letters.
Figure 2
Figure 2. Confocal microscopy of IL-6 and IL-8 induced by HIV-1 Nef in astrocytes.
7 × 10⁵ SVGA astrocytes were seeded on a cover slip in 6-well plates and were either mock-transfected (D–F and N–P) or transfected with a plasmid encoding HIV-1 Nef (G–I and Q–S) for 5 h using Lipofectamine 2000™. Untreated controls (A–C and K–M) were used to visualize basal expression of IL-6 and IL-8 in astrocytes, respectively. 6 h later, cells were incubated with primary antibodies against CCL5 and GFAP and appropriate secondary antibodies labeled with Alexafluor 488 (IL6/IL-8) and Alexafluor 555 (GFAP). As illustrated in the figure, cells were stained for DAPI (blue); IL-6/IL-8 (green) and GFAP (red) and the images were captured using a Leica TCS SP5 II fluorescent microscope with 40× zoom oil emersion lens. The fold expression of IL-6 and IL-8 was calculated relative to GFAP and normalized with controls (J and T). Image analysis was performed using ImageJ software. Each of the bars represents mean ± SE of 3 different fields. Statistical analysis was performed using one-way ANOVA with an LSD post-hoc test in which * represents p-value ≤ 0.05 and ** represents p-value ≤ 0.01.
Figure 3
Figure 3. HIV-1 Nef induces NF-κB p65 translocation as well as the phosphorylation of IκBα and IKK.
7 × 10⁵ SVGA astrocytes were seeded in 6-well plates and were transfected with a plasmid encoding HIV-1 Nef using Lipofectamine 2000™. The transfection start time was considered time 0. The cells were harvested at the indicated times for isolation of cytoplasmic and nuclear proteins. The expression levels of p65 were determined in the cytosol and nucleus by western blotting. The figure shows one set of data that is representative of 3 independent experiments. Levels of p65 were quantified by spot densitometry and are presented as mean ± SE of 3 independent experiments. The fold expression of p65 was calculated relative to that of the mock-transfected wells at each individual time point (A). GAPDH was used as a loading control for cytoplasmic extracts and Lamin B was used as a loading control for nuclear extracts. In separate experiments, astrocytes were seeded in 6-well plates and were treated with recombinant HIV-1 Nef at the concentration of 20 nM. The cells were harvested at the indicated times for preparation of whole cell lysates followed by western blotting for determination of p-IκBα and p-IKK levels. The figure shows one set of data that is representative of 3 independent experiments. Levels of phosphorylated-proteins were quantified by spot densitometry and are presented as mean ± SE fold vs. control of 3 independent experiments (B–C). GAPDH was used as a loading control. Statistical analysis was performed using one-way ANOVA with an LSD post-hoc test in which * represents p-value ≤ 0.05 and ** represents p-value ≤ 0.01.
Figure 4
Figure 4. HIV-1 Nef induces IL-6 and IL-8 expression through the NF-κB pathway.
SVGA cells were treated with 20 μM SC-514 or 10 μM Bay11-7082 prior to the transfection. IL-6 and IL-8 mRNA (A–B) as well as protein (C–D) levels were determined at 6 and 48 h post transfection, respectively. For knockdown of p50 and p65, the cells were transfected with the siRNA followed by transfection of nef-encoding plasmid as described in Materials and Methods. The expression levels of IL-6 and IL-8 mRNA and protein were determined at 6 h and 48 h post-transfection by real-time RT-PCR (E–F) and multiplex cytokine assay (G–H), respectively. The values presented for mRNA are relative to the mock-transfected controls. In separate experiments, SVGA cells were seeded in 6-well plates and treated with 10 μM BAY11-7082 1 h prior to transfection with a plasmid encoding HIV-1 Nef. The cells were harvested at 3 h for isolation of cytoplasmic and nuclear proteins followed by western blotting for determination of p65 expression levels in the cytosol and nucleus. The figure shows one set of data that is representative of 3 independent experiments. The percentage expression of p65 is expressed relative to the nef-transfected wells at 3 h which was considered 100% (I). GAPDH was used as a loading control for cytoplasmic extracts and Lamin B was used as a loading control for nuclear extracts. Each of the bars represents mean ± SE of three independent experiments in triplicates. Statistical analysis was performed using one way ANOVA with the LSD post-hoc test in which * represents p-value ≤ 0.05 and ** represents p-value ≤ 0.01.
Figure 5
Figure 5. The PI3K-PKC pathway is involved in Nef-mediated IL-6 and IL-8 increases.
SVGA astrocytes were pretreated with 10 μM of specific PI3K inhibitor LY294002 (A–D) or transfected with siRNA against Akt1/2/3 (E–H) prior to transfection with a nef-encoding plasmid. The expression levels of IL-6 and IL-8 mRNA and protein were determined at 6 h and 48 h post-transfection by real-time RT-PCR (A, C, E and G) and multiplex cytokine assay (B, D, F and H), respectively. In separate experiments, the cells were pretreated with a chemical inhibitor for PKCδ (Rottlerin) (3 μM), a specific pseudopeptide inhibitor for PKCθ (5 μM) or a specific pseudopeptide inhibitor for PKCζ (5 μM), prior to transfection with a nef-encoding plasmid. The expression levels of IL-6 and IL-8 were determined at 6 h and 48 h post-transfection by real-time RT-PCR (I and K) and multiplex cytokine assay (J and L), respectively. The values represented for mRNA are relative to the mock-transfected controls. In order to determine whether PKC mediates p65 translocation 7 × 10⁵ SVGA astrocytes were seeded in 6-well plates and pre-treated with LY294002 (10 μM) or pseudopeptide inhibitor for PKCζ (5 μM) 1 h prior to transfection with a plasmid encoding HIV-1 Nef (M–N). The cells were harvested at 3 h for isolation of cytoplasmic and nuclear proteins followed by western blotting for determination of p65 expression levels in the cytosol and nucleus. The figure shows one set of data that is representative of 3 independent experiments. The percentage expression of p65 was calculated relative to the nef-transfected wells at 3 h which was considered 100%. GAPDH was used as a loading control for cytoplasmic extracts and Lamin B was used as a loading control for nuclear extracts. Each of the bars represents mean ± SE of 3 independent experiments which were performed in triplicate. Statistical analysis was performed using one-way ANOVA with an LSD post-hoc test in which * represents p-value ≤ 0.05 and ** represents p-value ≤ 0.01.
Figure 6
Figure 6. Involvement of p38 MAPK pathway in Nef-mediated IL-6 and IL-8 increase.
SVGA astrocytes were pretreated with 10 μM of specific p38α and p38β inhibitor SB203580 (A–D) or transfected with siRNA against p38 isoforms (E–H) prior to transfection with nef-encoding plasmid. The expression levels of IL-6 and IL-8 mRNA and protein were determined at 6 h and 48 h post-transfection by real-time RT-PCR (A, C, E and F) and multiplex cytokine assay (B, D, G and H), respectively. In separate experiments, 7 × 10⁵ SVGA astrocytes were seeded in 6-well plates and pre-treated with SB203580 (10 μM) or transfected with siRNA against p38β prior to transfection with a plasmid encoding HIV-1 Nef (I–J). The cells were harvested at 3 h for isolation of cytoplasmic and nuclear proteins followed by western blotting for determination of p65 expression levels in the cytosol and nucleus. The figure shows one set of data that is representative of 3 independent experiments. The percentage expression of p65 was calculated relative to the nef-transfected wells at 3 h which was considered 100%. GAPDH was used as a loading control for cytoplasmic extracts and Lamin B was used as a loading control for nuclear extracts. The values represented for mRNA are relative to the mock-transfected controls. Each of the bars represents mean ± SE of three (A–D and I–J) or five (E–H) independent experiments in triplicates. Statistical analysis was performed using one-way ANOVA with an LSD post-hoc test t in which * represents p-value ≤ 0.05 and ** represents p-value ≤ 0.01.
Figure 7
Figure 7. Involvement of transcriptional factors C/EBP and AP-1 in Nef-mediated increase of IL-6 expression.
For knockdown of C/EBPα, C/EBPγ and AP-1, the cells were transfected with the siRNA followed by transfection of nef-encoding plasmid as described in Materials and Methods. The expression levels of IL-6 and IL-8 mRNA and protein were determined at 6 h and 48 h post-transfection by real-time RT-PCR (A) and multiplex cytokine assay (B), respectively. The values represented for mRNA are relative to the mock-transfected controls. Each of the bars represents mean ± SE of three independent experiments which were performed in triplicate. In separate experiments, 7 × 10⁵ SVGA astrocytes were seeded in 6-well plates and were treated with recombinant HIV-1 Nef at a concentration of 20 nM. The cells were harvested at the indicated times for preparation of whole cell lysates following by western blotting for determination of p-c-jun levels. The figure shows one set of data that is representative of 3 independent experiments. Levels of p-c-jun were quantified by spot densitometry and normalized to GAPDH. Levels of p-c-jun are presented as mean ± SE relative to control and represent data obtained from 3 independent experiments (C). Statistical analysis was performed using one-way ANOVA with an LSD post-hoc test t in which * represents p-value ≤ 0.05 and ** represents p-value ≤ 0.01.
Figure 8
Figure 8. Schematic of the signaling pathways involved in IL-6 and IL-8 up-regulation caused by HIV-1 Nef in astrocytes: HIV-1 Nef activates IL-6 and IL-8 expression utilizing different pathways.
The molecules whose involvement were determined using inhibitors were depicted in green color, and the molecules whose involvement were determined using siRNAs were depicted in yellow color, while purple color indicated that both inhibitors and siRNAs were used.

References

    1. Antiretroviral Therapy Cohort C. Life expectancy of individuals on combination antiretroviral therapy in high-income countries: a collaborative analysis of 14 cohort studies. Lancet 372, 293–299 (2008). - PMC - PubMed
    1. McArthur J. C. HIV dementia: an evolving disease. J Neuroimmunol 157, 3–10 (2004). - PubMed
    1. Ances B. M. & Ellis R. J. Dementia and neurocognitive disorders due to HIV-1 infection. Semin Neurol 27, 86–92 (2007). - PubMed
    1. Nath A. Human immunodeficiency virus (HIV) proteins in neuropathogenesis of HIV dementia. J Infect Dis 186 Suppl 2, S193–198 (2002). - PubMed
    1. Norenberg M. D. Astrocyte responses to CNS injury. J Neuropathol Exp Neurol 53, 213–220 (1994). - PubMed

Publication types

MeSH terms

LinkOut - more resources