. 2015 Jun 15;11(6):e1004305.
doi: 10.1371/journal.pcbi.1004305. eCollection 2015 Jun.

The Sense of Confidence during Probabilistic Learning: A Normative Account

Affiliations

The Sense of Confidence during Probabilistic Learning: A Normative Account

Florent Meyniel et al. PLoS Comput Biol. .

Abstract

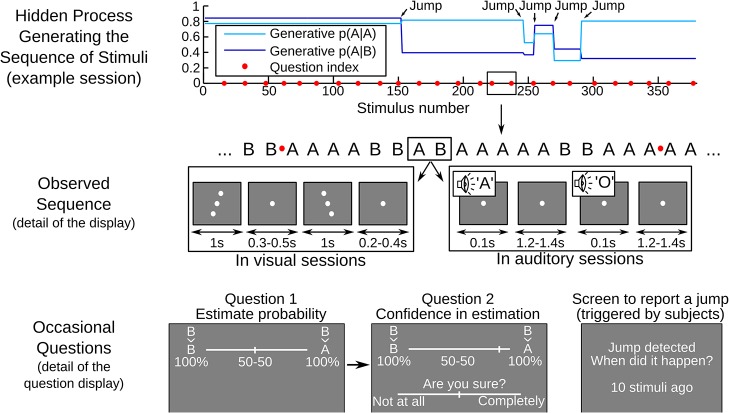
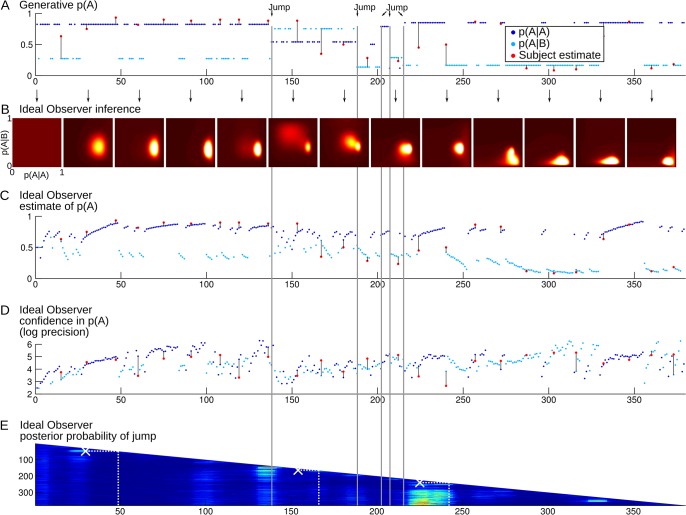
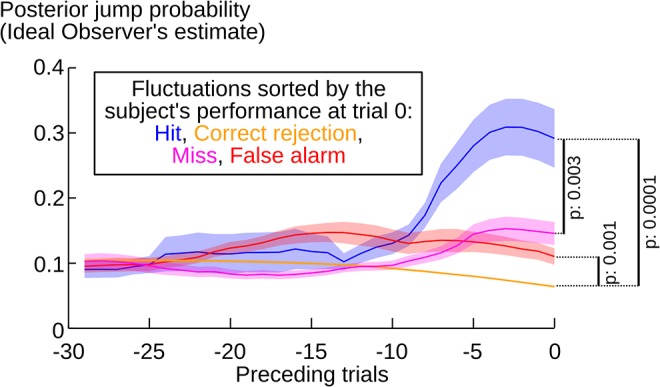
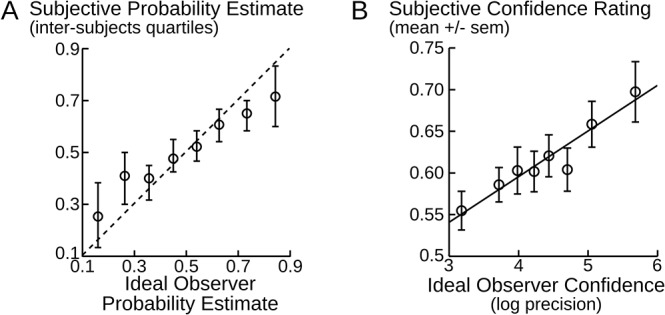
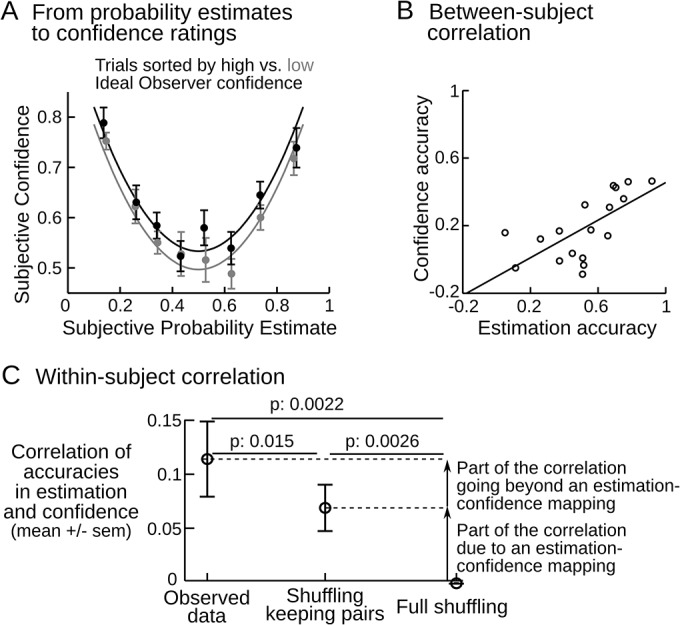
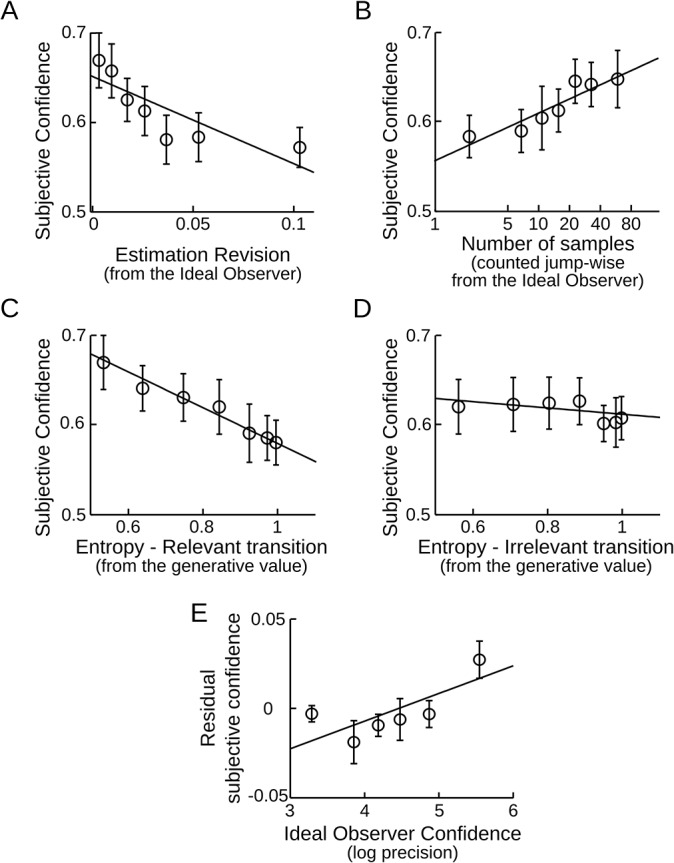
Learning in a stochastic environment consists of estimating a model from a limited amount of noisy data, and is therefore inherently uncertain. However, many classical models reduce the learning process to the updating of parameter estimates and neglect the fact that learning is also frequently accompanied by a variable "feeling of knowing" or confidence. The characteristics and the origin of these subjective confidence estimates thus remain largely unknown. Here we investigate whether, during learning, humans not only infer a model of their environment, but also derive an accurate sense of confidence from their inferences. In our experiment, humans estimated the transition probabilities between two visual or auditory stimuli in a changing environment, and reported their mean estimate and their confidence in this report. To formalize the link between both kinds of estimate and assess their accuracy in comparison to a normative reference, we derive the optimal inference strategy for our task. Our results indicate that subjects accurately track the likelihood that their inferences are correct. Learning and estimating confidence in what has been learned appear to be two intimately related abilities, suggesting that they arise from a single inference process. We show that human performance matches several properties of the optimal probabilistic inference. In particular, subjective confidence is impacted by environmental uncertainty, both at the first level (uncertainty in stimulus occurrence given the inferred stochastic characteristics) and at the second level (uncertainty due to unexpected changes in these stochastic characteristics). Confidence also increases appropriately with the number of observations within stable periods. Our results support the idea that humans possess a quantitative sense of confidence in their inferences about abstract non-sensory parameters of the environment. This ability cannot be reduced to simple heuristics, it seems instead a core property of the learning process.


Conflict of interest statement

The authors have declared that no competing interests exist.

Figures

Fig 1
Fig 1. Behavioral task for the joint assessment of probability estimates and confidence.
Subjects were presented with series of auditory or visual stimuli (denoted A and B) and were occasionally interrupted by questions asking for their estimate of transition probability (e.g. B→A) and their confidence in this judgment. The top graph illustrates the characteristics of the hidden process generating the sequence of stimuli in an example session: transition probabilities changed 5 times at random 'Jump' points, delimiting 6 chunks of variable length. The middle section shows a portion of the generated sequence. The actual stimuli are illustrated by gray screen-shots: in different sessions, stimuli were either visual (a line of dots tilted clockwise or anti-clockwise) or auditory (vowels 'A' or 'O' played through a loudspeaker). The sequence of stimuli was interrupted every 15 ± 3 stimuli (see red dots). At this moment, the previous stimulus (here B) was displayed and subjects indicated with a slider their estimate of the probability for the next stimulus to be A or B. In the actual display, A and B were replaced by the corresponding visual symbols or vowels. Once subjects had validated their probability estimate, they were asked to rate with a slider how confident they were in their probability estimate. Subjects also had to report on-line when they detected jumps: they could stop the sequence at any time by pressing a key to indicate how long ago the jump had supposedly occurred (see the bottom right-hand screen shot). After such reports, the stimulus sequence was resumed without feedback.
Fig 2
Fig 2. Example of the time course of a full session.
(A) Each dot represents a stimulus in the sequence (dark blue = A, light blue = B). The position on the y-axis shows the true generative probability of having the stimulus A at a given trial, which is conditional on the preceding stimulus. The 5 changes in transition probabilities are highlighted in gray. The red dots show the subject's probability estimates that the next stimulus is A (the answer to Question 1 in Fig 1). The black lines facilitate visual comparison between the subject's estimates and the corresponding generative values. (B) Temporal evolution of the distribution of transition probabilities estimated by the Ideal Observer. The distribution is updated at each observation, but it is plotted only every 30 stimuli for illustration purposes. The distribution is two-dimensional: p(A|A) and p(A|B) can be read as marginal distributions along the vertical and horizontal axes. Point estimates and the related confidence levels can be read respectively as the mean and negative log variance. (C) Temporal evolution of Ideal Observer point estimates of the transition probabilities. The transition probabilities estimated by the Ideal Observer sometimes differ substantially from the generative ones, and better account for the subject's estimates, e.g. around stimulus 240. (D) Temporal evolution of the Ideal Observer confidence in the estimated transition probabilities. Confidence levels from the Ideal Observer and the subject cannot be compared directly: subjective reports were made on a qualitative bounded scale (Question 2 in Fig 1) whereas the Ideal Observer confidence in principle is not bounded. For illustration purpose, subjective confidence levels (red dots) were overlaid after adjusting their mean and variance to match those of the Ideal Observer. Several features are noteworthy: drops of confidence levels after suspicion of jumps (e.g. around stimulus 50) and a general trend for confidence to increase with the number of observations within a chunk (e.g. from stimulus 1 to 50). (E) Evolution of the posterior probability that a jump occurred around (±5) each stimulus of the observed sequence, as estimated by the Ideal Observer. Hotter colors denote higher probabilities. This estimation is revised after each new observation. The successive estimations result in the succession of longer and longer rows as more and more stimuli are observed in the sequence. Jumps reported by the subject are overlaid as white crosses. For instance, at stimulus 50, the subject pressed the detection key to report a jump located at stimulus 30. This detection was actually a false alarm with respect to the generative jumps, but the Ideal Observer also estimated that a jump was likely at this moment.
Fig 3
Fig 3. Accuracy of the subjects' jump detections.
Subjects’ jump detections followed the fluctuations in jump likelihood provided by the sequence of stimuli. Each trial was sorted into four categories (hit, miss, correct rejection and false alarm), based on the comparison between the subjective jump detection and the actual position of jumps in the sequence. This sorting was used as a reference (trial 0) to examine the fluctuations in the posterior jump probability estimated by the Ideal Observer over the preceding trials. P-values correspond to two-tailed paired t-tests at trial 0. Solid lines and error shadings correspond to mean ± sem over subjects.
Fig 4
Fig 4. Accuracy of probability estimates and confidence.
(A) Estimated probability that the next stimulus is A plotted against the Ideal Observer estimate. These probability estimates correspond to the transition probabilities p(A|A) or p(A|B), depending on whether the previous stimulus was A or B; both are pooled together. The dotted line corresponds to the identity. Error-bars and dots are the 75%, 50% and 25% percentiles across subjects. (B) Subjective confidence plotted against the Ideal Observer confidence. The steps of the subjective confidence scale were coded such that 0 corresponds to 'Not at all sure' and 1 to 'completely sure'. The Ideal Observer confidence is summarized as the log precision,-log(σ2), with σ² the variance of the estimated transition probability distribution. The fitted line is the average of the linear fits performed at the subject level. In A & B, equally-filled data bins were formed along the horizontal axis because the sequence of stimuli (and hence, estimates that can be inferred) differed across participants. Bins are used only for visualization and not for data analysis.
Fig 5
Fig 5. Evidence that probability estimates and confidence derive from a single process.
(A) Subjective confidence is higher for extreme estimates of transition probabilities. The fitted lines correspond to the average of the quadratic fits performed at the subject level: confidence ~ constant + (probability estimate-0.5)2. Trials were sorted by subjective probability estimates and, within each bin, into high and low Ideal Observer confidence according to a median split. Equally-filled bins were used for data visualization, not for data analysis. (B) The accuracies of probability estimates and confidence ratings are correlated across subjects. The accuracy of probability estimates was computed per subject as the correlation (across trials) of the subject's and the Ideal Observer's estimates. The same logic was used for confidence. One dot corresponds to one subject. (C) The link between probability estimates and confidence ratings goes beyond any mapping. Within each subject, we computed the correlation across trials between accuracies in probability estimates and confidence ratings. The accuracy of probability estimates was computed at the trial level as the distance between the subject's and the Ideal Observer's estimates. The same logic was used for confidence. The observed results are contrasted to two ways of shuffling the data (p-values are from one-tailed t-test, see Methods).
Fig 6
Fig 6. Subjective confidence is updated appropriately on a trial-by-trial basis.
(A) Confidence varies inversely with model revision. The revision of probability estimates corresponds to the shift (absolute difference) in transition probabilities estimated by the Ideal Observer, between two consecutive observations of this transition. (B) Confidence increases when there is more information. Mathematically, confidence should increase linearly with the log-number of samples within stable periods; thus a log-scale is used to plot subjective confidence. The sample count was reset each time the Ideal Observer detects a new jump. (C, D) Confidence is reduced when transitions between stimuli are less predictable. The entropy reflects how unpredictable the next stimulus is based on the generative transition probability: p(A|A) or p(A|B). If the stimulus preceding the question is A, the relevant transition entropy is determined by p(A|A). By contrast p(A|B) is irrelevant. (E) Evidence that subjective confidence estimation goes beyond all of the above factors taken together. A multiple regression including the factors in panels A to D was used to compute the residual subjective confidence, which was then correlated with the Ideal Observer confidence. In all plots error-bars give the inter-subject mean ± s.e.m; the fitted line is the average of the linear fits performed at the subject level. Bins are used only for visualization and not for data analysis.

References

    1. Téglás E, Vul E, Girotto V, Gonzalez M, Tenenbaum JB, Bonatti LL. Pure Reasoning in 12-Month-Old Infants as Probabilistic Inference. Science. 2011;332: 1054–1059. 10.1126/science.1196404 - DOI - PubMed
    1. Bach DR, Dolan RJ. Knowing how much you don’t know: a neural organization of uncertainty estimates. Nat Rev Neurosci. 2012;13: 572–586. 10.1038/nrn3289 - DOI - PubMed
    1. Dolan RJ, Dayan P. Goals and Habits in the Brain. Neuron. 2013;80: 312–325. 10.1016/j.neuron.2013.09.007 - DOI - PMC - PubMed
    1. Behrens TEJ, Woolrich MW, Walton ME, Rushworth MFS. Learning the value of information in an uncertain world. Nat Neurosci. 2007;10: 1214–1221. 10.1038/nn1954 - DOI - PubMed
    1. Nassar MR, Wilson RC, Heasly B, Gold JI. An Approximately Bayesian Delta-Rule Model Explains the Dynamics of Belief Updating in a Changing Environment. J Neurosci. 2010;30: 12366–12378. 10.1523/JNEUROSCI.0822-10.2010 - DOI - PMC - PubMed

Publication types

LinkOut - more resources