. 2015 Jun 15;10(6):e0129735.
doi: 10.1371/journal.pone.0129735. eCollection 2015.

Targeted Lipid Profiling Discovers Plasma Biomarkers of Acute Brain Injury

Affiliations

Targeted Lipid Profiling Discovers Plasma Biomarkers of Acute Brain Injury

Sunil A Sheth et al. PLoS One. .

Abstract

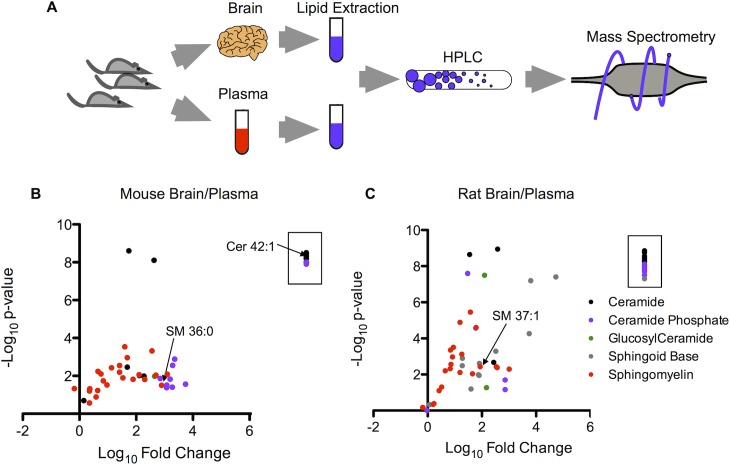
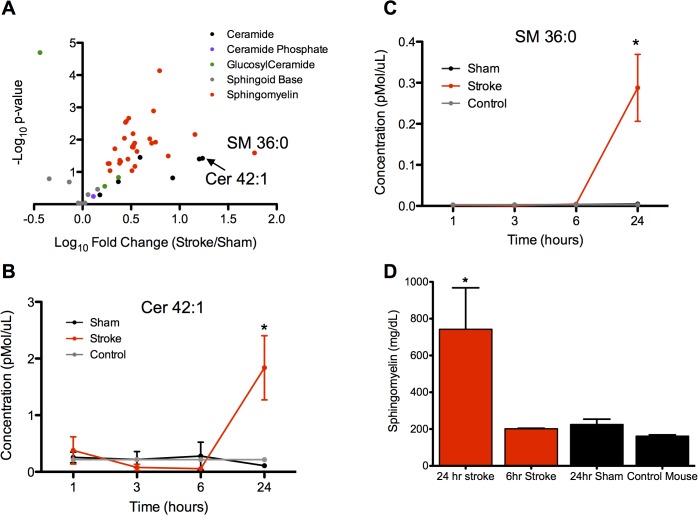
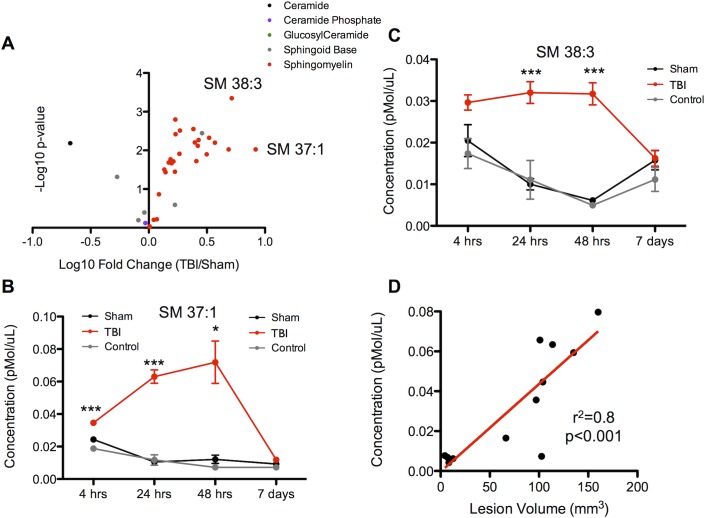
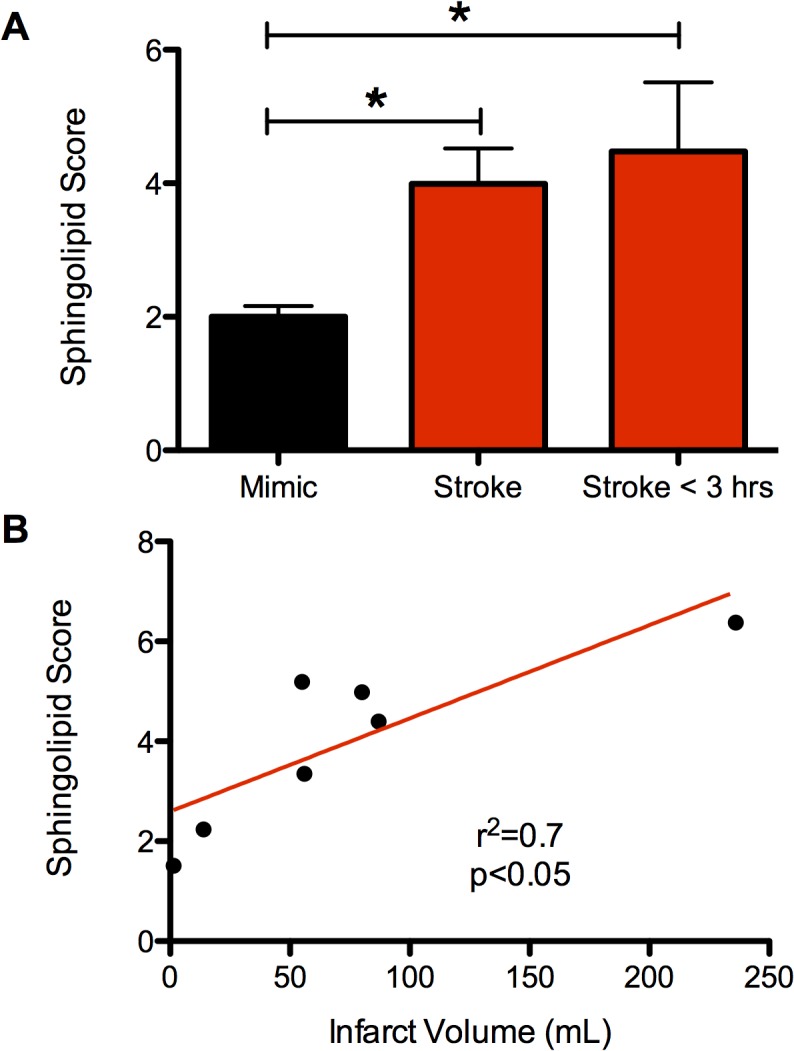
Prior efforts to identify a blood biomarker of brain injury have relied almost exclusively on proteins; however their low levels at early time points and poor correlation with injury severity have been limiting. Lipids, on the other hand, are the most abundant molecules in the brain and readily cross the blood-brain barrier. We previously showed that certain sphingolipid (SL) species are highly specific to the brain. Here we examined the feasibility of using SLs as biomarkers for acute brain injury. A rat model of traumatic brain injury (TBI) and a mouse model of stroke were used to identify candidate SL species though our mass-spectrometry based lipid profiling approach. Plasma samples collected after TBI in the rat showed large increases in many circulating SLs following injury, and larger lesions produced proportionately larger increases. Plasma samples collected 24 hours after stroke in mice similarly revealed a large increase in many SLs. We constructed an SL score (sum of the two SL species showing the largest relative increases in the mouse stroke model) and then evaluated the diagnostic value of this score on a small sample of patients (n = 14) who presented with acute stroke symptoms. Patients with true stroke had significantly higher SL scores than patients found to have non-stroke causes of their symptoms. The SL score correlated with the volume of ischemic brain tissue. These results demonstrate the feasibility of using lipid biomarkers to diagnose brain injury. Future studies will be needed to further characterize the diagnostic utility of this approach and to transition to an assay method applicable to clinical settings.


Conflict of interest statement

Competing Interests: The authors have declared that no competing interests exist.

Figures

Fig 1
Fig 1. Targeted sphingolipid profiling in mouse and rat brain and plasma.
(a) Schematic of the workflow for the isolation of rodent brain and plasma, lipid extraction, and HPLC MS/MS. (b) Volcano plot of the negative log10 of the p-value (Student’s t-test, two-tailed) versus the log10 of the normalized (to protein content) fold difference in concentration in brain over plasma for the 45 sphingolipids identified in mouse brain and plasma. Species within the box (8 total) were found in the brain but not identified in the plasma. n = 3 per sample. (c) Volcano plot of the negative log10 of the p-value (Student’s t-test, two-tailed) versus the log10 of the normalized fold difference in concentration in brain over plasma for the 56 sphingolipids identified in rat brain and plasma. Species within the box (13 total) were found in the brain but not identified in the plasma. n = 3 per sample.
Fig 2
Fig 2. Sphingolipid profiling in middle cerebral artery occlusion in mice.
(a) Volcano plot of the negative log10 of the p-value (Student’s t-test, two-tailed) versus the log10 of the normalized fold change in plasma concentration of stroke over sham animals at the 24 hour time point. Selected top performing sphingolipids are indicated by labels. n = 3 per sample. (b and c) Time course of the two sphingolipids with the greatest fold change. Red line indicates stroke animal, black line indicates sham animal, and grey line indicates control animal without any surgical procedure but with identical blood collection process. Data are shown as mean ± SEM. * indicates p<0.05, Student’s t-test, two-tailed. n = 3 per sample. (d) Total sphingomyelin concentration in plasma as measured by biochemical assay. * indicates p<0.05, one-way ANOVA with Dunnett’s multiple comparisons test.
Fig 3
Fig 3. Sphingolipid profiling in controlled cortical impact in rats.
(a) Volcano plot of the negative log10 of the p-value (Student’s t-test, two-tailed) versus the log10 of the normalized fold change in plasma concentration of TBI over sham animals at the 48 hour time point. Selected top performing sphingolipids are indicated by labels. n = 4 per sample. (b and c) Time course of the two sphingolipids with the greatest fold change. Red line indicates TBI animal, black line indicates sham animal, and grey line indicates control animal without any surgical procedure but with identical blood collection process. Data are shown as mean ± SEM. * indicates p<0.05, *** indicates p<0.001, Student’s t-test. n = 4 per sample. (d) Scatter plot demonstrating the relationship between the plasma concentration of the sphingolipid with the greatest fold change (SM 37:1) at 48 hours versus the volume of injured brain. Linear correlation shown in red (p<0.001, Pearson’s correlation coefficient).
Fig 4
Fig 4. Sphingolipid profiling in patients presenting with acute neurological deficits concerning for stroke.
(a) SL Score from plasma at the time of hospital arrival for patients ultimately diagnosed as stroke and those diagnosed as having a stroke mimic. Three groups were included in the comparison: all patients presenting with stroke, all patients presenting with stroke mimics, and the subset of stroke patients from whom blood draw was within 3 hours of when the symptoms were first observed. Data are shown as mean ± SEM. * indicates p<0.05, Student’s t-test, two-tailed. (b) Scatter plot demonstrating the relationship of the SL score with final infarct volume as determined by MRI diffusion weighted imaging. Linear correlation shown in red (p<0.05, Pearson’s correlation coefficient).

References

    1. Kövesdi E, Lückl J, Bukovics P, Farkas O, Pál J, Czeiter E, et al. (2010) Update on protein biomarkers in traumatic brain injury with emphasis on clinical use in adults and pediatrics. Acta Neurochir (Wien) 152: 1–17. 10.1007/s00701-009-0463-6 - DOI - PubMed
    1. Whiteley W, Chong WL, Sengupta A, Sandercock P (2009) Blood markers for the prognosis of ischemic stroke: a systematic review. Stroke; a journal of cerebral circulation 40: e380–e389. 10.1161/STROKEAHA.108.528752 - DOI - PubMed
    1. Dash PK, Zhao J, Hergenroeder G, Moore AN (2010) Biomarkers for the Diagnosis, Prognosis, and Evaluation of Treatment Efficacy for Traumatic Brain Injury. Neurotherapeutics 7: 100–114. 10.1016/j.nurt.2009.10.019 - DOI - PMC - PubMed
    1. Adams HP, del Zoppo G, Alberts MJ, Bhatt DL, Brass L, Furlan A, et al. (2007) Guidelines for the early management of adults with ischemic stroke: a guideline from the American Heart Association/American Stroke Association Stroke Council, Clinical Cardiology Council, Cardiovascular Radiology and Intervention Council, and the Atherosclerotic Peripheral Vascular Disease and Quality of Care Outcomes in Research Interdisciplinary Working Groups: The American Academy of Neurology affirms the value of this guideline as an educational tool for neurologists. Circulation 115: e478–e534. 10.1161/CIRCULATIONAHA.107.181486 - DOI - PubMed
    1. Del Zoppo GJ, Saver JL, Jauch EC, Adams HP, American Heart Association Stroke Council (2009) Expansion of the time window for treatment of acute ischemic stroke with intravenous tissue plasminogen activator: a science advisory from the American Heart Association/American Stroke Association. Stroke; a journal of cerebral circulation 40: 2945–2948. 10.1161/STROKEAHA.109.192535 - DOI - PMC - PubMed

Publication types