. 2015 Jun 16:6:7314.
doi: 10.1038/ncomms8314.

Parkinson-causing α-synuclein missense mutations shift native tetramers to monomers as a mechanism for disease initiation

Affiliations

Parkinson-causing α-synuclein missense mutations shift native tetramers to monomers as a mechanism for disease initiation

Ulf Dettmer et al. Nat Commun. .

Erratum in

Abstract

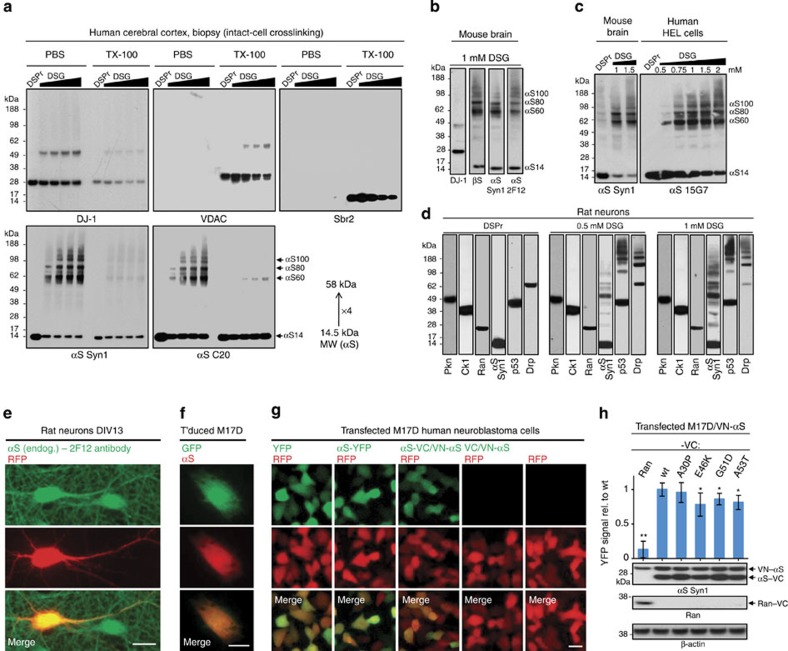
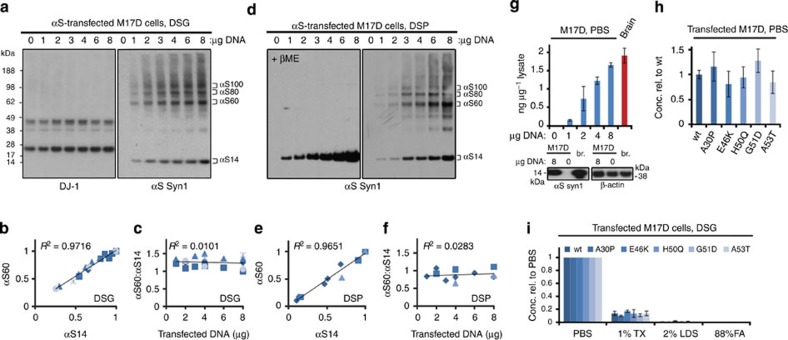
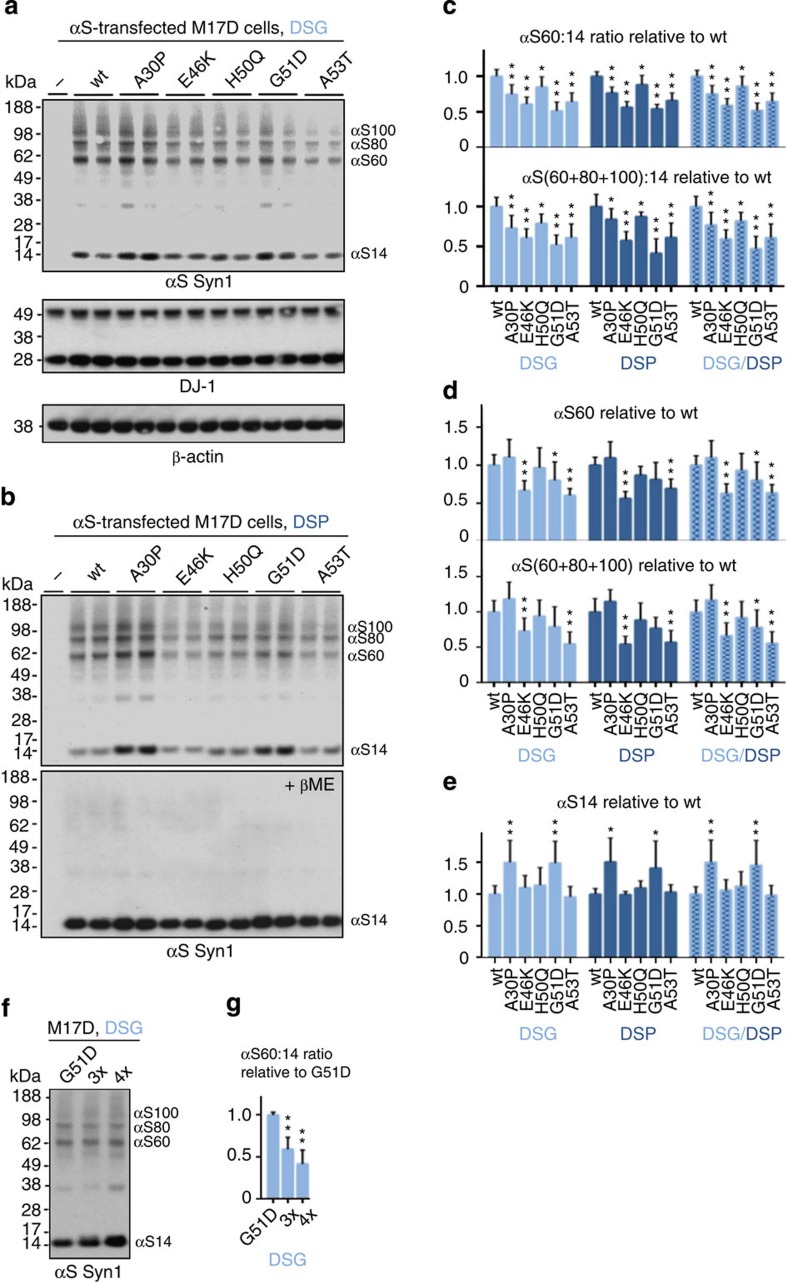
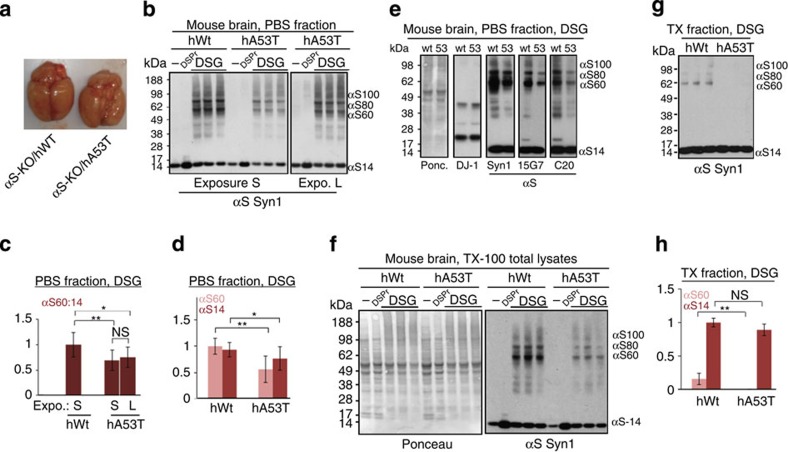
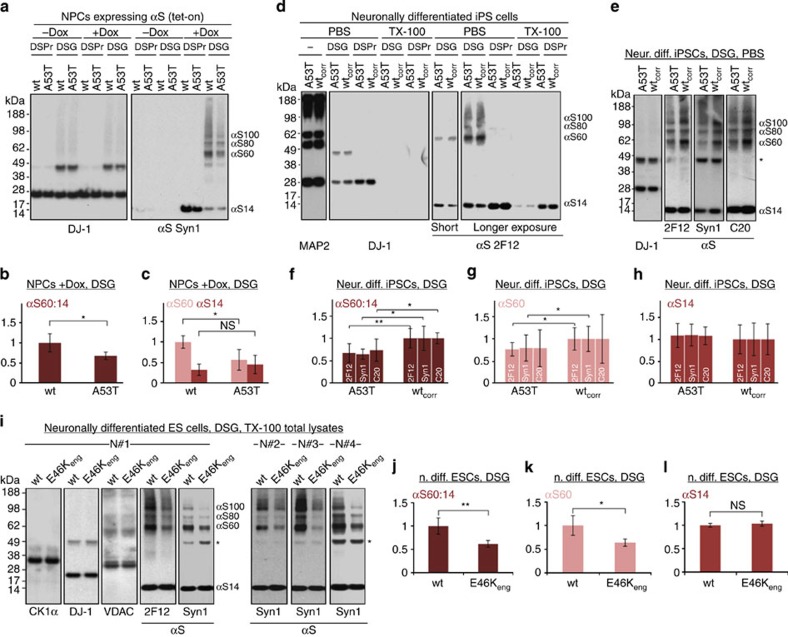
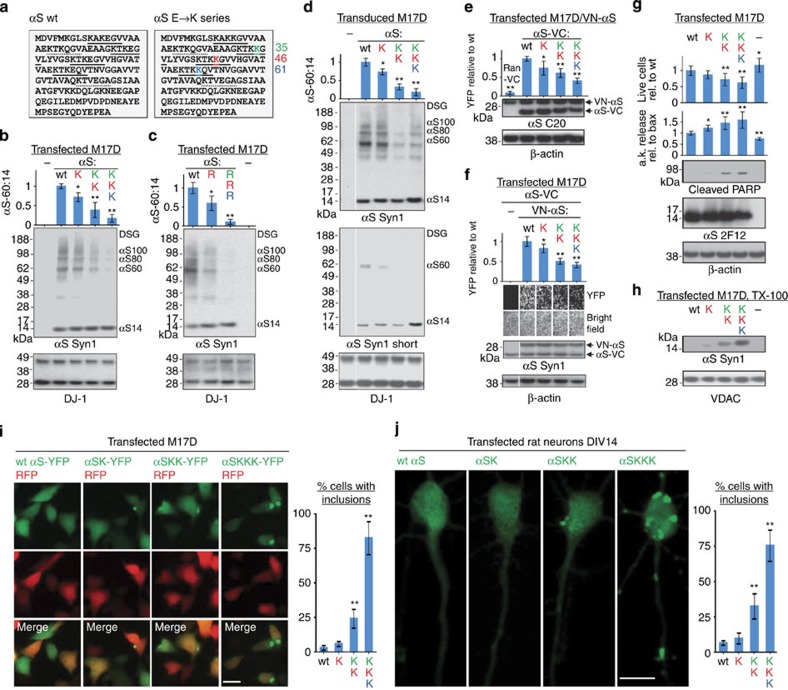
β-Sheet-rich α-synuclein (αS) aggregates characterize Parkinson's disease (PD). αS was long believed to be a natively unfolded monomer, but recent work suggests it also occurs in α-helix-rich tetramers. Crosslinking traps principally tetrameric αS in intact normal neurons, but not after cell lysis, suggesting a dynamic equilibrium. Here we show that freshly biopsied normal human brain contains abundant αS tetramers. The PD-causing mutation A53T decreases tetramers in mouse brain. Neurons derived from an A53T patient have decreased tetramers. Neurons expressing E46K do also, and adding 1-2 E46K-like mutations into the canonical αS repeat motifs (KTKEGV) further reduces tetramers, decreases αS solubility and induces neurotoxicity and round inclusions. The other three fPD missense mutations likewise decrease tetramer:monomer ratios. The destabilization of physiological tetramers by PD-causing missense mutations and the neurotoxicity and inclusions induced by markedly decreasing tetramers suggest that decreased α-helical tetramers and increased unfolded monomers initiate pathogenesis. Tetramer-stabilizing compounds should prevent this.


Conflict of interest statement

D.S. is a director and consultant to Prothena Biosciences. The remaining authors declare no competing financial interests.

Figures

Figure 1
Figure 1. αS multimers in normal brain tissues and neural cells.
(a) A fresh human cortical biopsy was crosslinked with either 1.75 mM DSP and reduced by βME (DSPr) or else with 1 mM DSG at increasing volume-to-protein ratio, followed by sequential extraction of PBS- and TX-100-soluble fractions. Each lane is one technical replicate from the biopsy. (b) Mouse brain, 1 mM DSG, PBS fraction; blots represent five independent experiments from different WT mice. (c) Mouse brain and human erythroleukemia (HEL) cells. DSG concentration gradients applied as indicated, and PBS fractions prepared; blots represent at least three independent experiments. (d) DIV13 rat neurons. 1.75 mM DSP/βME (DSPr, left panel), 0.5 mM DSG (middle) and 1 mM DSG (right) were applied, and PBS fractions prepared. Western blots for αS (Syn1 mAb), the monomeric proteins Parkin (Pkn), casein kinase 1α (CK1) and Ran, and the tetrameric proteins p53 and Drp1 (Drp); blots represent at least 3 independent experiments from different primary cultures. (e) Fluorescence microscopy of DIV13 rat neurons: endogenous αS in green (mAb 2F12) and transfected RFP (red), plus merged image; scale bar, 20 μm. (f) Fluorescence microscopy of virally transduced M17D cells: αS in red (mAb 2F12), GFP in green; scale bar, 5 μm. (g) Fluorescence microscopy of M17D cells transiently transfected with RFP plus YFP or αS-YFP or YFP αS complementation pairs, as indicated (empty vector control on far right). YFP in green, RFP in red, merge below; scale bar, 10 μm. (h) Quantification of multiple Venus-YFP complementation assays. A stable cell line M17D/VN-αS was transfected with DNA constructs expressing VC fused to αS (WT, A30P, E46K, G51D or A53T) or Ran (negative control). YFP complementation intensity relative to WT αS-VC transfection from N=8 independent experiments on 4 days using different DNA preparations;*P<0.05, **P<0.01, Student's t-test; relative to WT in this and subsequent figures, unless stated otherwise; error bars, s.d. Below are representative western blots for αS (Syn1 mAb), Ran, and the loading control β-actin.
Figure 2
Figure 2. Intact-cell crosslinking of αS expressed at varying levels.
(a) DSG-crosslinking analysis of an αS DNA gradient (0-8 μg per 6-cm culture dish). Western blots for αS (Syn1) and endogenous DJ-1. (b) DSG samples: αS60 intensities plotted against αS14 (densitometry). Highest value in each series was set to 1; graph shows mean data for N=5 independent experiments of 1, 2, 3, 4, 6, 8 μg DNA (2 exps.), 2, 4, 8 μg DNA (1 exp.) and 4, 8 μg DNA (2 exps.); data points generated in the same experiment are indicated by identical symbols. (c) αS60:αS14 ratios for the same samples as in 2b. (d) DSP-crosslinking analysis of an αS DNA gradient (0; 1-8 μg); western blots (Syn1) for αS in non-reduced and βME-reduced samples (e) Quantification of DSP samples: αS60 versus αS14. Highest value in each series was set to 1; N=3 independent experiments of 1, 2, 3, 4, 6, 8 μg DNA (1 exp.), 2, 4, 8 μg (1 exp.) and 4, 8 μg (1 exp.). (f) αS60:14 ratios for the same samples as in (e). (g) ELISA analysis of αS DNA gradients (1, 2, 4, 8 μg) transfected into M17D cells compared to human cortical homogenate (PBS fraction). Below: western blots for 0 and 8 μg DNA transfection versus human brain homogenate (red). N=2 for gradients (different days, different DNA preps) and brain homogenates. (h) ELISA of αS WT and fPD mutant transfectants (8 μg per 6-cm dish), PBS fraction. Graph: concentrations versus αS WT set to 1 (N=10 independent transfections on 4 different days using at least 4 different DNA preps per αS variant). tf'ed, transfected. (i) ELISA of αS WT and fPD mutant transfectants after 1 mM DSG crosslinking and sequential extraction (PBS→PBS/1%Triton→2% LDS→88% formic acid=FA). Graph: concentrations relative to the PBS fractions of the respective αS variant set to 1.
Figure 3
Figure 3. Intact-cell crosslinking of fPD-linked αS missense mutations.
(a) DSG crosslinking analysis of M17D cells transiently transfected with αS WT or the indicated mutations. Western blots for endogenous DJ-1 and transfected αS in duplicate (Syn1); each lane is one transfection. (b) Analagous to Fig. 2a, but using the reducible crosslinker DSP: upper panel, non-reduced: bottom panel, βME-reduced (Syn1). (c) DSG and DSP crosslinking, plus meta-analysis of both: intensity of αS60 alone (upper panel) or αS60+80+100 (lower panel) is graphed relative to WT αS (set to 1) (DSG: N=8 experiments each done in biological duplicates (n=2) on different days, total n=16; DSP: N=4, n=9). For better visibility in this and the following graphs, only one-direction error bars are shown. (d) DSG and DSP crosslinking plus meta-analysis: levels of αS60 alone (upper panel) or αS60+80+100 together (lower) relative to WT αS; (e) level of αS14 alone relative to WT αS. (f) Representative western blots of DSG crosslinking of 3x (H50Q-G51D-A53T) and 4x (3x+E46K) compound fPD mutants relative to G51D alone. (g) Quantification of αS60:14 ratio for 3x and 4x compound fPD mutants relative to G51D alone (N=4, n=8). *P<0.05, **P<0.01; one-sided ANOVA (see Methods) for all quantifications shown; error bars, s.d.
Figure 4
Figure 4. Transgenic hA53T versus hWT αS expressed in αS-/- mouse brain.
(a) Whole brains from both genotypes immediately before mincing. (b) Minced brain bits from both mouse genotypes were subjected to crosslinking, and PBS-soluble (‘cytosolic') fractions blotted (Syn1). Untreated (-), DSP/βME-treated (DSPr) and DSG-treated samples (in technical triplicate) are shown at identical short (S) exposures of hWT and hA53T samples (left panel) or a longer (L) exposure of the hA53T samples (right panel: exposure matched to αS14 intensity of hWT αS in the left panel). (c) Densitometry of the cytosolic αS60:14 ratios (relative to hWT, set to 1) based on both S and L exposures (N=3 mice of each genotype analysed on different days in triplicates of separate brain-bit samples, total n=9); NS, not significant. (d) Densitometry of cytosolic αS60 and αS14 bands in both genotypes based on identical exposures (N=3, n=9); values relative to hWT αS60. (e) DSG crosslinked mouse brain samples: cytosols blotted for αS (Syn1, 15G7, C20) and DJ-1; Ponceau-staining of the blot membrane is on left. DJ-1 served as control for equal crosslinking efficiency and equal loading. (f) Minced brain bits from both genotypes: TX-100 total homogenates (cytosolic and membrane proteins). Untreated (-), DSP/βME-treated (DSPr) and DSG-treated samples in triplicates (Syn1 mAb, right panel). Left panel, Ponceau-staining of the membrane. (g) DSG crosslinking of PBS-insoluble TX-100-soluble (TX) fractions of brain from both genotypes in triplicates. (h) Densitometry of αS60 and αS14 in the TX fractions (N=2 mice of each genotype analysed on different days in triplicates of separate brain bits, total n=6); values relative to those of hWT αS14. *P<0.05, **P<0.01; Student's t-test (see Methods) for all quantifications shown; error bars, s.d.
Figure 5
Figure 5. A53T versus WT αS in hESC- and hiPSC-derived neurons.
(a) Crosslinking analysis of non-induced (-Dox) and induced (+Dox) hESC-derived NPCs expressing WT or A53T αS: PBS-soluble fraction. DSP/βME-treated (DSPr) and DSG-treated samples were blotted for DJ-1 and αS (Syn1). (b) Quantification of the cytosolic αS60:14 ratios (N=3 different cultures, each analysed in parallel in duplicates, total n=6); ratios relative to WT αS. (c) Quantification of cytosolic αS60 and αS14 for both genotypes (normalized to WT αS60); NS, not significant. (d) Crosslinking analysis of neurons differentiated from human A53T iPSCs versus their genetically corrected isogenic WT line (WTcorr). PBS and TX-100 fractions of untreated (−), DSP/βME-treated and DSG-treated cells were probed for DJ-1 and αS (2F12). (e) DSG-crosslinked samples: cytosols blotted for αS (2F12, C20, Syn1) and DJ-1; * non-specific band detected only by Syn1 (ref. 9). (f) Densitometry of the cytosolic αS60:14 ratios (relative to WT) as detected by 2F12, C20 and Syn1 (N=4 cultures grown independently and analysed on different days in biological duplicates or triplicates; total n=10). (g) Densitometry of cytosolic αS60 (relative to WT) for both genotypes. (h) Densitometry of cytosolic αS14 (versus WT) for both genotypes. (i) Crosslinking analysis of neurons differentiated from WT hESCs or from a genetically engineered isogenic E46K line (E46Keng). TX-100 total protein lysates of DSG-treated cells were probed with casein kinase 1α (cytosolic monomer), DJ-1 (cytosolic dimer), VDAC (membrane-associated dimer) and αS (mAbs 2F12 and Syn1). The five panels on the left are from one experiment (N#1), the three panels on the right show the Syn1 western blots from three independent experiments (N#2-4, each quality-controlled by DJ-1 and VDAC western blots). *non-specific band detected only by Syn1 (ref. 9). (j) Densitometry of the cytosolic αS60:14 ratios (relative to WT) as detected by Syn1 mAb (N=4 cultures grown independently). (k) Densitometry of cytosolic αS60 (versus WT) for both genotypes. (l) Densitometry of cytosolic αS14 (versus WT) for both genotypes. *P<0.05, **P<0.01; Student's t-test (see Methods) for all quantifications shown; error bars, s.d.
Figure 6
Figure 6. Multimers/toxicity/inclusions with 1-3 E46K-like mutations.
(a) Schematic of human αS sequence showing engineered mutations (color-coded). Highly conserved KTKEGV motifs underlined, less conserved motifs dotted. (b) DSG-treated M17D cells expressing the indicated αS variants lysed in PBS/1% TX-100; graph (αS60:14 ratios by western blot densitometry) and western blots (Syn1, anti-DJ-1) represent N=3 experiments on different days. For this and the following graphs, WT set to 1 unless stated otherwise. (c) Analogous to (b) but 1 or 3 E→R substitutions. (d) Analogous to (b) using lentiviral pools; long and short western blot exposures, blots cut once as indicated. (e) Venus-YFP complementation assay by automated fluorescence reading. M17D/VN-αS cells transfected with αS-VC WT or mutant or Ran-VC (negative control). YFP fluorescence relative to WT; N=6 independent experiments on 3 different days using different DNA preparations. Representative western blots for αS (pAb C20) plus loading control β-actin. (f) Venus-YFP complementation assay by fluorescence microscopy; αS-VC (always WT) and 3 indicated VN-αS mutants were co-expressed (or not: -) in M17D cells; representative bright-field or fluorescent images and corresponding western blots (Syn1; β-actin as a loading control; blots cut as indicated). N=8 independent transfections on 3 different days. (g) Cytotoxicity assays: trypan blue exclusion for live cell count (N=18) relative to WT αS, Toxilight assay for adenylate kinase (a.k.) release relative to Bax (N=12), and western blot for cleaved PARP (representative of 6 independent experiments), each transfected as indicated or mock (-); plus western blots for αS (2F12) and β-actin (total lysates PBS/1% TX-100). (h) Western blots for αS (Syn1) and VDAC in TX-100-soluble fractions of M17D cells transfected as indicated. (i) Fluorescence microscopy of live M17D cells co-expressing RFP plus indicated αS-YFP variants; scale bar, 10 μm. Percentages of cells with inclusions were counted in a blinded fashion (right: N=3; 100 cells each). (j) Fluorescence microscopy of rat neurons (DIV14) transfected with indicated untagged αS variants; immunofluorescence with human-specific mAb 15G7; scale bar, 20 μm. Percentages of cells showing inclusions, blinded counting (right: N=3; 100 cells each). *P<0.05, **P<0.01; one-sided ANOVA (see Methods) for all quantifications shown; error bars, s.d.

Comment in

References

    1. Spillantini M. G. et al.. Alpha-synuclein in Lewy bodies. Nature 388, 839–840 (1997). - PubMed
    1. Polymeropoulos M. H. et al.. Mutation in the alpha-synuclein gene identified in families with Parkinson's disease. Science 276, 2045–2047 (1997). - PubMed
    1. Krüger R. et al.. Ala30Pro mutation in the gene encoding alpha-synuclein in Parkinson's disease. Nat. Genet. 18, 106–108 (1998). - PubMed
    1. Zarranz J. J. et al.. The new mutation, E46K, of alpha-synuclein causes Parkinson and Lewy body dementia. Ann. Neurol. 55, 164–173 (2004). - PubMed
    1. Singleton A. B. et al.. alpha-Synuclein locus triplication causes Parkinson's disease. Science 302, 841 (2003). - PubMed

Publication types