Randomized Controlled Trial
. 2015 Aug;109(8):1001-11.
doi: 10.1016/j.rmed.2015.05.018. Epub 2015 May 23.

Moderate intensity exercise mediates comparable increases in exhaled chloride as albuterol in individuals with cystic fibrosis

Affiliations
Randomized Controlled Trial

Moderate intensity exercise mediates comparable increases in exhaled chloride as albuterol in individuals with cystic fibrosis

Courtney M Wheatley et al. Respir Med. 2015 Aug.

Abstract

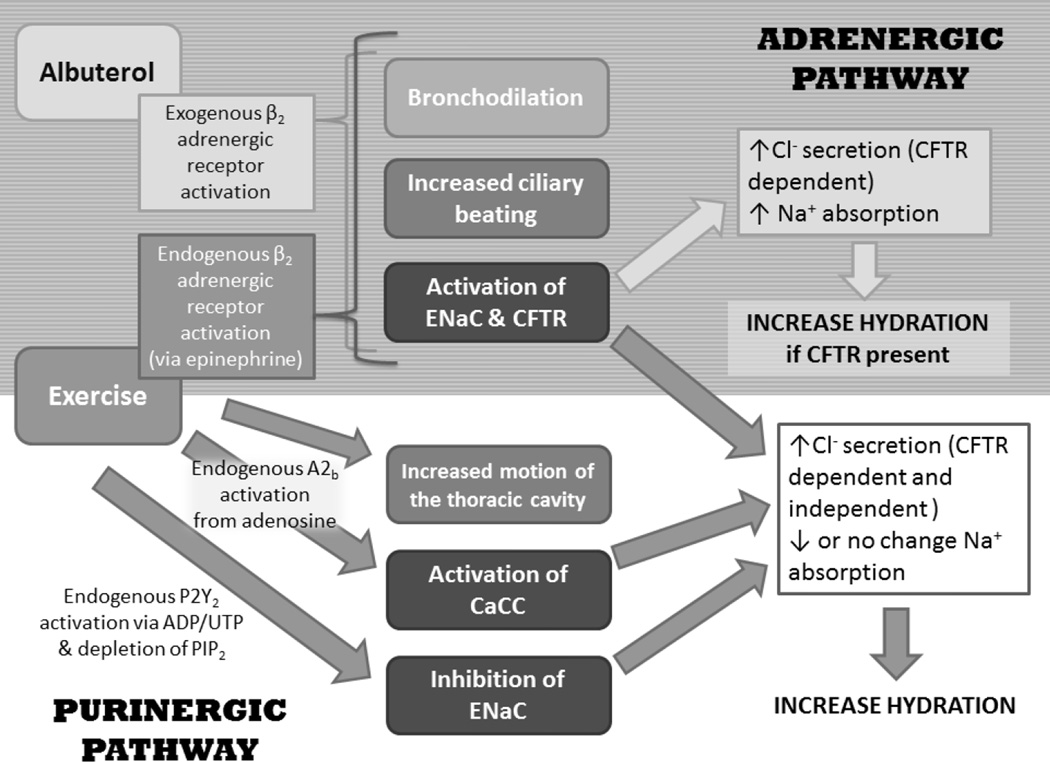
Rationale: Despite the demonstrated advantageous systemic changes in response to regular exercise for individuals with cystic fibrosis (CF), exercise is still viewed as an elective rather than a vital component of therapy, and it is likely that these benefits extend to and are partially mediated by exercise-induced changes in ion regulation.

Objective: We sought to determine if exercise could provide comparable improvements in ion regulation in the CF lung as albuterol, measured using exhaled breath condensate (EBC) collection and nasal potential difference (NPD).

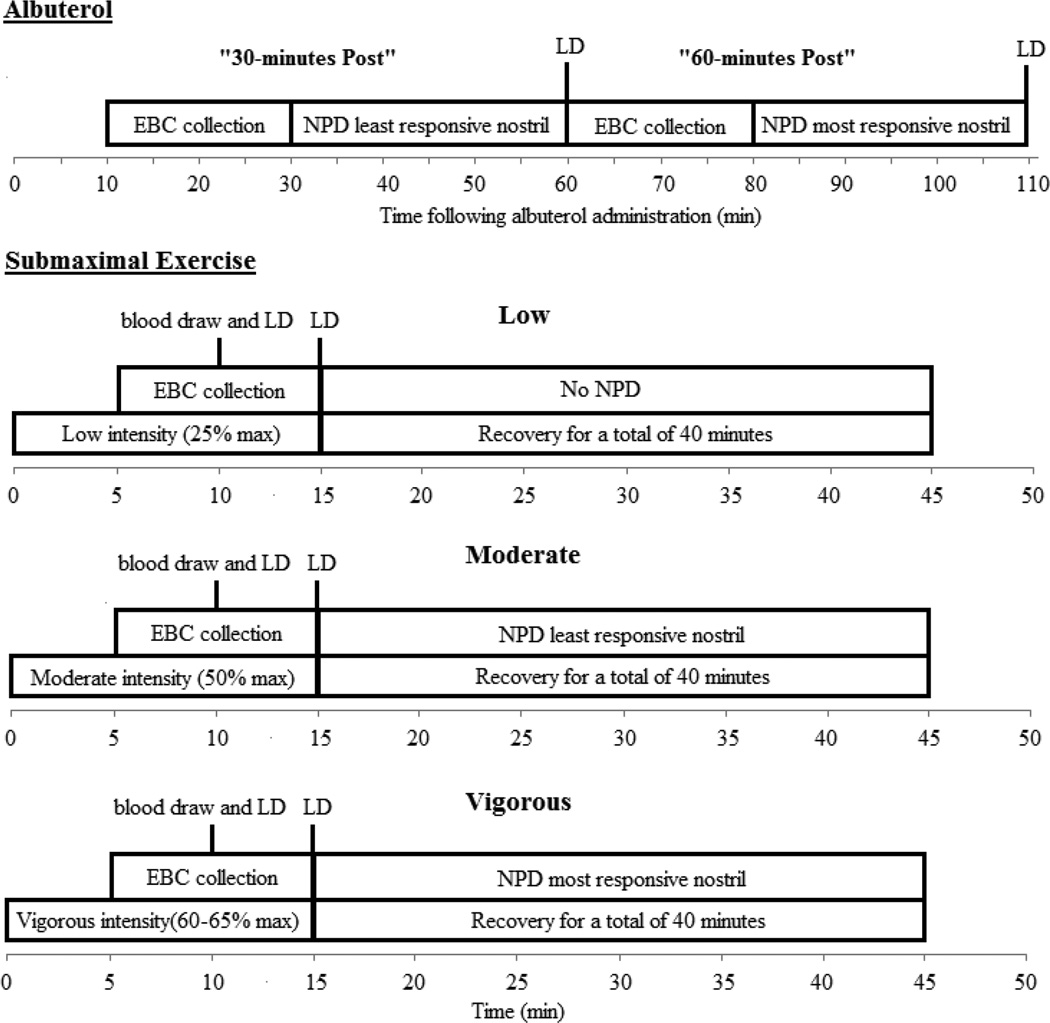
Methods: Fourteen CF (13-42 yrs.) and sixteen healthy (18-42 yrs.) subjects completed a randomized crossover study of albuterol and submaximal exercise. EBC was collected at baseline, 30- and 60-min post-albuterol administration, and at baseline and during three separate 15 min cycling exercise bouts at low, moderate, and vigorous intensity (25, 50 and 65% of the maximum workload, respectively). NPD was performed at 30- and 80-min post albuterol or following moderate and vigorous intensity exercise.

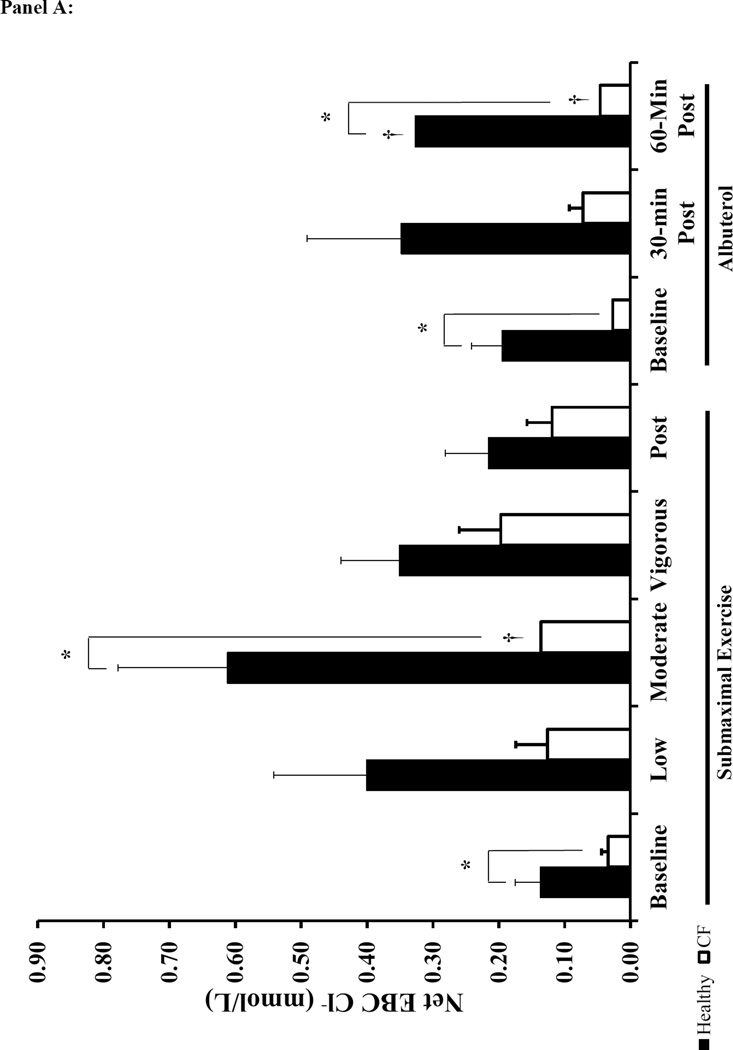
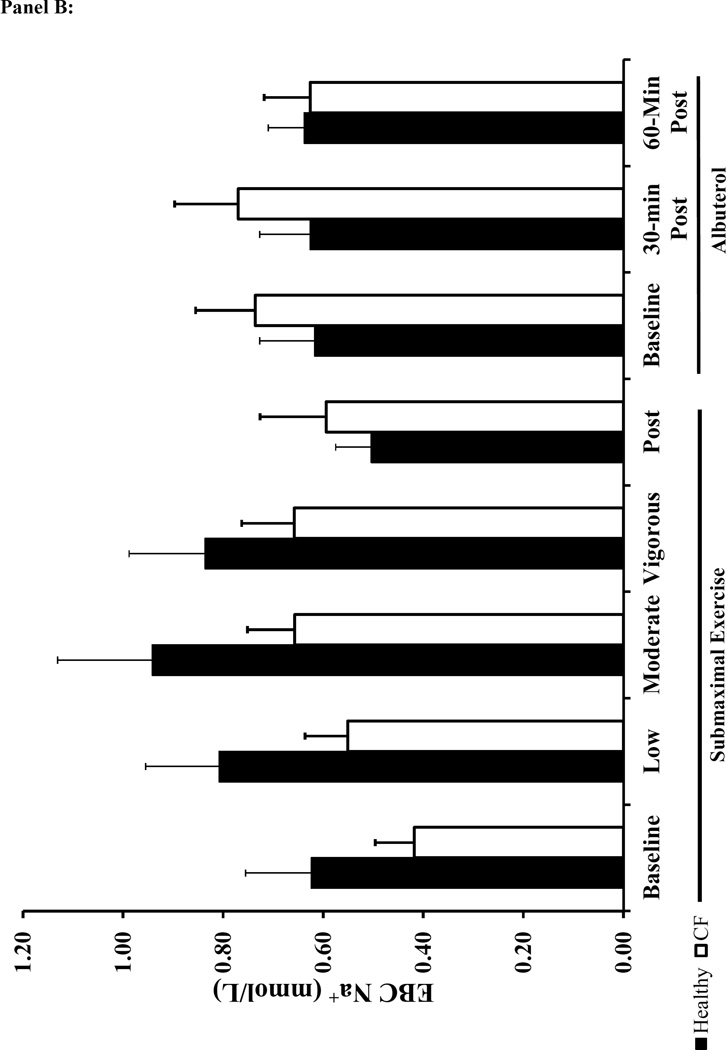
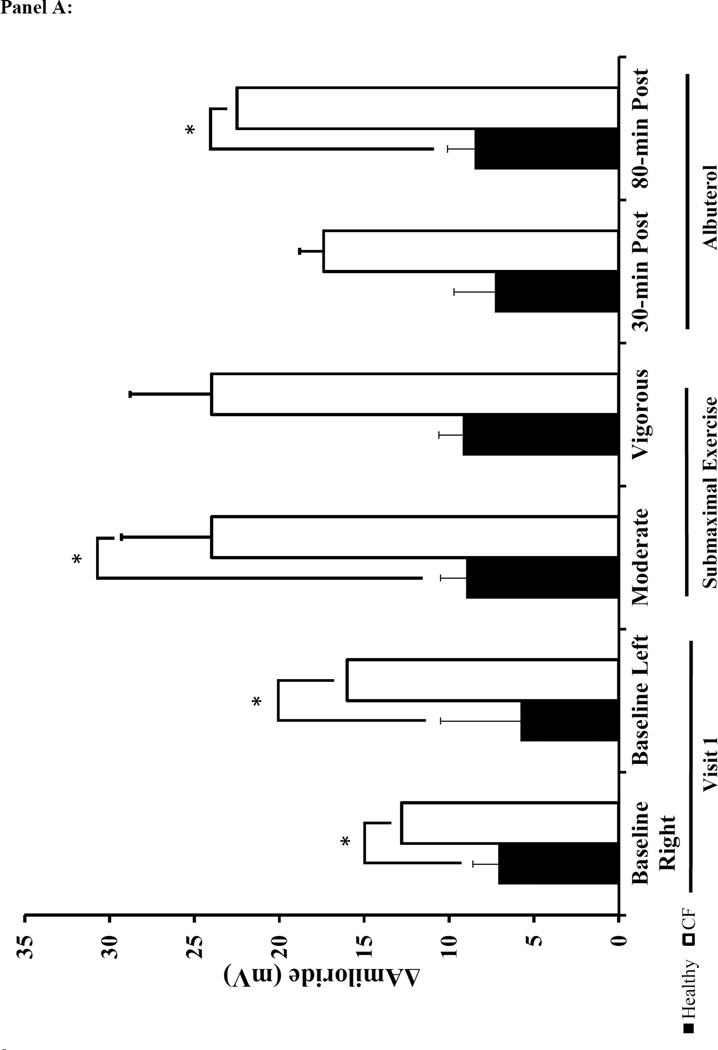
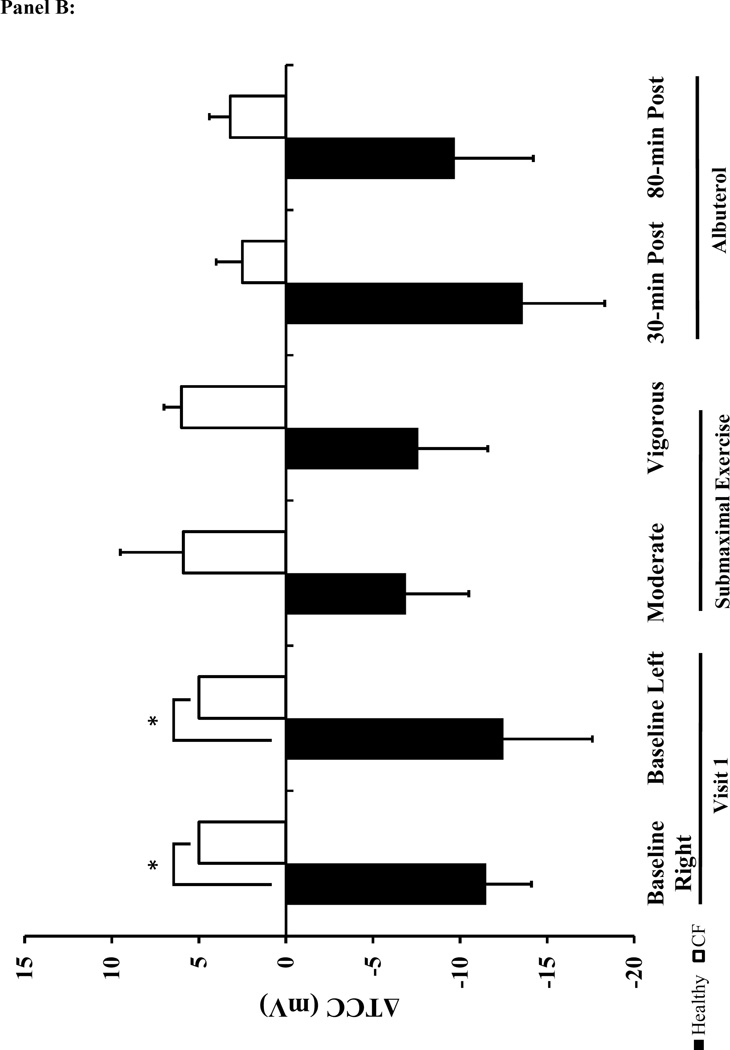
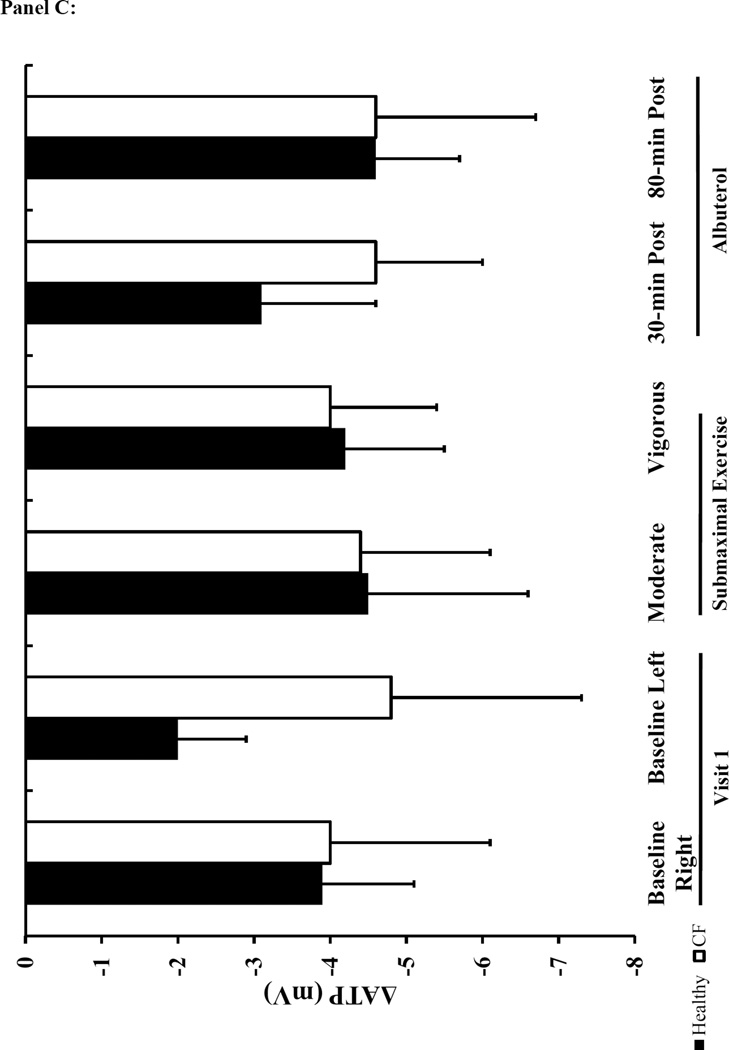
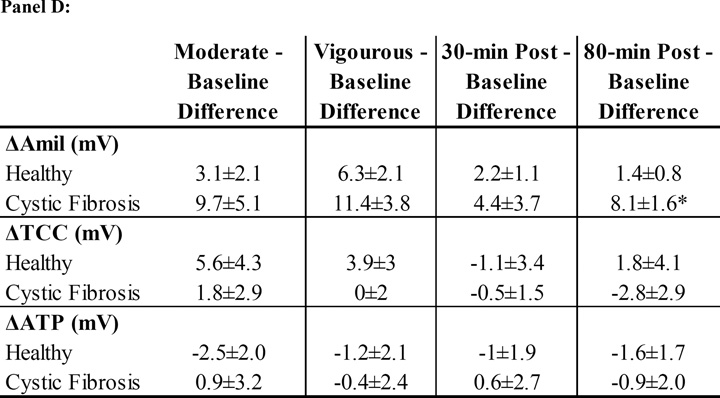
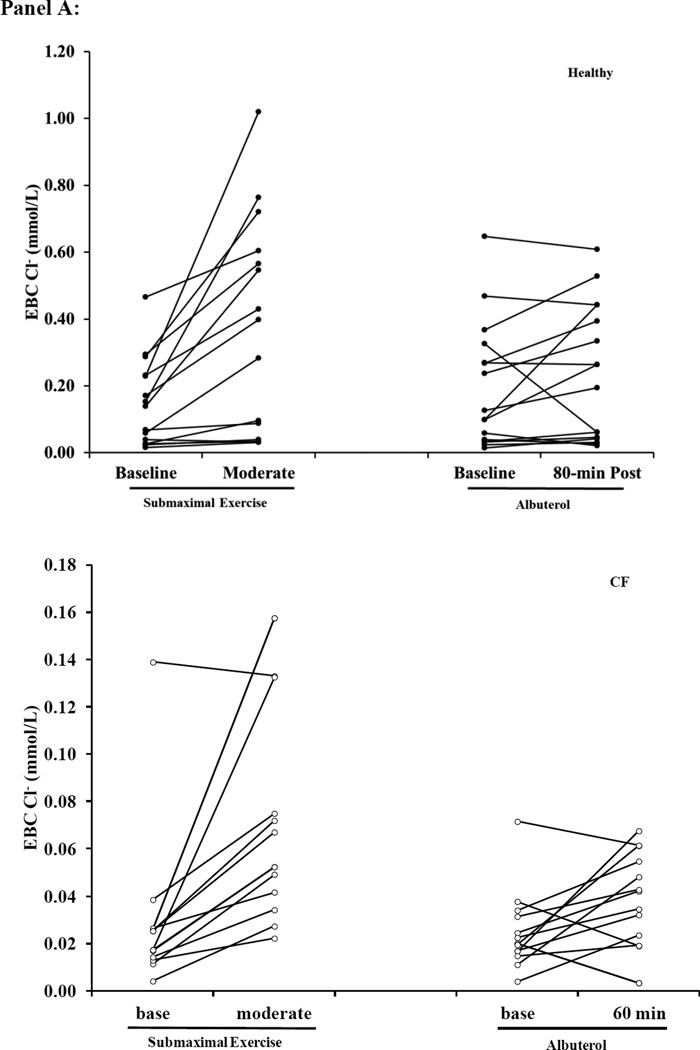
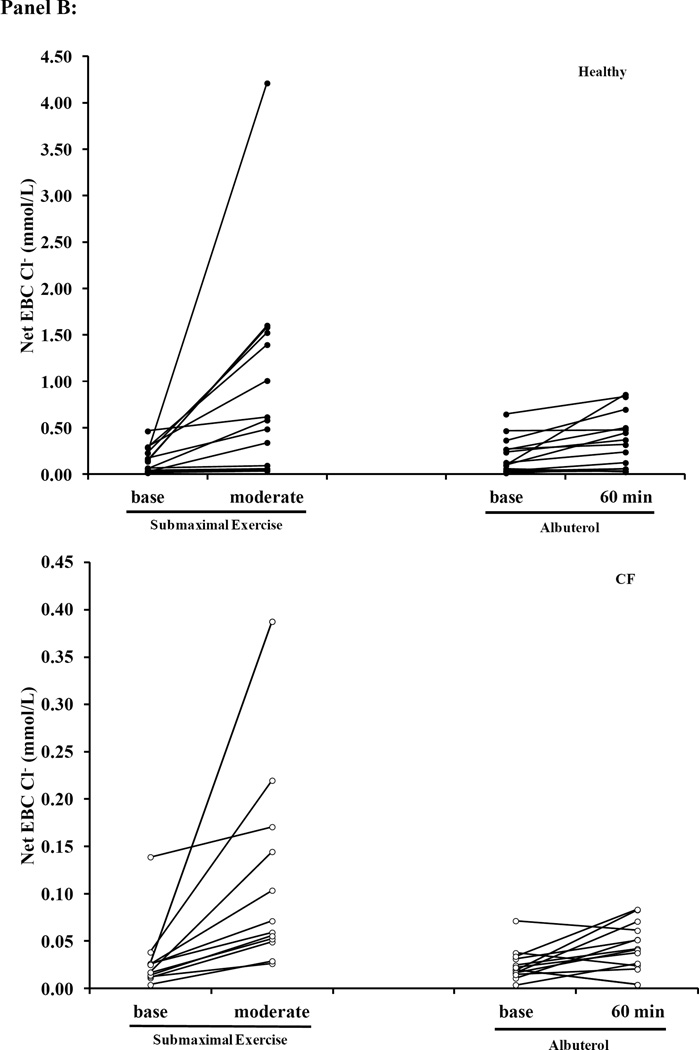
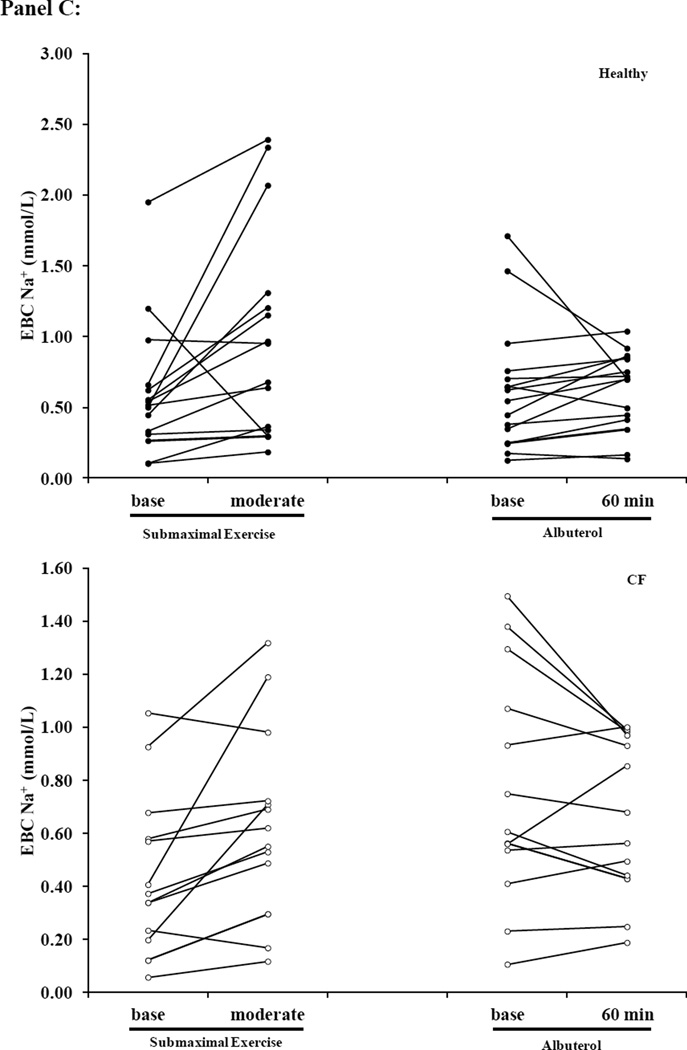
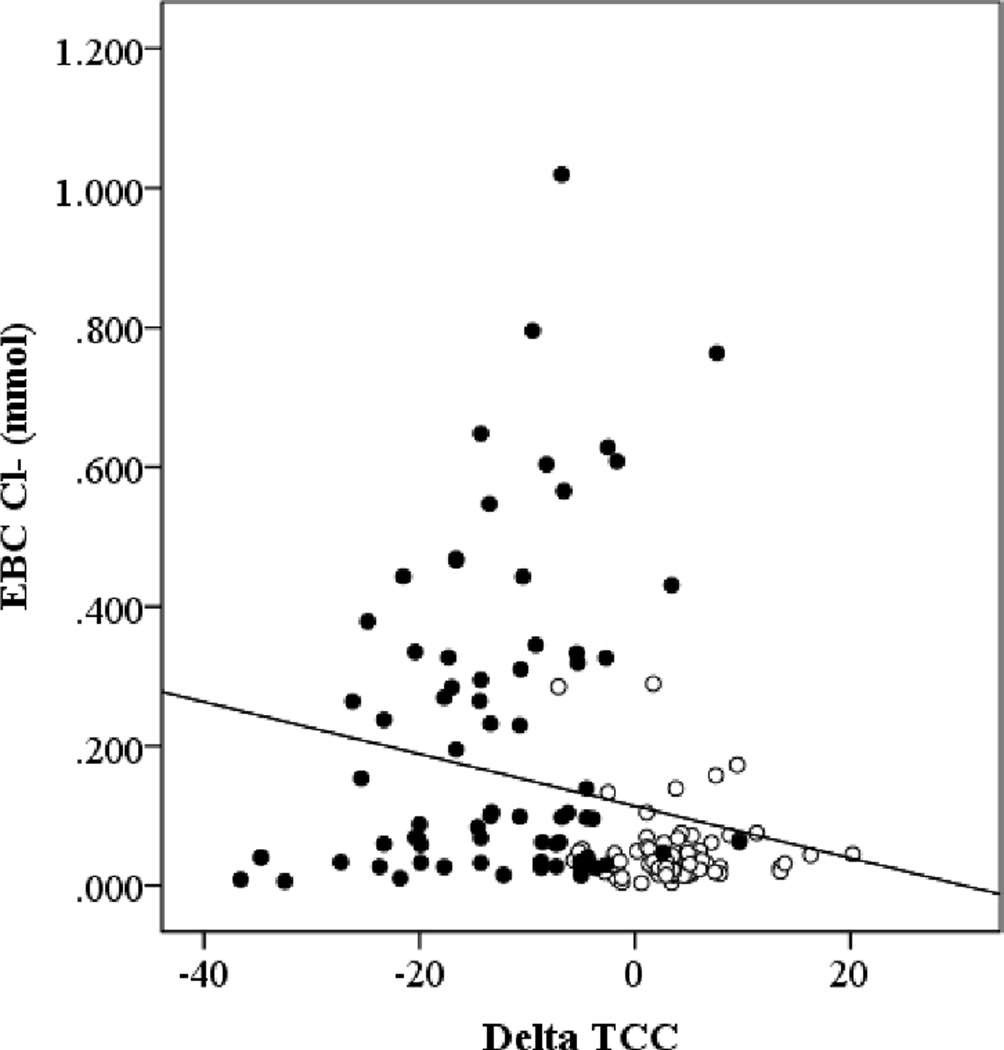
Results: CF subjects had lower EBC Cl(-), but no difference in EBC Na(+) at baseline when compared to healthy subjects. EBC Cl(-) increased four-fold with moderate exercise which was similar to that seen 60-min post albuterol administration for CF subjects. Neither exercise nor albuterol altered EBC Na(+). The change in NPD voltage with amiloride (ΔAmil) was greater and there was minimal Cl(-) secretion (ΔTCC) seen at baseline in the CF compared to the healthy subjects. ΔAmil was greater with both albuterol and exercise when compared to baseline within both CF and healthy groups, but there was no significant difference in the ΔTCC response with either treatment.

Conclusion: Both exercise and albuterol can alter ion regulation increasing Cl(-) secretion to a significant and similar degree in individuals with CF.

Keywords: Airway surface liquid; Beta-2 adrenergic receptor (ADBR2); Epithelial sodium channels (ENaC); Exhaled breath condensate (EBC); Nasal potential difference (NPD); Purinergic receptor (P2Y(2)).


Figures

Figure 1
Figure 1. Summary of Expected Changes in Ion Channel Regulation in Response to Albuterol and Exercise
Endogenous or exogenous activation of the purinergic (P2Y2) and adrenergic (β2) pathways are two mechanisms by which alterations in the ion composition of the ASL can be mediated. Such that water follows an increase in salt concentration in the ASL, increase the ASL depth and hydrate the lungs. Exercise endogenously activates both the adrenergic and purinergic pathways, whereas albuterol exogenously activates only the adrenergic pathway. CFTR: cystic fibrosis transmembrane conductance regulator; ENaC: epithelial Na+ channels; A2b: adenosine receptor (A2b); ADP/UDP: adenosine diphosphate/uridine diphosphate; PIP2: phosphatidylinositol 4,5-bisphosphate; CaCC: calcium-dependent chloride channels.
Figure 2
Figure 2. Timeline of Measurements during Submaximal and Albuterol Visits
EBC: exhaled breath condensate; NPD: nasal potential difference; LD: diffusion capacity of the lungs for nitric oxide. A baseline a 20 minute EBC collection with a midpoint blood draw was completed before these timelines started and a post EBC collection followed the final exercise bout. Submaximal exercise bouts were randomized: low-moderate-vigorous or vigorous-moderate-low.
Figure 3
Figure 3. Effects of Submaximal Exercise and Albuterol on EBC Na+ and Net Cl
Panel A: Net EBC Cl (see methods for equation). Panel B: EBC Na+. The black bars represent healthy subjects and the white bars represent CF subjects. The error bars represent the standard error of the mean. * = p<0.025 healthy vs. CF and † = p<0.025 vs. baseline
Figure 4
Figure 4. NPD Measured Changes in Na+ and Cl in Response to Submaximal Exercise and Albuterol
Panel A: ΔAmil=change with amiloride (measure of changes in Na+ flux). Panel B: ΔTCC=total Cl conductance. Panel C: ΔATP=change with ATP. The black bars represent healthy subjects and the white bars represent cystic fibrosis subjects. Panel D: The table lists the mean difference in NPD response between the baseline tracing and the tracings performed on the two treatment visits (treatment-baseline). The most responsive nostril served to compare the difference in NPD response between baseline to vigorous and baseline to 80-min post albuterol. The other nostril served to compare the difference between baseline to moderate and baseline to 30-minutes post albuterol. Data presented at mean±SEM. *p<0.025 vs. healthy † p<0.025 vs. moderate intensity
Figure 5
Figure 5. Scatter plots of EBC Na+, Cl and Net Cl during Submaximal and Albuterol Visits
Panel A: EBC Cl (Top: Healthy Bottom: Cystic Fibrosis (CF)) Panel B: Net EBC Cl (Top: Healthy; Bottom: CF) Panel C: EBC Na+ (Top: Healthy; Bottom: CF). Healthy subjects are represented by the black circles and the open circles represent CF subjects. The y-axis scaling is different between the two groups, so that the individual changes for subjects within each condition can be appreciated, and due to the difference in Cl secretion levels between healthy and CF subjects we have kept the scale specific to each condition.
Figure 6
Figure 6. Relationship between EBC Cl and NPD measured Cl Flux (ΔTCC)
The black circles represent healthy subjects and the open circles represent CF subjects. All of the time points for both the albuterol and submaximal exercise visits have been included in the plot. ρ=−0.327, p=0.000.

References

    1. Boucher RC. Molecular insights into the physiology of the 'thin film' of airway surface liquid. J Physiol. 1999;516(Pt 3):631–638. - PMC - PubMed
    1. Matsui H, Grubb BR, Tarran R, et al. Evidence for periciliary liquid layer depletion, not abnormal ion composition, in the pathogenesis of cystic fibrosis airways disease. Cell. 1998;95(7):1005–1015. - PubMed
    1. Mall M, Grubb BR, Harkema JR, O'Neal WK, Boucher RC. Increased airway epithelial Na+ absorption produces cystic fibrosis-like lung disease in mice. Nat Med. 2004;10(5):487–493. - PubMed
    1. Rowe SM, Miller S, Sorscher EJ. Cystic fibrosis. N Engl J Med. 2005;352(19):1992–2001. - PubMed
    1. Schneiderman-Walker J, Pollock SL, Corey M, et al. A randomized controlled trial of a 3-year home exercise program in cystic fibrosis. J Pediatrics. 2000;136(3):304–310. - PubMed

Publication types

MeSH terms