

Robust intestinal homeostasis relies on cellular plasticity in enteroblasts mediated by miR-8-Escargot switch
- PMID: 26077448
- PMCID: PMC4551350
- DOI: 10.15252/embj.201591517
Robust intestinal homeostasis relies on cellular plasticity in enteroblasts mediated by miR-8-Escargot switch
Abstract
The intestinal epithelium is remarkably robust despite perturbations and demand uncertainty. Here, we investigate the basis of such robustness using novel tracing methods that allow simultaneously capturing the dynamics of stem and committed progenitor cells (called enteroblasts) and intestinal cell turnover with spatiotemporal resolution. We found that intestinal stem cells (ISCs) divide "ahead" of demand during Drosophila midgut homeostasis. Their newborn enteroblasts, on the other hand, take on a highly polarized shape, acquire invasive properties and motility. They extend long membrane protrusions that make cell-cell contact with mature cells, while exercising a capacity to delay their final differentiation until a local demand materializes. This cellular plasticity is mechanistically linked to the epithelial-mesenchymal transition (EMT) programme mediated by escargot, a snail family gene. Activation of the conserved microRNA miR-8/miR-200 in "pausing" enteroblasts in response to a local cell loss promotes timely terminal differentiation via a reverse MET by antagonizing escargot. Our findings unveil that robust intestinal renewal relies on hitherto unrecognized plasticity in enteroblasts and reveal their active role in sensing and/or responding to local demand.
Keywords: EMT/MET; Escargot/Snail2–miR‐8/miR‐200; intestinal homeostasis; intestinal renewal; stemness.
© 2015 The Authors. Published under the terms of the CC BY NC ND 4.0 license.
Figures
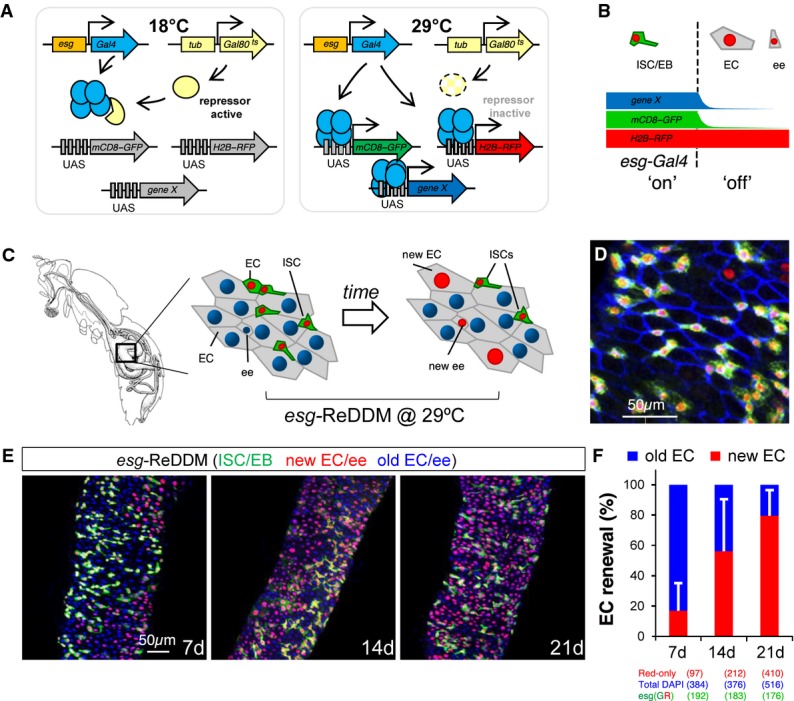
Schematic illustration of the transgenes used in ReDDM (repressible dual differential stability markers) combined with the esg-Gal4 and a transgene (UAS-gene X) for mis/overexpression or downregulation via RNAi.
The ReDDM relies on the differential protein stabilities of a pair of fluorescent proteins: the short-lived mCD8-GFP (green) serves as a morphological and an accurate temporal marker of the Gal4 activity (e.g. esg-Gal4), while the long-lived H2B-RFP (red) allows for tracing any newly differentiated progeny derived from the esg-Gal4 cells. The esg-Gal4 drives expression in the ISCs and enteroblasts (EBs) and is turned off in terminal differentiated EC (enterocyte) and ee (enteroendocrine) cells.
Images illustrate the unlabelled (grey) adult Drosophila melanogaster gut and the esgReDDM-labelled midgut just after the temperature shift (left scheme) and 7 days later (right scheme).
Representative confocal image from the midgut 7 days after temperature shift. Blue staining (anti-Discs-large-1, a-Dlg-1) outlines the intestinal epithelial cell membranes. Any newly generated differentiated progeny is highlighted by the nuclear H2B-RFP (red) label, while differentiated cells lasting in the midgut epithelium are unlabelled and visualized by counterstaining with DAPI or outlined by a-Dlg-1.
Intestinal cell renewal (visualized as red-retaining labelling cells) in midguts 7, 14 and 21 days after the temperature shift.
The graph shows the quantification of posterior midgut cell renewal (red/unlabelled EC and ee cells) ratio over time using ReDDM in the homeostatic midguts shown in (E). Red bars (new EC and ee cells) and blue bars (old EC and ee), detected by 4′,6-diamidino-2-phenylindole (DAPI, blue) counterstaining. Error bars represent standard deviation of the mean.
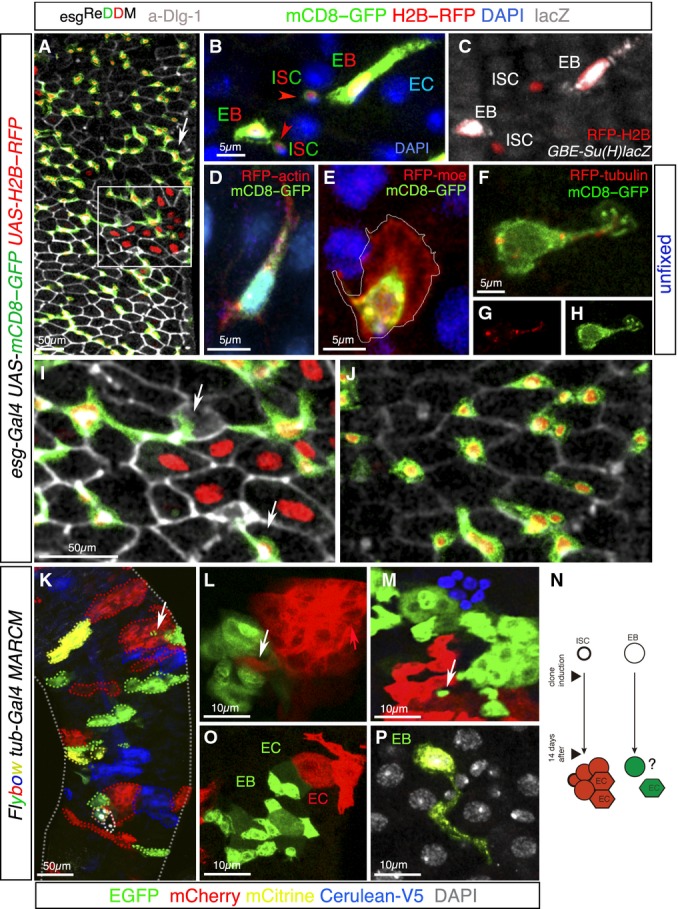
A Representative confocal image of an esgReDDM adult midgut 7 days after the temperature shift. The large esg+ cell clusters (arrows) reflect substantial production by the individual ISCs in the absence of cell turnover in their local surroundings. Not-yet renewed cells (old mature cells) are detected by DAPI (not shown in the image) and outlined by the adherens junction protein marker Dlg-1 (grey).
B, C A high magnification image (ISC, intestinal stem cell; EB, enteroblast, EC, enterocyte) in which the lower EB represents a middle stage, and the upper EB a typical late stage (enterocyte-committed, polyploid enteroblast). (C) Co-staining with GBE-Su(H)-lacZ (white) identified the enteroblasts from their mother ISCs. Note the stronger esg > GFP signal and larger size of Su(H)+ (EB) cells.
D–H Confocal images of esg+ cells in unfixed wild-type adult midguts in homeostatic conditions. Enteroblasts are distinguished by their brighter GFP signal and larger size (see B). Cells are co-labelled by GFP (detecting esg > mCD8-GFP, green), RFP-actin (D), RFP-moesin (E) and RFP-tubulin (F–H). The image shows a single channel of RFP-tubulin (G) or mCD8-GFP (H).
I Magnification from (A) showing the intestinal epithelial cells outlined by Dlg-1 labelling (grey) and the interstitial position of the enteroblasts (which lacks the epithelial marker Dlg-1). Enteroblasts extend long protrusions along the EC borders.
J Magnification from (A) showing EBs in non-regenerated area.
K–N Representative confocal images showing Flybow (FB2.0) clones 14 days ACI (after clone induction). (K) Clones are varied in size and elongated, round or irregular in shape revealing plastic patterns of tissue turnover. Neighbouring clones can have intercalated cells (K–M, arrows). (N) Scheme of the Flybow MARCM method (Lee & Luo, ; Hadjieconomou et al, 2011) of expected outcome (a multicellular clone or a single cell) depending on whether the labelled daughter cell after induction of FLP to activate FRT-mediated mitotic recombination is an ISC or a EB.
O, P Images illustrate multicellular clones (O) and single-cell clone (P). The two neighbouring clones are composed of newly differentiated (hexagonal cells, EC) and undifferentiated (EB) cells, which tend to be strongly polarized. (P) A single-cell clone with long protrusion and large size typical of undifferentiated enteroblast surrounded by not-yet renewed cells. The old intestinal cells are colourless and visualized by DAPI nuclear counterstaining (white).
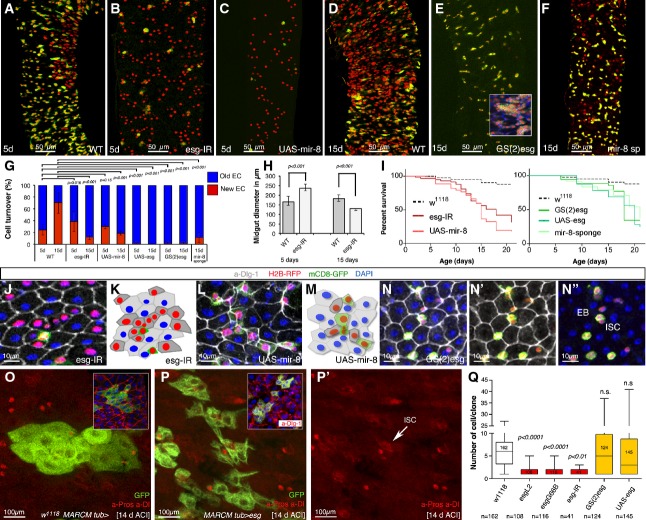
A–F Representative ReDDM in esg-Gal4 midguts of the indicated genotypes 5 or 15 days after the temperature shift that activates Gal4. (A) Intestinal renewal occurs in a patchy pattern indicating local demand. (B, C) Precocious differentiation of esg+ cells upon escargot depletion in esg+ cells (esgReDDM UAS-esg-IR, B) or upon misexpression of the mir-8 microRNA (esgReDDM UAS-mir-8, C). (D–F) ISCs and progenitor cells overexpressing escargot in the esg+ pattern (esgReDDM GS(2)esg, E) or with depleted mir-8 (esgReDDM UAS-mir-8-sponge, F) fail to exit the undifferentiated state, or their terminal differentiation was severely impaired, respectively. The control gut had renewed almost 75% of their enterocytes at the time point shown (2 weeks after temperature shift, D). Inset in (E) shows tumour-like accumulations of undifferentiated cells. The penetrance of all shown phenotypes is nearly 100%, and shown are representative images.
G Quantification of intestinal cell replenishment as a ratio of new EC/old EC (red-only DAPI/”colourless” DAPI cells) in each genotype at the time point indicated. Error bars represent the standard deviations (SD) (n = 13 control guts scored for day 5 and n = 10 for day 15; n = 11 midguts (day 5) and n = 9 (day 15) for esg-IR; n = 6 (day 5) and n = 6 (day 15) for UAS-mir-8; n = 11 (day 5) and n = 11 (day 15) for GS(2)esg; n = 8 (day 5) and n = 7 (day 15) for UAS-mir-8-sponge). Unpaired t-test values are shown.
H The graphs show the diameter of control (WT, n = 5 midguts (day 5) and n = 8 (day 15)) and escargot RNAi (esg > esg-IR: n = 8 (day 5) and n = 9 (day 15)) ReDDM-based midguts at the time point indicated. Error bars represent SD, and t-test values are shown.
I Survival (as percentage of animals) over time of the indicated transgenes expressed under the esg-Gal4 control. Survival curves were constructed combining data from at least 10 vials, each with 10–15 flies, in a genotype group. Log-rank (Mantel–Cox) analysis indicated that escargot and mir-8 manipulations significantly reduced animal survival (P < 0.001).
J–N (J) Precociously differentiated esg > esg-IR mutant ISC/EB cells are smaller than normal enterocytes, but integrate correctly into the epithelium. (L) Precociously differentiating mir-8 overexpressing ISC/EB intercalate incorrectly and amassed in the epithelium. Mature epithelial cells are marked by a-Dlg-1 (grey). (K, M) show schematic illustrations of the gut epithelium from the indicated genotypes. (N–N″) The escargot-overexpressing (esgReDDM GS(2)esg) progenitor cells have a more rounded shape than wild-type progenitor cells but can be distinguished from their mother ISCs by their larger size (N″).
O, P MARCM tub-Gal4 clones at day 14 ACI of control midguts (O) and overexpressing escargot cells (P). Insets show clones of the cells of the indicated genotype where mature cells are visualized by their labelling by Dlg-1 (red). (P′) Single-channel image illustrates that escargot-overexpressing clones contain enteroendocrine cells (nuclear red, a-Pros) and ISC (cytoplasmic red, a-Dl: arrowhead).
Q Box plot of clonal size in MARCM tub-Gal4 of the indicated genotypes in midguts 7 days after clone induction. Median value is shown. Student’s t-test indicated that the number of cells (size) in escargot overexpression clones were not significantly (n.s.) different from that in control (w1118 MARCM tub-Gal4) clones, while clones with depleted escargot were significantly different from those in control as assessed using ANOVA. P-values and number of clones scored are indicated in the corresponding bars.
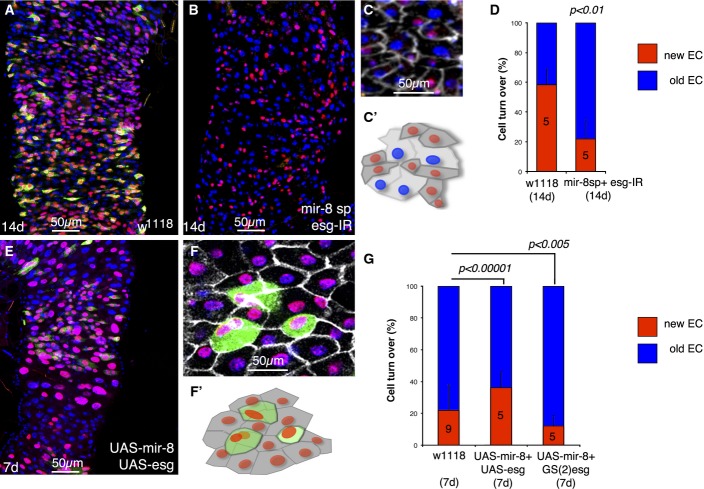
Control wild-type midgut 14 days after the temperature shift.
Illustrative example of a midgut of 14 days with depleted mir-8 and escargot simultaneously (esgReDDM > mir-8-sp+esg-IR). Note that after 2 weeks, the pool of esg+ cells is completely depleted and no further renewal could be done.
Dlg-1 staining (grey) illustrates that cells that turned off esg+ (GFP− RFP+ cells) are integrated into the epithelium (precociously differentiated enterocytes) and scheme below (C′).
Graph shows quantification of replenishment (% of new EC, GFP− RFP+ cells) of control (w1118; esgReDDM >) and mutant esgReDDM > mir-8-sp+esg-IR midguts at the indicated time point. Error bars represent SD.
Co-overexpression of mir-8 and escargot (esgReDDM > UAS-mir-8+UAS-esg) rescued in part the premature terminal differentiation, and after 7 days, esg+ undifferentiated cells are still seen.
Dlg-1 staining (grey) in UAS-mir-8+UAS-esg midgut. Note the large size and rounded shaped of esg+ (GFP+) cells. (F′) is a scheme of (F).
Graph shows quantification of the indicated genotypes at the indicated time point. The number of guts (n) scored is indicated in the graphs and statistical significance using ANOVA are shown. In the esgReDDM > UAS-mir-8+GS(2)esg genotype, most esg+ cells failed to terminally differentiate, further reflecting the phenotype involves a balance between miR-8 and escargot. Shown are representative images.
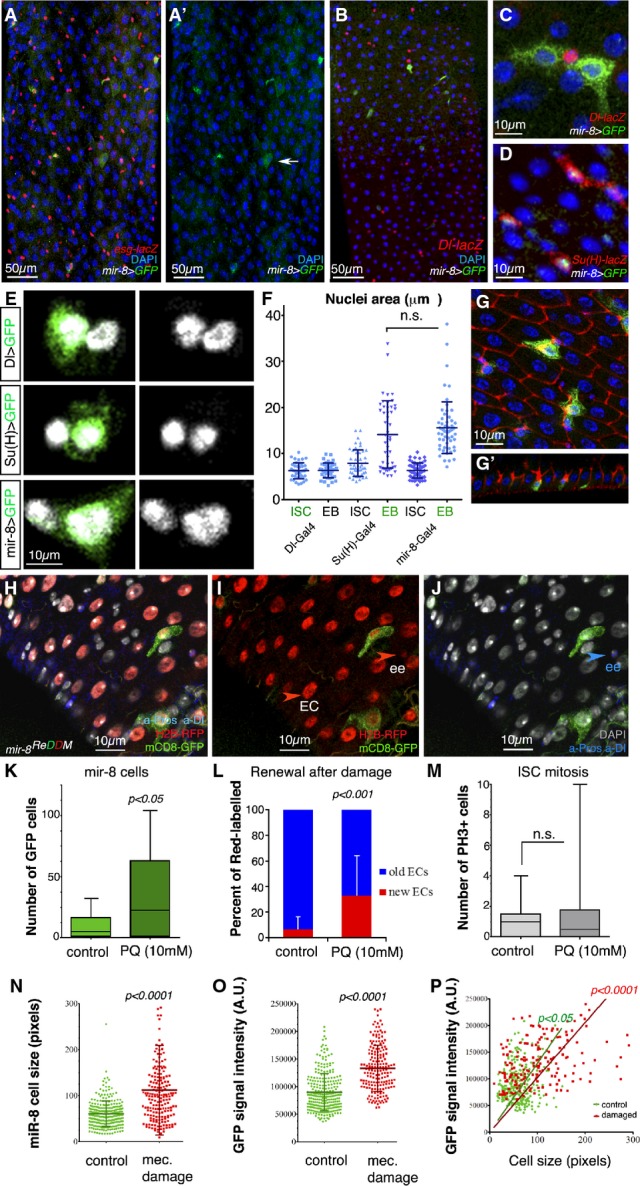
A–D Representative confocal images and single-channel image (A′) of an adult mir-8-Gal4 enhancer trap midgut stained with antibodies against GFP and esg-lacZ (A), the ISC marker Dl-lacZ (B, C) and the enteroblast marker Su(H)-lacZ (D). Note that in (D) GFP is nuclear (mir-8 > GFPnls GBE-Su(h)-lacZ).
E mir-8+ cells are late-stage enteroblasts (as deduced by their large polyploid nuclei).
F Histogram of the quantification of the nuclear size (μm2) of DAPI-stained GFP+ cells driven by the indicated Gal4 lines and that of neighbouring non-GFP cells. The data are represented as the mean ± SD. There are no statistically significant differences in GFP and non-GFP labelled cells in Dl-Gal4 and GBE-Su(H)-Gal4 midguts (t-test, n = 45 and 47 for each genotype).
G Tangential confocal sections show that mir-8+ enteroblasts (green) are integrating into the epithelium (outlined by Dlg-1, in red, and note Dlg-1 accumulation).
H–J Lineage tracing of mir-8-Gal4 enteroblasts using ReDDM shows that both enterocytes and enteroendocrine cells (ee: red-retaining, Pros+) are derived from mir-8+ progenitor cells. Old ee cells are detected as Pros-positive cells (nuclear staining). DAPI staining in grey, while cytoplasmic Dl staining marks ISCs (white arrowhead).
K, L (K) Histogram of number of mir-8+ cells in midguts after 4 h of Paraquat (PQ)-ingestion and sibling control and (L) quantification of ratio of cell turnover (red-only cells/old cells (DAPI) in the same midguts as (K) (n = 13 and 12 WT and damaged midguts scored, respectively). Error bars represent SD.
M Quantification of mitotic ISCs assessed by labelling with PH3 (n = 13 and 12 of each condition). Error bars represent SD.
N, O Scatter dot plots showing average cell size (n) and average pixel (GFP) intensity signal (O: mean value per cell, arbitrary units, A.U.) with population mean and standard deviation. Number of cells counted, n = 280 in wild-type guts, and n = 188 in damaged guts.
P Linear regression analysis of GFP signal and cell size from the same data as in (N, O). Best fitting line with (0;0) origin is shown for both populations.
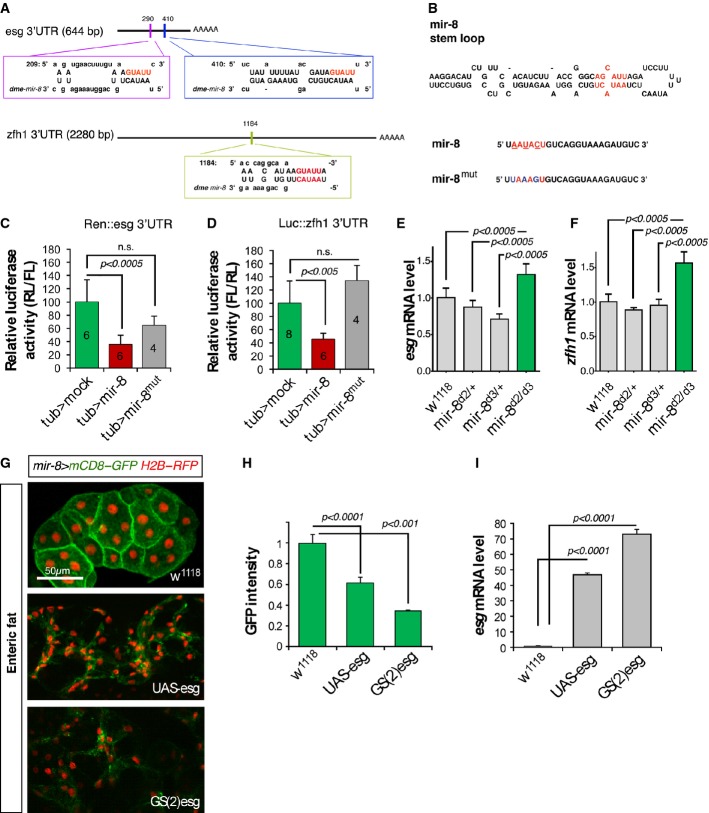
A Schematic drawing of the 3′UTR regions of escargot and zfh1/zeb genes highlighting the mir-8 seed sites and that of the microRNA miR-8.
B Schematic mir-8 pri-miRNA structure and the mutated sites (below).
C, D Luciferase assay in Drosophila Schneider (S2) cells co-transfected with the empty vector (green bars), tub > mir-8 (red bars) or the mutated version of the microRNA tub > mir-8mut (grey bars) together with a sensors containing the escargot 3′UTR (Hartl et al, 2011) (C) or zfh1 3′UTR (D). Firefly luciferase activity was measured 48 h after transfection and normalized against Renilla luciferase. The values represent the mean ± SD, and the biological repeats of empty vector, mir-8, and mir-8mut, respectively, are indicated in the bars.
E, F Differences in escargot and zfh1 and mRNA expression assessed by real-time qPCR in animals null for mir-8. Values represent the mean ± SD of three independent repeats and n = 40 animals in each condition and P < 0.0005 (Student’s t-test).
G mir-8 is expressed in adult fat polyploid cells surrounding the midgut (enteric fat cells: green staining).
H, I Overexpression of escargot using the UAS-esg and GS(2)esg in enteric fat cells converted epithelial fat cells into spindle-shaped cells. (H) Quantification of GFP (mir-8 > mCD8-GFP) intensity measured as mean pixel value and expressed as fold change to control. (I) Real-time quantitative PCR of escargot mRNA levels driven by two different transgenes (UAS-esg and GS(2)esg) and measured after 1-h heat shock in hsp70-Gal4 animals with or without the indicated transgenes. Error bars represent SD.
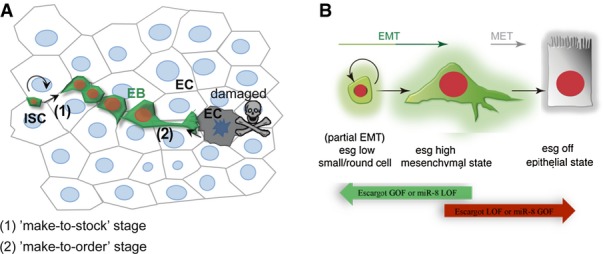
ISCs divide regularly (“make-to-stock”) and progenitor cells are flexible in delaying their terminal differentiation until detecting a local demand to replace an older or dying epithelial cell. Mechanical input or a chemical signal from the dying cell communicates its state to the neighbouring mesenchymal/progenitor cells that activates mir-8 expression (“make-to-order” stage).
The balance between escargot (and zfh1) and miR-8 triggers the mesenchymal-to-epithelial transition (MET) and terminal differentiation to replace a lost enterocyte or enteroendocrine cell.
References
-
- Allena R. Cell migration with multiple pseudopodia: temporal and spatial sensing models. Bull Math Biol. 2013;75:288–316. - PubMed
Publication types
MeSH terms
Substances
LinkOut - more resources
Full Text Sources
Other Literature Sources
Medical
Molecular Biology Databases
Research Materials
Miscellaneous
