. 2016 May;75(5):1967-77.
doi: 10.1002/mrm.25793. Epub 2015 Jun 16.

Optimal acquisition and modeling parameters for accurate assessment of low Ktrans blood-brain barrier permeability using dynamic contrast-enhanced MRI

Affiliations

Optimal acquisition and modeling parameters for accurate assessment of low Ktrans blood-brain barrier permeability using dynamic contrast-enhanced MRI

Samuel R Barnes et al. Magn Reson Med. 2016 May.

Abstract

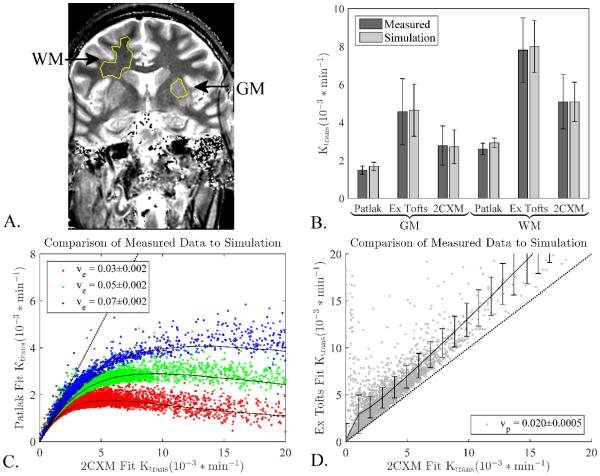
Purpose: To determine optimal parameters for acquisition and processing of dynamic contrast-enhanced MRI (DCE-MRI) to detect small changes in near normal low blood-brain barrier (BBB) permeability.

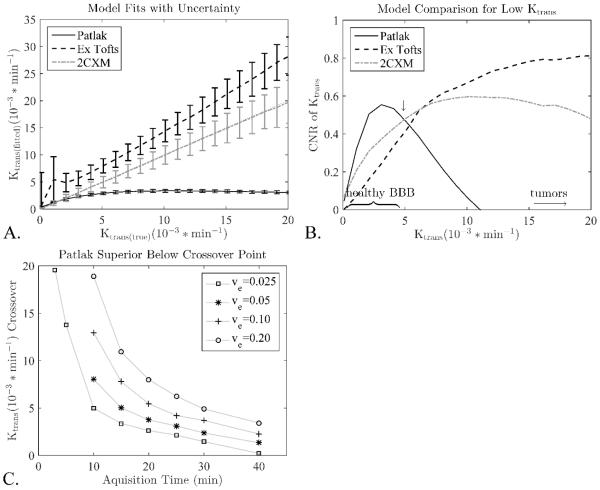
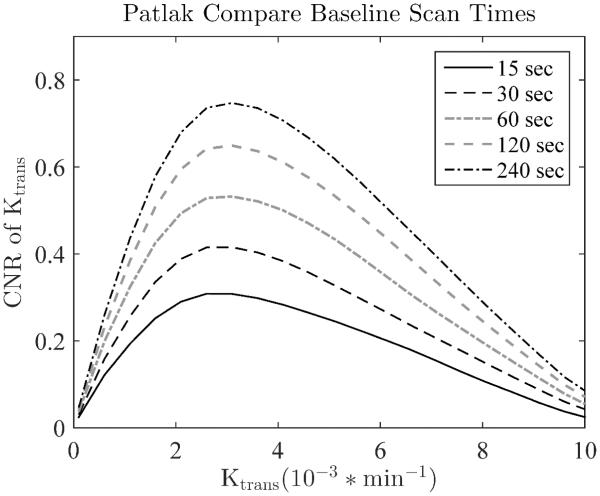
Methods: Using a contrast-to-noise ratio metric (K-CNR) for Ktrans precision and accuracy, the effects of kinetic model selection, scan duration, temporal resolution, signal drift, and length of baseline on the estimation of low permeability values was evaluated with simulations.

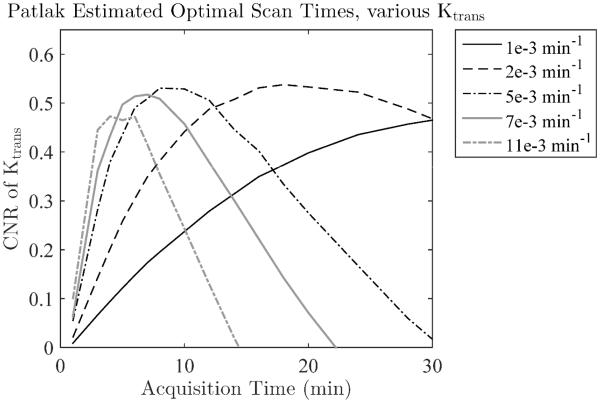
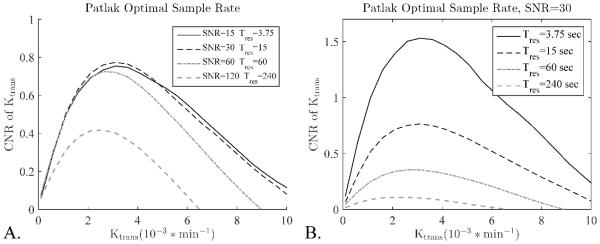
Results: The Patlak model was shown to give the highest K-CNR at low Ktrans . The Ktrans transition point, above which other models yielded superior results, was highly dependent on scan duration and tissue extravascular extracellular volume fraction (ve ). The highest K-CNR for low Ktrans was obtained when Patlak model analysis was combined with long scan times (10-30 min), modest temporal resolution (<60 s/image), and long baseline scans (1-4 min). Signal drift as low as 3% was shown to affect the accuracy of Ktrans estimation with Patlak analysis.

Conclusion: DCE acquisition and modeling parameters are interdependent and should be optimized together for the tissue being imaged. Appropriately optimized protocols can detect even the subtlest changes in BBB integrity and may be used to probe the earliest changes in neurodegenerative diseases such as Alzheimer's disease and multiple sclerosis.

Keywords: DCE-MRI; Ktrans estimation; blood-brain barrier; parameter optimization; permeability.


Figures

Figure 1
Figure 1
Simulation results compared to collected data in healthy controls. A) Typical ROIs for a single subject. B) Mean values and standard deviations of measured Ktrans values from GM and WM regions defined in the subjects correspond well to simulated results. Simulated curves were generated and all three models were fit to the simulated data to ensure that the population AIF and generating procedures would give values and noise characteristics similar to the measured data. The similar results for each model show that the simulated curves are representative of the real data. C) Each dot represents a voxel from a healthy control and the black lines are simulation results using the central ve value measured from the clinical data, error bars on simulation results excluded for clarity. D) Same as C, but comparing extended Tofts to 2XCM and using the central vp value measured from the clinical data. Error bars are the standard deviation. The measured voxels follow the simulation results extremely well showing the simulations captures the different behavior of each model. Dotted line indicates slope of unity, i.e. where Patlak or extended Tofts fit is identical to 2CXM fit.
Figure 2
Figure 2
The much lower variance in the Patlak model leads to significantly better K-CNR values compared to the extended Tofts and 2CXM models at low Ktrans. At higher Ktrans significant backflux starts to flatten the Patlak response leading to a loss of contrast and lower CNR values. A) Median fits and standard deviations for the different models, This plot was used to calculate the K-CNR values. B) For a scan time of 15 minutes and a ve=0.05 this crossover occurs around Ktrans=5*10−3/min (arrow). C) Different scans times and ve values lead to different cross over points, below which Patlak outperforms 2CXM model. For clarity only the crossover points for the 2CXM model are shown, the extended Tofts are almost identical.
Figure 3
Figure 3
The optimal scan time depends on the Ktrans value for the Patlak model, as long scan times and high Ktrans will lead to significant backflux and poor results. Scanning longer than 15 minutes is only beneficial for the very lowest Ktrans values, and longer than 5 minutes leads to sharp drops in the K-CNR of Ktrans > 10*10−3/min.
Figure 4
Figure 4
The effect of sampling rate on K-CNR for the Patlak model depends on the effect adjusting the sampling interval has on the SNR of the scan, two different scenarios are considered. A) Lengthened sampling interval increases the SNR, as would happen by adding averages or increasing the matrix size and field of view together. Only small differences are seen between sampling intervals shorter than 60 seconds, while sampling intervals longer than 60 seconds lead to significant K-CNR loss. B) Changing the sampling interval has no effect on SNR (SNR is held constant), as would happen by adding or removing slices in a 2D scan. In this case longer sampling intervals lead to a consistent and significant decrease in the K-CNR.
Figure 5
Figure 5
The concentration curves for both the AIF and tissue are calculated relative to the baseline images collected before CA injection. Thus increasing the number of baseline images, and therefore baseline SNR, increases the SNR of all calculated values. This is probably the most efficient way to increase the SNR and CNR of the entire DCE study. Temporal resolutions was 15 sec.
Figure 6
Figure 6
Drift correction improves precision for inter-study comparison. Patlak is especially sensitive to drift as its lower contrast makes it more sensitive to any increase in variance. Unlike the other variables considered here, signal drift is not a parameter than can be easily controlled or defined a priori. However, it can be largely corrected for using an intensity standard, a small tube of water placed in the FOV whose signal can be used to estimate and remove the drift.

References

    1. Chassidim Y, Veksler R, Lublinsky S, Pell GS, Friedman A, Shelef I. Quantitative imaging assessment of blood-brain barrier permeability in humans. Fluids and barriers of the CNS. 2013;10(1):9. - PMC - PubMed
    1. Parker GJ, Padhani AR. T1-W DCE-MRI: T1-Weighted Dynamic Contrast-Enhanced MRI. Quantitative MRI of the Brain: Measuring Changes Caused by Disease. 2004:341–364.
    1. Hylton N. Dynamic contrast-enhanced magnetic resonance imaging as an imaging biomarker. Journal of clinical oncology. 2006;24(20):3293–3298. - PubMed
    1. Seevinck PR, Deddens LH, Dijkhuizen RM. Magnetic resonance imaging of brain angiogenesis after stroke. Angiogenesis. 2010;13(2):101–111. - PMC - PubMed
    1. O'Connor JP, Jackson A, Parker GJ, Jayson GC. DCE-MRI biomarkers in the clinical evaluation of antiangiogenic and vascular disrupting agents. British journal of cancer. 2007;96(2):189–195. - PMC - PubMed

Publication types

MeSH terms