. 2015 Jun 29;212(7):1011-20.
doi: 10.1084/jem.20141827. Epub 2015 Jun 15.

The lysophosphatidylserine receptor GPR174 constrains regulatory T cell development and function

Affiliations

The lysophosphatidylserine receptor GPR174 constrains regulatory T cell development and function

Michael J Barnes et al. J Exp Med. .

Abstract

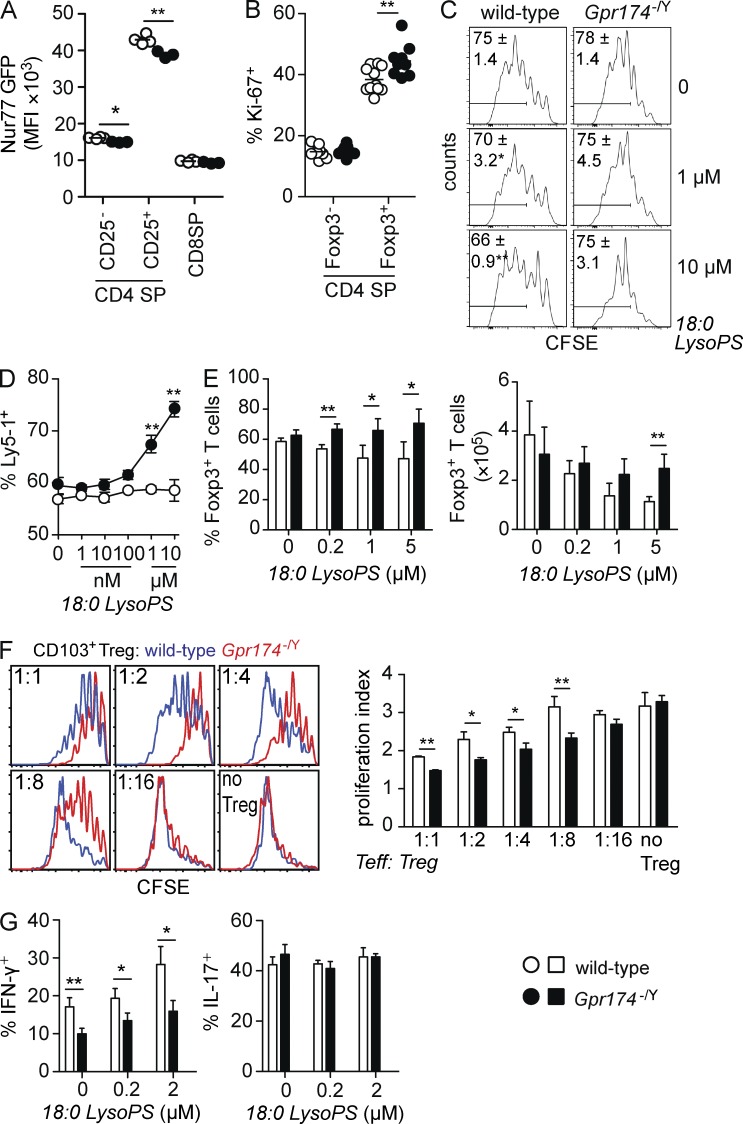
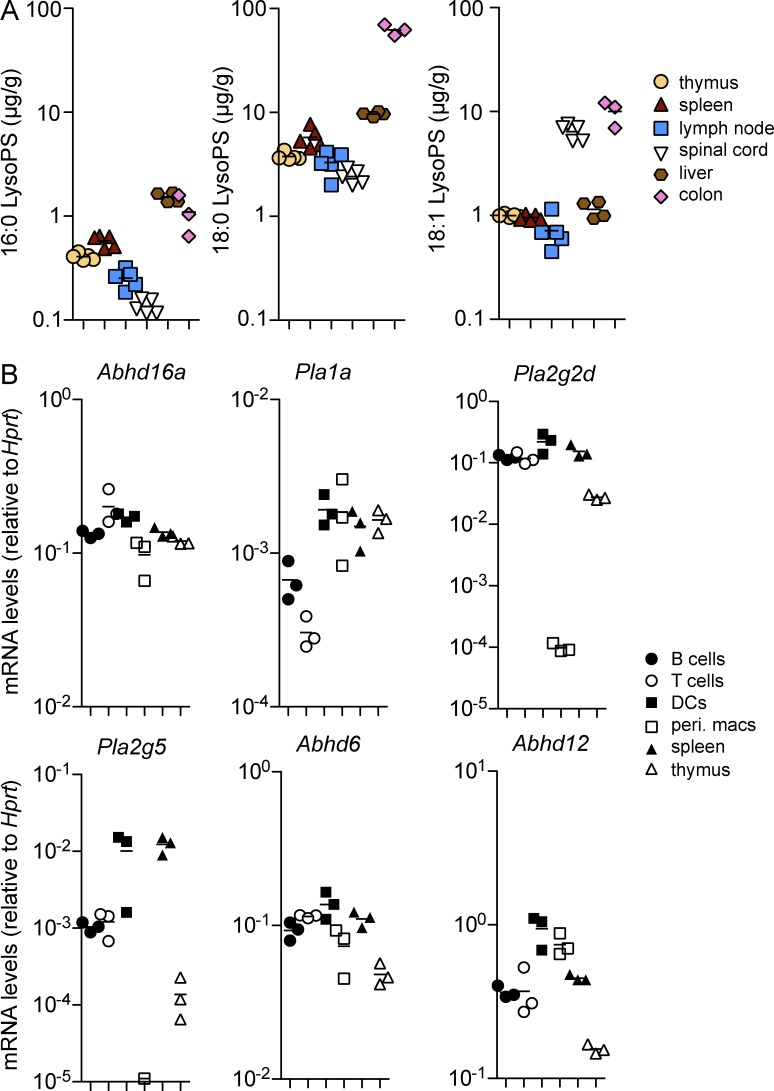
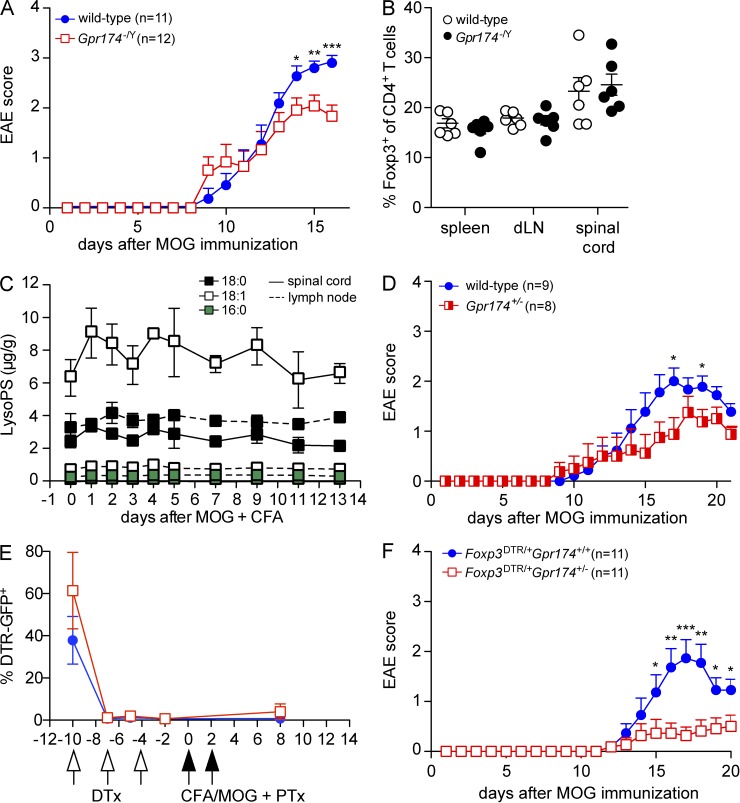
Regulatory T cell (T reg cell) numbers and activities are tightly calibrated to maintain immune homeostasis, but the mechanisms involved are incompletely defined. Here, we report that the lysophosphatidylserine (LysoPS) receptor GPR174 is abundantly expressed in developing and mature T reg cells. In mice that lacked this X-linked gene, T reg cell generation in the thymus was intrinsically favored, and a higher fraction of peripheral T reg cells expressed CD103. LysoPS could act in vitro via GPR174 to suppress T cell proliferation and T reg cell generation. In vivo, LysoPS was detected in lymphoid organ and spinal cord tissues and was abundant in the colon. Gpr174(-/Y) mice were less susceptible to experimental autoimmune encephalomyelitis than wild-type mice, and GPR174 deficiency in T reg cells contributed to this phenotype. This study provides evidence that a bioactive lipid, LysoPS, negatively influences T reg cell accumulation and activity through GPR174. As such, GPR174 antagonists might have therapeutic potential for promoting immune regulation in the context of autoimmune disease.


Figures

Figure 1.
Figure 1.
Elevated expression of transcripts encoding GPR174 and other LysoPS receptors in T reg cells. (A) Diagram of the construct used to target the Gpr174 locus by homologous recombination. For more details, see Materials and methods. (B and C) Measurement of dTomato-GPR174 reporter allele expression in thymocytes (left) or splenocytes (right) by flow cytometry from 8-wk-old male Gpr174−/Y mice. (B) Thymocyte populations are as follows: gray shaded, CD4+CD8+ DP; blue dashed, CD8+ SP; purple dotted, CD25 CD4 SP; and red, CD25+ CD4 SP T reg cells. Splenocyte populations are as follows: gray shaded, background (splenocytes from wild-type mice); blue dashed, naive CD8+ T cells; purple dotted, CD25 naive CD4+ T cells; and red, CD25+CD4+ T reg cells. (C) The mean fluorescence intensity (MFI) of dTomato-GPR174 is shown for the indicated cell populations. B cells were identified as B220+IgDhigh splenocytes. Each dot represents a measurement from a separate mouse; n = 4. (D) Expression of dTomato-GPR174 was measured in naive CD4+ T cells cultured under Th0, Th1, or Th17 polarizing conditions for 5 d; representative flow cytometry data are shown. (E) The mRNA expression levels of the LysoPS receptors Gpr174, Gpr34, P2ry10, and P2ry10-L were measured by RT-PCR in the indicated sorted thymocyte and splenocyte populations from 8-wk-old wild-type mice. Populations were gated as described in Materials and methods. Cells were sorted in triplicate, and each dot represents the relative expression in a separate sorted cell population from a distinct mouse; n = 3; error bars show SD. All data in B–E are representative of at least three independent assays.
Figure 2.
Figure 2.
GPR174 intrinsically constrains T reg cell accumulation and CD103 expression. (A) Flow cytometry analysis of the percentage of dTomato+ cells in CD25 and CD25+ CD4 SP T reg thymocytes in Gpr174+/− female mice. Lines link measurements of populations from the same mouse; n = 8. (B and C) Flow cytometry analysis of the frequency of Foxp3+ CD4 SP or CD4+ T cells in 8-wk-old wild-type and Gpr174−/Y littermate male mice (B) and of the percentage of Foxp3+ CD4 SP or CD4+ T cells that express CD103 (surface) or Helios (intracellular; C); n = 7 or 9. Horizontal lines indicate the mean. (D) Flow cytometry analysis of mice reconstituted with mixed wild-type and Gpr174−/Y bone marrow. Lethally irradiated Ly5-2 mice (CD45.1+) were reconstituted with a mixture of bone marrow from wild-type Ly5-1/-2 F1 (CD45.1+CD45.2+) and Gpr174−/Y (Ly5-1, CD45.2+) mice. Radioresistant cells (Ly5-2, CD45.1+) were excluded, and the contribution of Gpr174−/Y-derived cells (Ly5-1) to the indicated cell subsets is shown; n = 4; error bars show SD. (E) The contribution of Gpr174−/Y-derived cells to the CD103+ T reg cell population is shown for mice reconstituted as in D, or with mixed bone marrow from wild-type Ly5-1/-2 F1 (CD45.1+CD45.2+) and wild-type mice (Ly5-1, CD45.2+) mice; n = 4. All data are representative of at least three independent experiments and were evaluated using paired (A, E) or unpaired (B–D) Student’s t test: *, P < 0.05; **, P < 0.01; ***, P < 0.001.
Figure 3.
Figure 3.
CD4+ T cells show diminished Nur77 levels and enhanced proliferation in Gpr174−/Y mice. (A) Flow cytometry analysis of the mean fluorescence intensity (MFI) of Nur77-GFP expression in thymocytes from 6-wk-old wild-type and Gpr174−/Y Nur77-GFP+ littermate male mice. Each dot represents an individual mouse; n = 4. (B) Intracellular levels of Ki-67 expression in the indicated thymocyte populations from 6-wk-old wild-type and Gpr174−/Y littermate male mice were determined using flow cytometry. The percentage of Ki-67+ cells among Foxp3+ T reg and Foxp3 CD4 SP thymocytes is shown; n = 9 or 10. (A and B) Horizontal lines indicate the mean. (C) The effects of LysoPS on T cell proliferation under neutral conditions. CFSE-labeled LN cells from wild-type or Gpr174−/Y mice were cultured in round-bottom plates with 0.25 µg/ml soluble anti-CD3 and the indicated amounts of LysoPS. Cell proliferation was assessed 3 d later based on CFSE dilution that was measured by flow cytometry; live CD4+TCR-β+ T cells are shown. Gates indicate the percentage of cells that divided at least three times, and means ± SD are shown; n = 4. (D and E) Direct effects of GPR174 and its ligand LysoPS on proliferation and Foxp3 induction. In flat 96-well plates coated with anti-CD3 and anti-CD28 mAbs (both 2 µg/ml), a mixture of either wild-type (Ly5-1+) or Gpr174−/Y (Ly5-1+) with congenic wild-type (Ly5-2+) naive CD4+ T cells (D) or either wild-type or Gpr174−/Y naive CD4+ T cells (E) were added. Cells were cultured in the presence of 200 U/ml IL-2 (D) or 1 ng/ml TGF-β (E) and the indicated concentrations of 18:0 LysoPS for 4 d. Expression of Ly5-1 and Ly5-2 (D) or Foxp3 (E) was measured by flow cytometry; n = 4; error bars indicate SD. Counts were quantified based on the number of events acquired on a flow cytometer run for 60 s per sample (E). Cells used in E were isolated from mixed bone marrow chimeric mice to minimize extrinsic effects on naive T cells. (F) In an in vitro T reg cell suppressor assay, CD4+CD25+CD45RBhighCD103 T reg cells were sorted from spleens of wild-type and Gpr174−/Y littermate mice. T reg cells were cultured at the indicated ratios with 105 CFSE-labeled naive CD45.1+CD4+ T cells and 2 × 10⁴ CD11c-enriched DCs in the presence of 0.5 µg/ml soluble anti-CD3ε mAb for 3 d. The proliferation index of CFSE-labeled cells was determined in triplicate cultures, and representative CFSE flow cytometry plots are shown. (G) A total of 2 × 10⁵ naive CD4+ T cells from CD45.2+ wild-type or Gpr174−/Y littermate mice were cultured along with an equivalent number of cells from CD45.1+ wild-type mice under Th1 or Th17 polarizing conditions for 5 d. After restimulation with PMA and ionomycin, the percentage of CD45.2+ cells that secreted IFN-γ or IL-17 was determined by intracellular cytokine staining and flow cytometry analysis. (F and G) Error bars show SD. Data were evaluated by unpaired Student’s t test: *, P < 0.05; **, P < 0.01. All data are representative of three or more independent experiments.
Figure 4.
Figure 4.
LysoPS is abundant in lymphoid tissues and can be generated by various immune cell types. (A) Concentrations of 16:0, 18:0, and 18:1 LysoPS were measured under homeostatic conditions in the indicated tissues using LC-MS/MS. (B) Transcript levels of LysoPS synthetic and metabolic enzymes were measured by quantitative RT-PCR in the indicated cell populations and tissues. In both panels, each dot represents a separate mouse; n = 3–5. (A and B) Horizontal lines indicate the mean.
Figure 5.
Figure 5.
GPR174 deficiency in T reg cells limits the severity of EAE. (A) EAE was induced in 10-wk-old male wild-type or Gpr174−/Y littermate mice by injecting a MOG35–55 + CFA emulsion (s.c.) followed by pertussis toxin (i.v.). Mice were scored daily for disease symptoms; mean disease scores are shown and error bars indicate SEM. (B) The frequency of Foxp3+ T reg cells among total CD4+ T cells was determined in the indicated tissues 12 d after EAE induction in 10-wk-old male wild-type or Gpr174−/Y littermate mice by flow cytometry. (C) EAE was induced in a cohort of wild-type mice, and levels of LysoPS were measured by LC-MS/MS in the inguinal LN that drained the MOG + CFA emulsion (dotted lines) and in the spinal cord (solid lines) throughout the course of disease; n = 3–5. (B and C) Error bars show SD. (D) EAE was induced in 10-wk-old female Gpr174+/− or wild-type littermate mice as in A; error bars show SEM. (E and F) In Gpr174+/− or wild-type female mice heterozygous for an X-linked Foxp3-DTR allele, diphtheria toxin (DTx) was injected on days −10, −7, and −4. EAE was induced as in A on day 0. The ablation efficiency was assessed by analyzing the frequency of DTR-GFP+ cells among blood CD4+CD25+ T reg cells at the indicated time points (E); error bars show SD. Disease was scored daily after MOG immunization (F); n = 11; error bars show SEM. Data are representative of two (E and F) or three or more (A–D) independent experiments. Differences between groups were compared using unpaired Student’s t test for each time point: *, P < 0.05; **, P < 0.01; ***, P < 0.001.

References

    1. Bellini F., and Bruni A.. 1993. Role of a serum phospholipase A1 in the phosphatidylserine-induced T cell inhibition. FEBS Lett. 316:1–4. 10.1016/0014-5793(93)81724-E - DOI - PubMed
    1. Blankman J.L., Long J.Z., Trauger S.A., Siuzdak G., and Cravatt B.F.. 2013. ABHD12 controls brain lysophosphatidylserine pathways that are deregulated in a murine model of the neurodegenerative disease PHARC. Proc. Natl. Acad. Sci. USA. 110:1500–1505. 10.1073/pnas.1217121110 - DOI - PMC - PubMed
    1. Bollrath J., and Powrie F.M.. 2013. Controlling the frontier: regulatory T-cells and intestinal homeostasis. Semin. Immunol. 25:352–357. 10.1016/j.smim.2013.09.002 - DOI - PubMed
    1. Campbell D.J., and Koch M.A.. 2011. Phenotypical and functional specialization of FOXP3+ regulatory T cells. Nat. Rev. Immunol. 11:119–130. 10.1038/nri2916 - DOI - PMC - PubMed
    1. Chu X., Shen M., Xie F., Miao X.J., Shou W.H., Liu L., Yang P.P., Bai Y.N., Zhang K.Y., Yang L., et al. 2013. An X chromosome-wide association analysis identifies variants in GPR174 as a risk factor for Graves’ disease. J. Med. Genet. 50:479–485. 10.1136/jmedgenet-2013-101595 - DOI - PMC - PubMed

Publication types

MeSH terms