. 2015:2015:976848.
doi: 10.1155/2015/976848. Epub 2015 May 11.

Hydrogen Sulfide Prevents Advanced Glycation End-Products Induced Activation of the Epithelial Sodium Channel

Affiliations

Hydrogen Sulfide Prevents Advanced Glycation End-Products Induced Activation of the Epithelial Sodium Channel

Qiushi Wang et al. Oxid Med Cell Longev. 2015.

Abstract

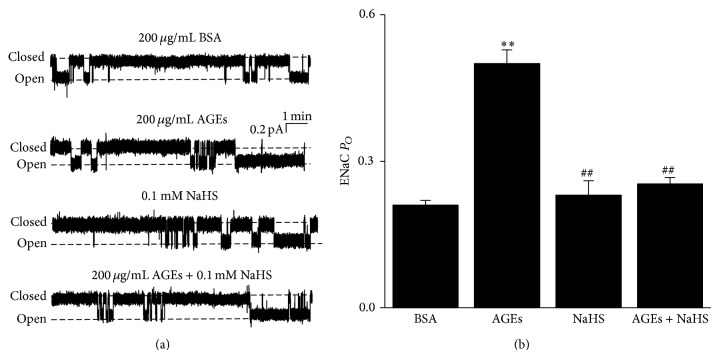
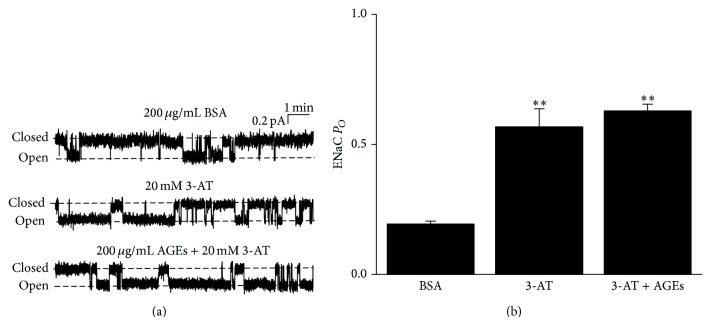
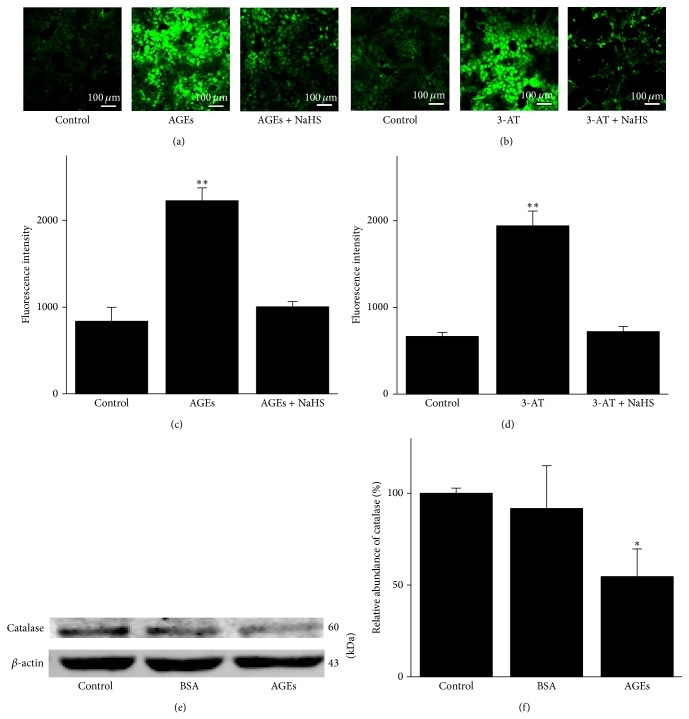
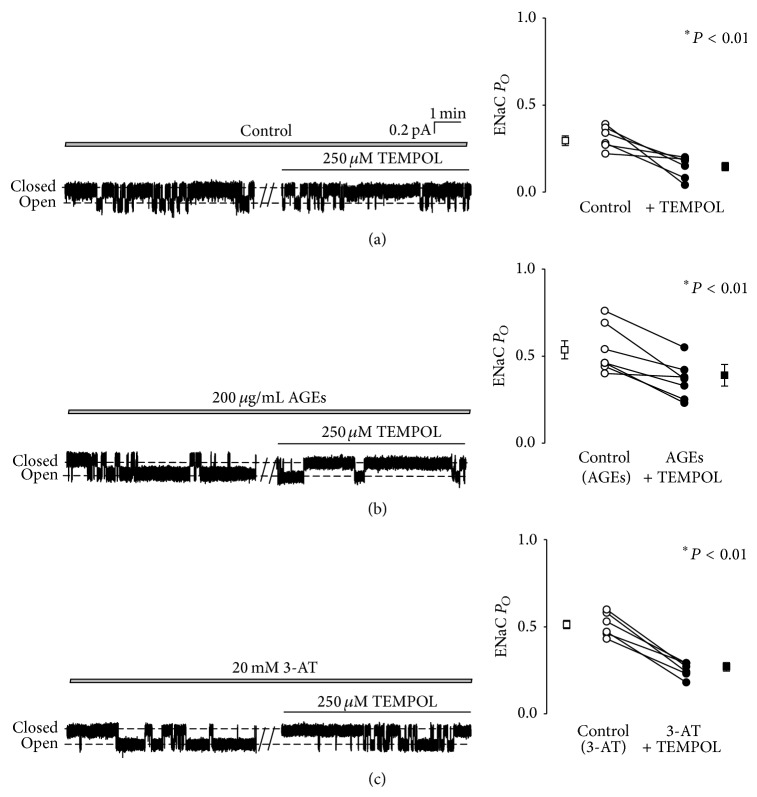
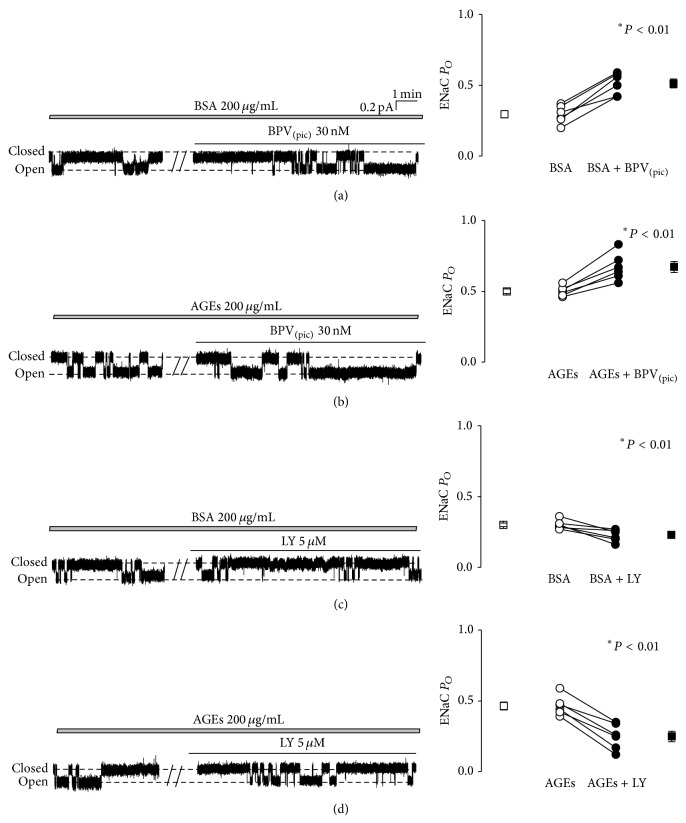
Advanced glycation end-products (AGEs) are complex and heterogeneous compounds implicated in diabetes. Sodium reabsorption through the epithelial sodium channel (ENaC) at the distal nephron plays an important role in diabetic hypertension. Here, we report that H2S antagonizes AGEs-induced ENaC activation in A6 cells. ENaC open probability (P O ) in A6 cells was significantly increased by exogenous AGEs and that this AGEs-induced ENaC activity was abolished by NaHS (a donor of H2S) and TEMPOL. Incubating A6 cells with the catalase inhibitor 3-aminotriazole (3-AT) mimicked the effects of AGEs on ENaC activity, but did not induce any additive effect. We found that the expression levels of catalase were significantly reduced by AGEs and both AGEs and 3-AT facilitated ROS uptake in A6 cells, which were significantly inhibited by NaHS. The specific PTEN and PI3K inhibitors, BPV(pic) and LY294002, influence ENaC activity in AGEs-pretreated A6 cells. Moreover, after removal of AGEs from AGEs-pretreated A6 cells for 72 hours, ENaC P O remained at a high level, suggesting that an AGEs-related "metabolic memory" may be involved in sodium homeostasis. Our data, for the first time, show that H2S prevents AGEs-induced ENaC activation by targeting the ROS/PI3K/PTEN pathway.


Figures

Figure 1
Figure 1
AGEs-induced activation of ENaC is reversed by 0.1 mM NaHS in A6 cells. (a) The representative ENaC single-channel current recorded from A6 cells, respectively, treated with basolateral 200 μg/mL BSA (control; top trace), basolateral 200 μg/mL AGEs, apical 0.1 mM NaHS, and basolateral 200 μg/mL AGEs + apical 0.1 mM NaHS (bottom trace) for 24 h. (b) Summary plot shows that AGEs treatment significantly increased ENaC P O, which was reversed by H2S treatment (n = 10 for each individual experimental set; ∗∗ indicates P < 0.01 compared to control; ## indicates P < 0.01 compared to AGEs treated cells).
Figure 2
Figure 2
3-Aminotriazole (3-AT) mimics the effect of AGEs on ENaC P O. (a) The representative single-channel currents of ENaC recorded under control conditions (basolateral 200 μg/mL BSA for 24 h; top), after apical 20 mM 3-AT treatment for 30 min (middle), or after 24 h AGE treatment followed by treatment with apical 20 mM 3-AT for 30 min (bottom). (b) Summary plots show that ENaC P O was significantly, respectively, increased after 20 mM 3-AT treatment (n = 10 for control and n = 9 for 3-AT group; ∗∗ indicates P < 0.01 compared to control). Addition of 3-AT to AGEs did not further increase ENaC P O compared to 3-AT alone (n = 9 for AGEs + 3-AT group; P > 0.05).
Figure 3
Figure 3
H2S ameliorates AGE- or 3-AT-elicited oxidative stress and AGEs reduce catalase expression in A6 cells. (a) The left image shows that there was a residual level of intracellular ROS under control condition; the middle image shows a significant increase in intracellular ROS upon application of basolateral 200 μg/mL AGEs; the right image shows that the AGE-induced increase in intracellular ROS was abolished by 0.1 mM NaHS treatment. (b) The left image shows that there was a residual level of intracellular ROS under control conditions; the middle image shows a significant increase in intracellular ROS upon application of apical 20 mM 3-AT; the right image shows that the 3-AT-induced increase in intracellular ROS was also abolished by 0.1 mM NaHS treatment. (c) and (d) Summarized bar graphs show the mean fluorescence intensities under indicated experimental conditions (n = 7 for each experimental condition; ∗∗ indicates P < 0.01 compared to control). (e) and (f) Western blot demonstrating that expression levels of catalase were suppressed by AGEs (n = 6, ∗ represents P < 0.05 compared to control).
Figure 4
Figure 4
TEMPOL abolishes the effects of AGEs and 3-AT on ENaC activity. (a) ROS extraction by 250 μM TEMPOL significantly decreased ENaC P O (n = 6 paired experiments; ∗ represents P < 0.01). (b) and (c) TEMPOL significantly reduced ENaC activity in cells pretreated with 200 μg/mL AGEs (b) or in the cells pretreated with 20 mM 3-AT (c) (n = 7 paired experiments; ∗ represents P < 0.01).
Figure 5
Figure 5
AGEs activate ENaC via PI3K and PTEN signaling pathways. (a) and (b) ENaC activity in A6 cells treated either with basolateral 200 μg/mL BSA or with basolateral 200 μg/mL AGEs, before and after addition of 30 nM BPV(pic) to the apical bath. (c) and (d) ENaC activity in A6 cells treated as in (a) and (b), before and after addition of 5 μM LY294002 to the apical bath; the data show that a PI3K inhibitor, LY294002, significantly inhibits ENaC activities under control condition and in the presence of AGEs. Four breaks between the traces indicate 20 min omitted recording periods. Summarized P O of ENaC before and after application of each reagent were shown on the right. n = 6 paired experiments. ∗ indicates P < 0.01.
Figure 6
Figure 6
AGEs-induced aberrant activation of ENaC in A6 cells exerts “metabolic memory.” (a) Representative ENaC single-channel currents recorded either from an A6 cell in the presence of basolateral 200 μg/mL BSA or from an A6 cell after removal of 200 μg/mL BSA for 72 h. (b) Representative ENaC single-channel currents recorded either from an A6 cell in the presence of basolateral 200 μg/mL AGEs from an A6 cell after removal of 200 μg/mL AGEs for 72 h. (c) Summarized bar graph shows that basolateral AGEs significantly increased ENaC P O and the ENaC P O remained at the same levels after removal of AGEs for 72 h (n = 7–10; ∗ and #, resp., indicate P < 0.01).

Similar articles

Cited by

References

    1. Persson F., Rossing P., Hovind P., et al. Irbesartan treatment reduces biomarkers of inflammatory activity in patients with type 2 diabetes and microalbuminuria: an IRMA 2 substudy. Diabetes. 2006;55(12):3550–3555. doi: 10.2337/db06-0827. - DOI - PubMed
    1. Portero-Otin M., Pamplona R., Bellmunt M. J., et al. Advanced glycation end product precursors impair epidermal growth factor receptor signaling. Diabetes. 2002;51(5):1535–1542. doi: 10.2337/diabetes.51.5.1535. - DOI - PubMed
    1. Sowers J. R., Epstein M., Frohlich E. D. Diabetes, hypertension, and cardiovascular disease: an update. Hypertension. 2001;37(4):1053–1059. doi: 10.1161/01.hyp.37.4.1053. - DOI - PubMed
    1. Schleicher E. D., Wagner E., Nerlich A. G. Increased accumulation of the glycoxidation product N(ε)- (carboxymethyl)lysine in human tissues in diabetes and aging. The Journal of Clinical Investigation. 1997;99(3):457–468. doi: 10.1172/jci119180. - DOI - PMC - PubMed
    1. Nathan D. M., Cleary P. A., Backlund J. Y. C., et al. Intensive diabetes treatment and cardiovascular disease in patients with type 1 diabetes. The New England Journal of Medicine. 2005;353(25):2643–2653. doi: 10.1056/nejmoa052187. - DOI - PMC - PubMed

Publication types

MeSH terms

LinkOut - more resources