. 2015 Jun 16;7(7):1871-86.
doi: 10.1093/gbe/evv111.

Characterization of Three Mycobacterium spp. with Potential Use in Bioremediation by Genome Sequencing and Comparative Genomics

Affiliations

Characterization of Three Mycobacterium spp. with Potential Use in Bioremediation by Genome Sequencing and Comparative Genomics

Sarbashis Das et al. Genome Biol Evol. .

Abstract

We provide the genome sequences of the type strains of the polychlorophenol-degrading Mycobacterium chlorophenolicum (DSM43826), the degrader of chlorinated aliphatics Mycobacterium chubuense (DSM44219) and Mycobacterium obuense (DSM44075) that has been tested for use in cancer immunotherapy. The genome sizes of M. chlorophenolicum, M. chubuense, and M. obuense are 6.93, 5.95, and 5.58 Mb with GC-contents of 68.4%, 69.2%, and 67.9%, respectively. Comparative genomic analysis revealed that 3,254 genes are common and we predicted approximately 250 genes acquired through horizontal gene transfer from different sources including proteobacteria. The data also showed that the biodegrading Mycobacterium spp. NBB4, also referred to as M. chubuense NBB4, is distantly related to the M. chubuense type strain and should be considered as a separate species, we suggest it to be named Mycobacterium ethylenense NBB4. Among different categories we identified genes with potential roles in: biodegradation of aromatic compounds and copper homeostasis. These are the first nonpathogenic Mycobacterium spp. found harboring genes involved in copper homeostasis. These findings would therefore provide insight into the role of this group of Mycobacterium spp. in bioremediation as well as the evolution of copper homeostasis within the Mycobacterium genus.

Keywords: Mycobacterium; biodegradation; copper homeostasis; genome sequencing; oxygenases.


Figures

F<sc>ig</sc>. 1.—
Fig. 1.—
Genome assemblies and annotations. (A) Barplots showing number of raw reads, read coverage, number of scaffolds, and assembly quality (N50) for the three genomes represented by different colors as indicated. (B) Bar plots represent genome size, GC-content in %, number of tRNA genes, number of CDS, number of rRNA operons and noncoding RNA (ncRNA) for the four genomes represented by different color codes. Bars marked with * indicate that these genomes contains one complete and one partial rRNA operon.
F<sc>ig</sc>. 2.—
Fig. 2.—
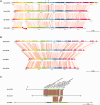
Whole genome and CDS alignment of the four genomes. (A) Whole genome alignment and (B) complete CDS alignment for the four Mycobacterium spp. as indicated. Each of the colored horizontal lines represents one genome and the vertical bars represent homologous regions. Light brown to dark vertical lines represent small to large homologous fragments and diagonal lines represent genomic rearrangements whereas red blocks below the black line which is connected with the blue diagonal lines mark inversions. (C) Gene synteny plot of the conserved small (marked with S; the large prophage sequences in MchloDSM is marked with L) prophage sequence predicted in the MchloDSM, MchuDSM, and MycNBB4. Black horizontal lines represent prophage sequences in the respective genomes. Blue and green arrows indicate predicted CDS of bacterial and phage origin, respectively. Vertical lines represent the attachment sites.
F<sc>ig</sc>. 3.—
Fig. 3.—
Venn diagram—presence of homologous and nonhomologous genes. The Venn diagram represents homologous and nonhomologous genes present in MchloDSM, MchuDSM, MobuDSM, and MycNBB4. The Venn diagram was generated as outlined in Materials and Methods and the different mycobacterial strains are color coded as indicated.
F<sc>ig</sc>. 4.—
Fig. 4.—
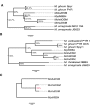
Phylogenetic analysis. Phylogenetic trees were generated based on (A) 16S rRNA complete gene sequences and (B) core genes in Mycobacterium spp., for details see main text. (C) A phylogenetic tree where we used the 3,268 homologous genes that were identified to be present in the MchloDSM, MchuDSM, MobuDSM, and MycNBB4 genomes as indicated. Bootstrap values in percentage are shown at the common nodes.
F<sc>ig</sc>. 5.—
Fig. 5.—
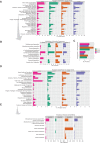
Functional classifications of total and unique genes. Bar plots representing functional classifications of genes in different categories: (A) Total predicted genes, (B) subclassification of genes that belong to the category metabolism of aromatic compounds, (C) number of genes encoding mono- and dioxygenases in the four Mycobacterium spp. as indicated, (D) unique genes in the four mycobacterial strains (MchloDSM, MchuDSM, MobuDSM, and MycNBB4), and (E) subclassification of the unique genes that belong to the category “virulence, disease, and defense.” Different colors represent different genomes as indicated. In (A) and (D) the x axis represents percentage of total genes whereas in (B), (C), and (E) the x axis corresponds to the number of genes.
F<sc>ig</sc>. 6.—
Fig. 6.—
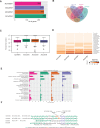
Identification and characterization of horizontally transferred genes. (A) Horizontal bar plots showing number of HGT-genes identified in the MchloDSM, MchuDSM, MobuDSM, and MycNBB4 genomes. x axis represents number of HGT-genes and y axis shows the four genomes as indicated. (B) Venn diagram showing common and unique HGT-genes. (C) Box plot showing percentage GC-content of the HGT-genes in the MchloDSM, MchuDSM, MobuDSM, and MycNBB4 genomes. y axis represents percentage GC-content. The horizontal lines represent the first (25%), second (50%), third (75%), and forth (100%) quartiles. The thick horizontal line in the middle of each colored box represents the median value and filled squares are the outliers. (D) Heat map showing the probable source of the HGT-genes (see also supplementary fig. S8A, Supplementary Material online). Color code: dark brown refers to high while light colors to fewer numbers of genes. (E) Functional classification of the HGT-genes using subsystem classifications. x axis represents number of the HGT-genes in percentage. (F) Gene synteny plot of upstream and downstream of the photosynthetic gene encoding the homologous protein proteorhodopsin (see also supplementary fig. S8C, Supplementary Material online). The left column represents the mycobacterial strain, the locus tag of the first and last genes in the gene synteny plot is represented by the prefix “MCHLDSM_,” “MCHUDSM_,” and “Mycch_” for MchloDSM, MchuDSM, and MycNBB4, respectively.
F<sc>ig</sc>. 7.—
Fig. 7.—
Functional classification of noncoding RNA (ncRNAs). Classification of noncoding RNAs in the MchloDSM, MchuDSM, MobuDSM, and MycNBB4 strains, for details see the main text.

References

    1. Adékambi T, Drancourt M. 2004. Dissection of phylogenetic relationships among 19 rapidly growing Mycobacterium species by 16S rRNA, hsp65, sodA, recA and rpoB gene sequencing. Int J Syst Evol Microbiol. 54:2095–2105. - PubMed
    1. Agustí G, Astola O, Rodríguez-Güell E, Julián E, Luquin M. 2008. Surface spreading motility shown by a group of phylogenetically related, rapidly growing pigmented mycobacteria suggests that motility is a common property of mycobacterial species but is restricted to smooth colonies. J Bacteriol. 190:6894–6902. - PMC - PubMed
    1. Apajalahti JH, Salkinoja-Salonen MS. 1987. Dechlorination and para-hydroxylation of polychlorinated phenols by Rhodococcus chlorophenolicus. J Bacteriol. 169:675–681. - PMC - PubMed
    1. Arnvig K, Young D. 2012. Non-coding RNA and its potential role in Mycobacterium tuberculosis pathogenesis. RNA Biol. 9:427–436. - PMC - PubMed
    1. Aziz RK, et al. 2008. The RAST Server: rapid annotations using subsystems technology. BMC Genomics 9:75. - PMC - PubMed

Publication types

Associated data