. 2015 Jun 30;112(26):E3345-54.
doi: 10.1073/pnas.1423357112. Epub 2015 Jun 15.

Epidermal TRPM8 channel isoform controls the balance between keratinocyte proliferation and differentiation in a cold-dependent manner

Affiliations

Epidermal TRPM8 channel isoform controls the balance between keratinocyte proliferation and differentiation in a cold-dependent manner

Gabriel Bidaux et al. Proc Natl Acad Sci U S A. .

Abstract

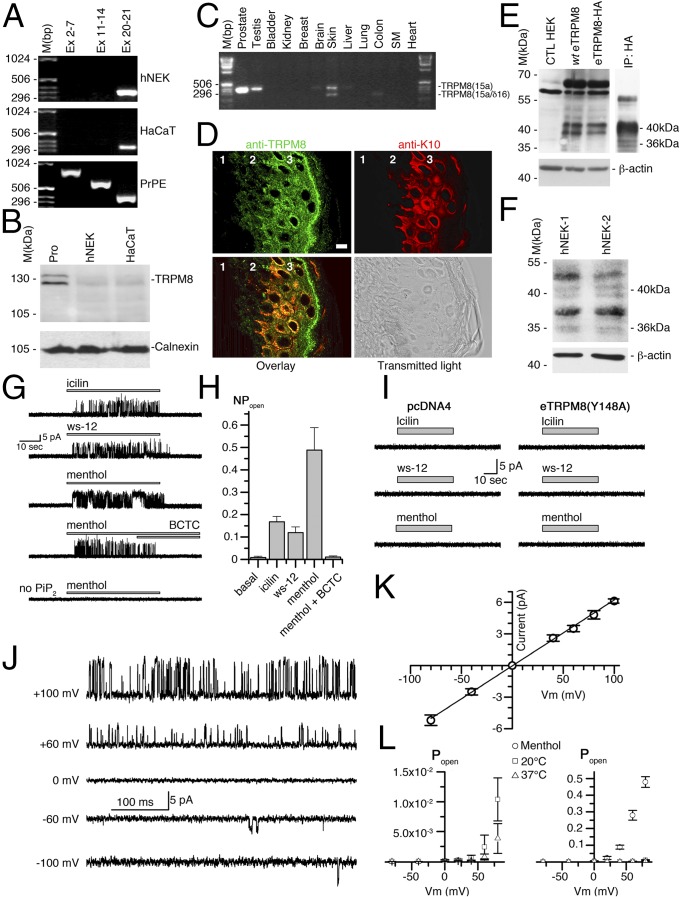
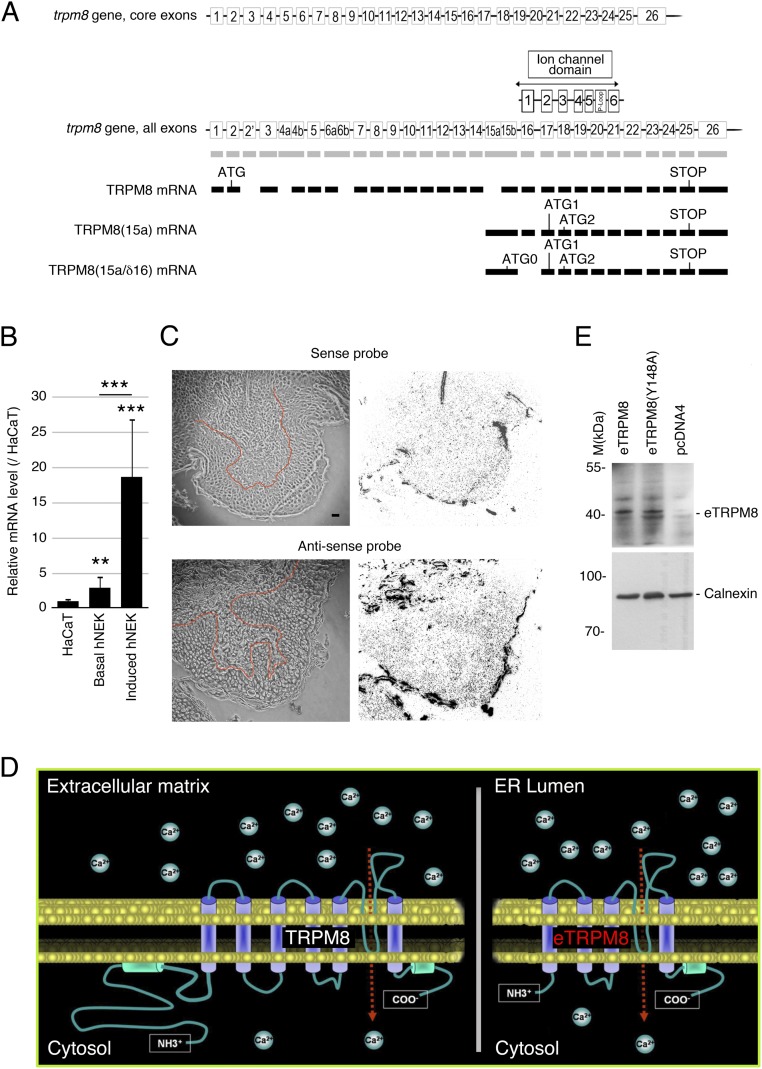
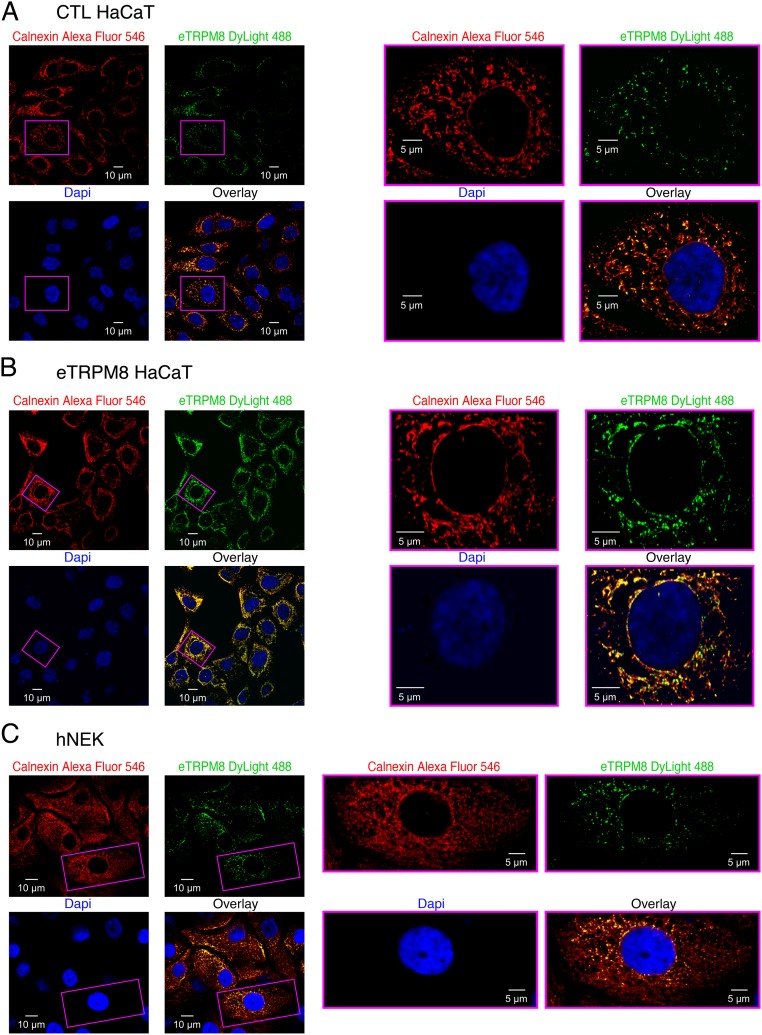
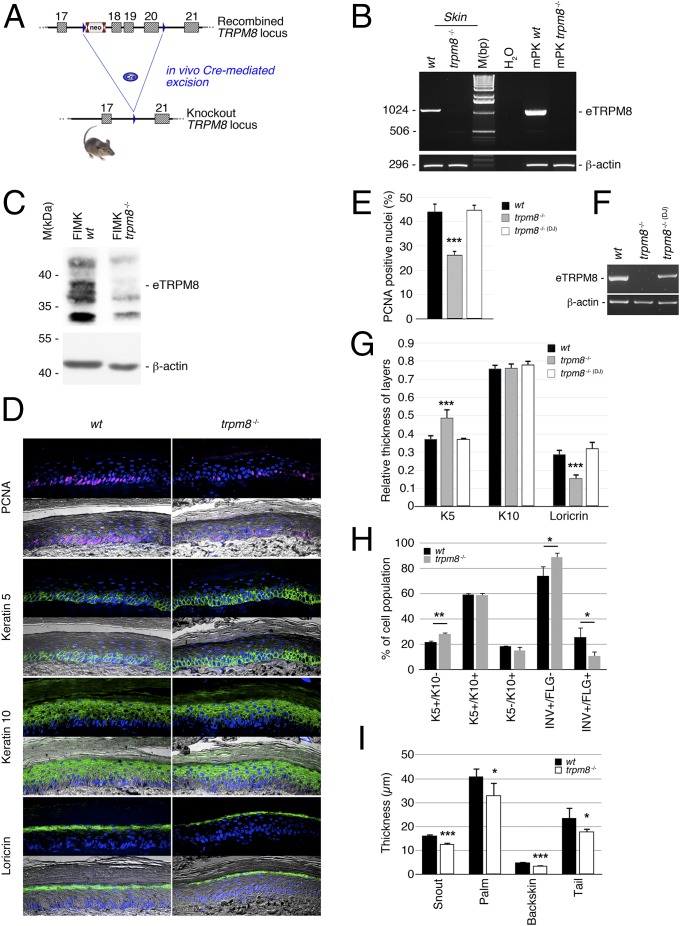
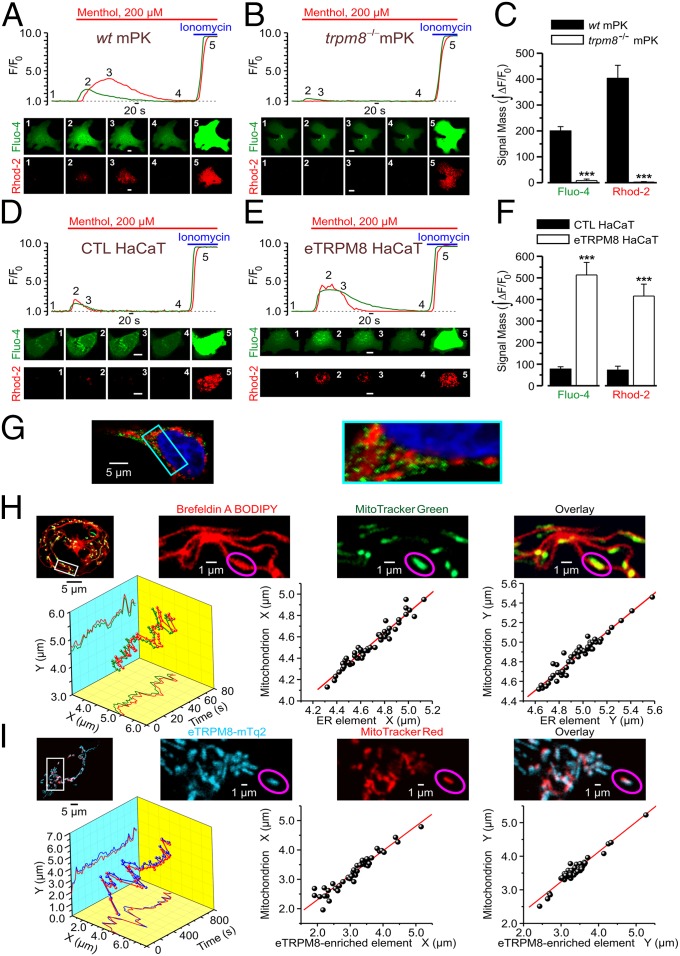
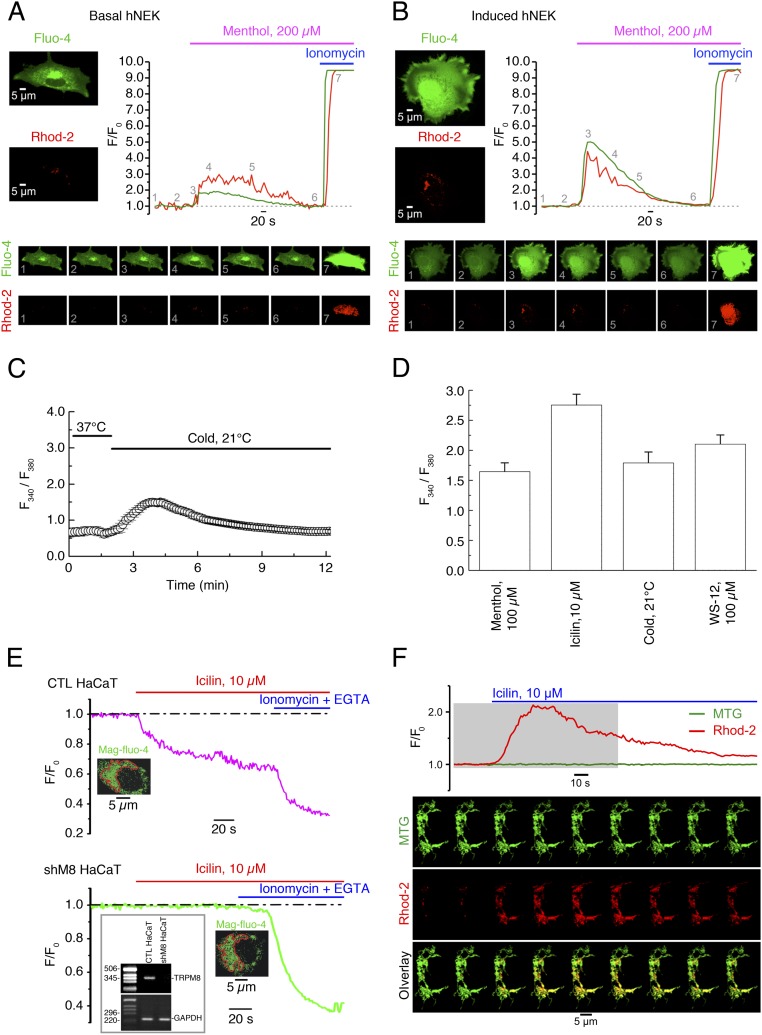
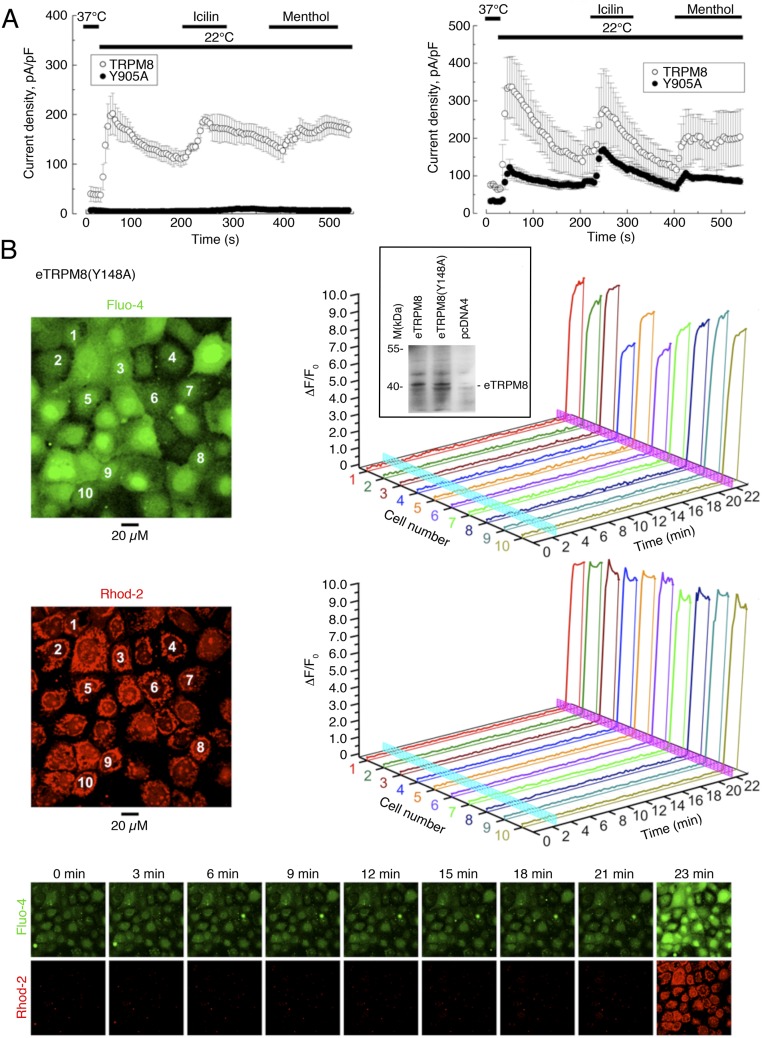
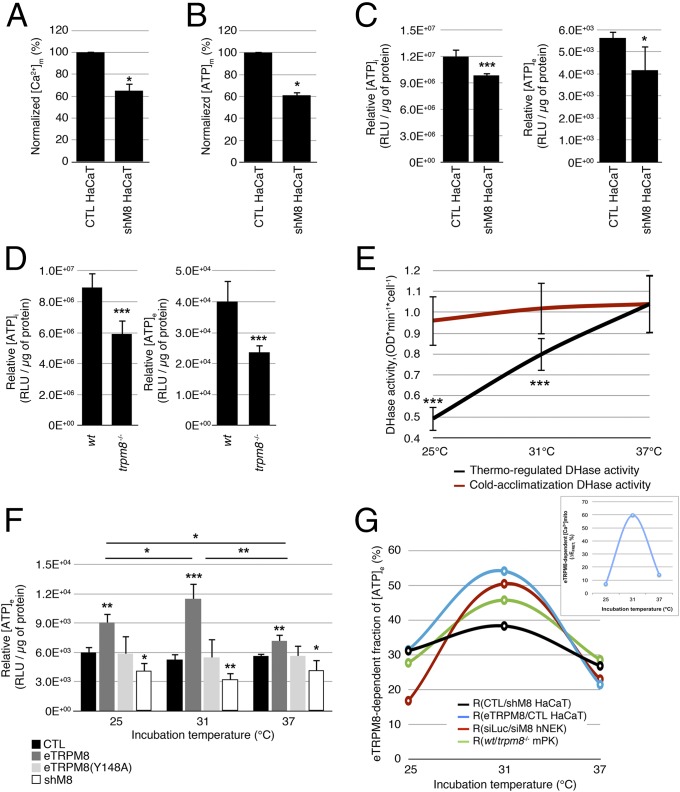
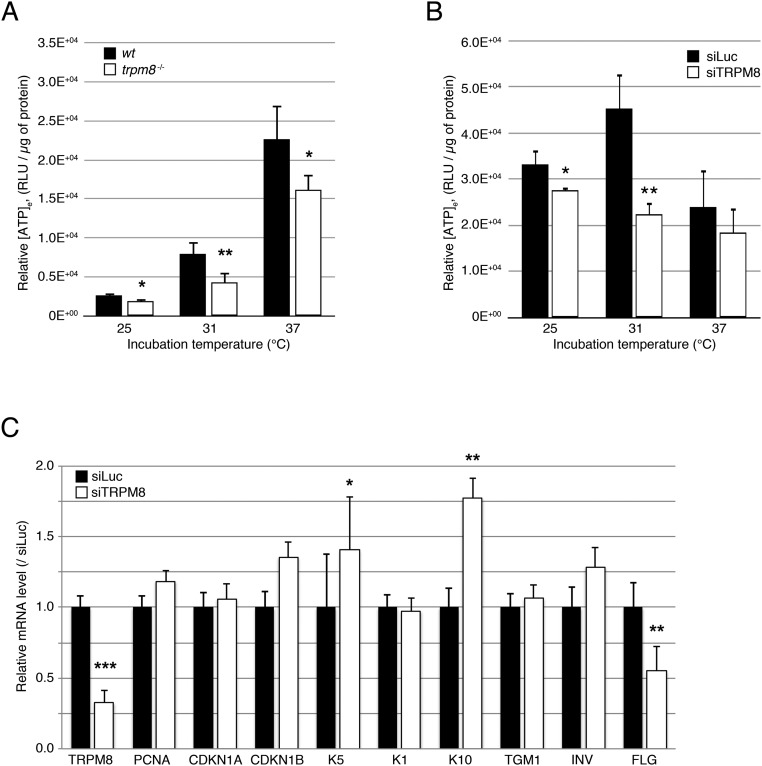
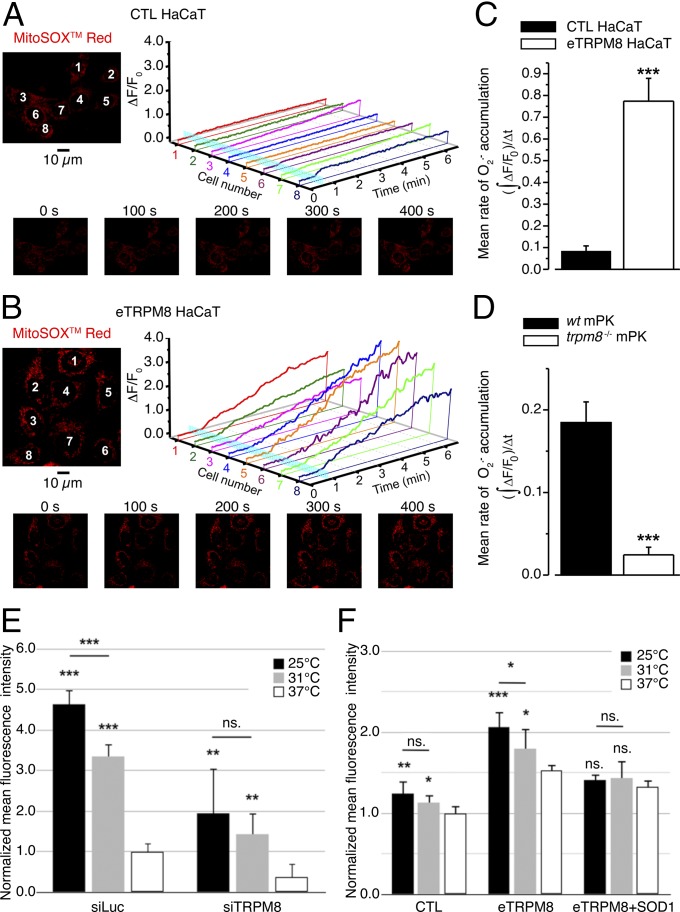
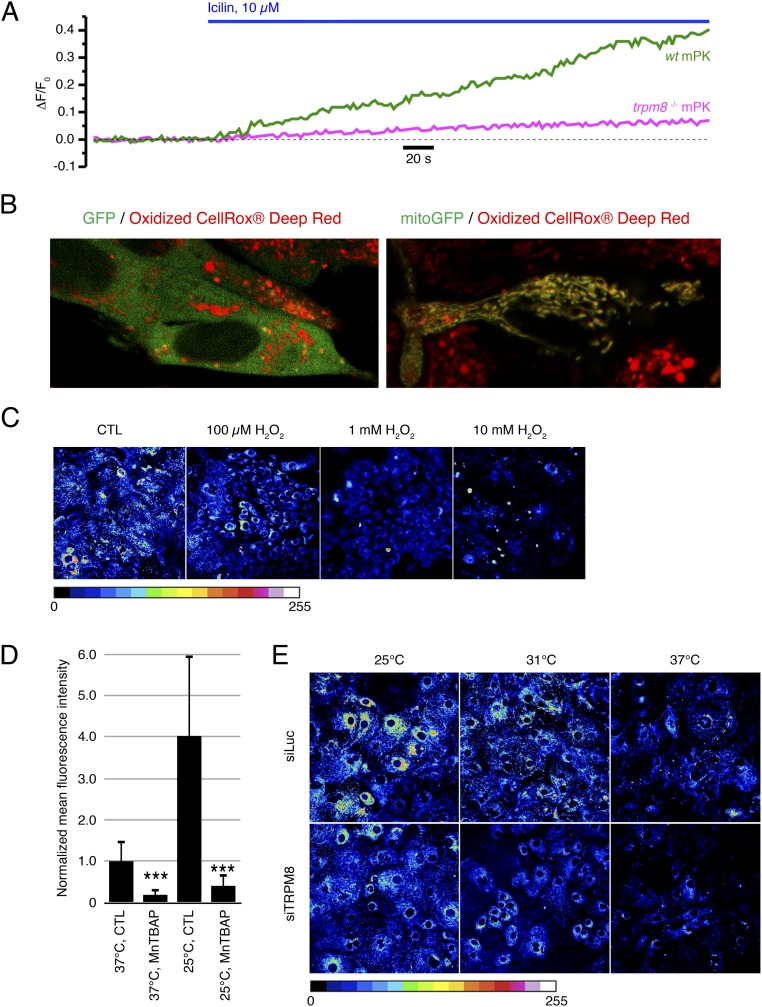
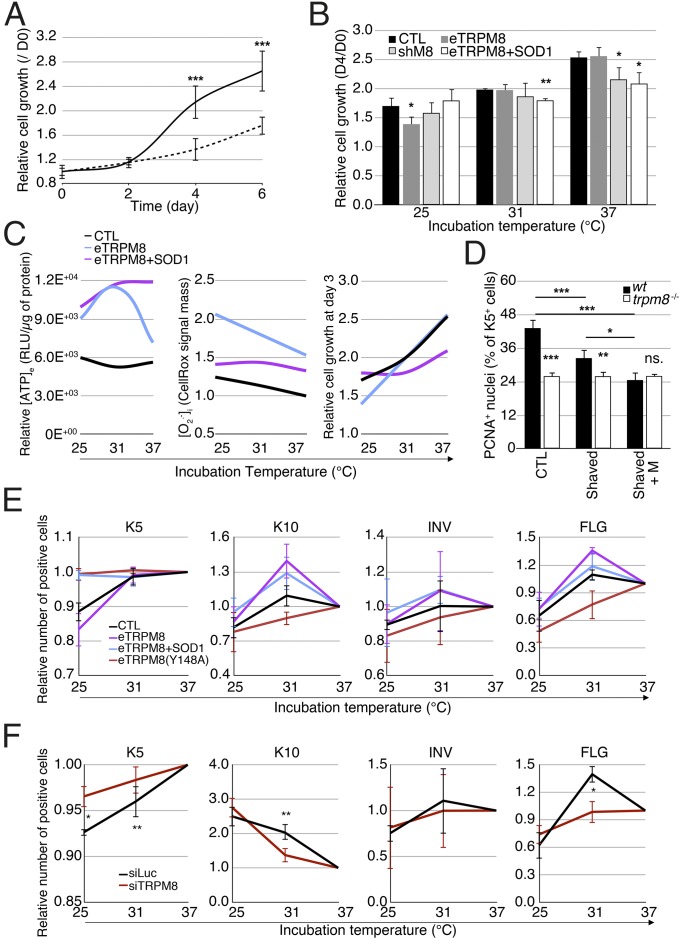
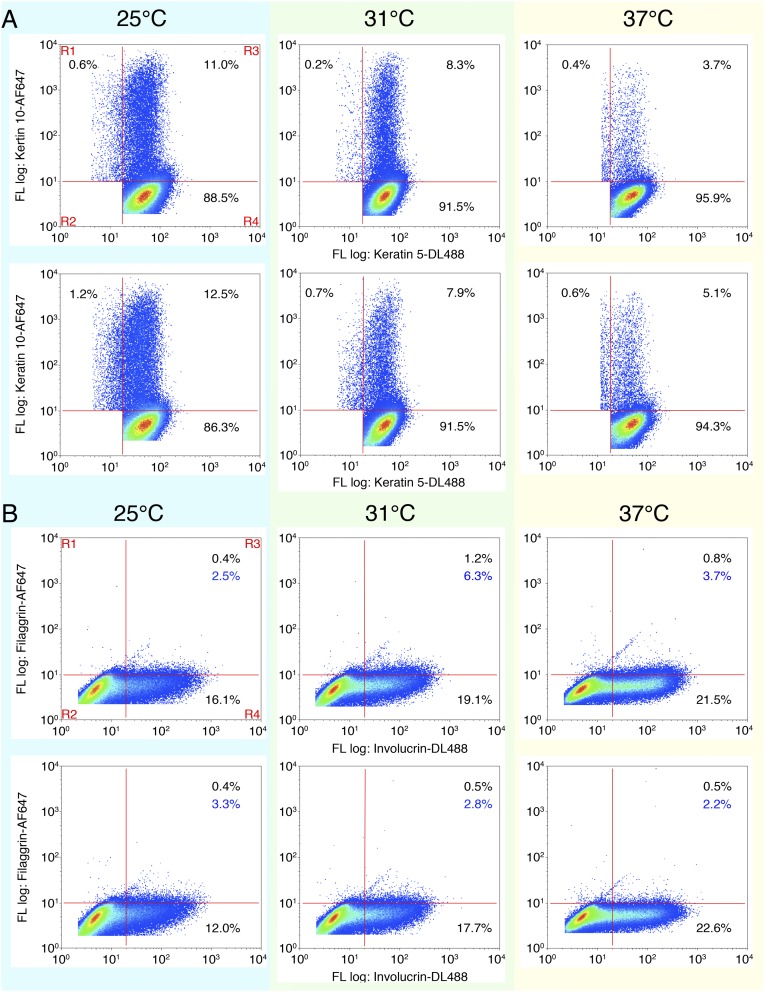
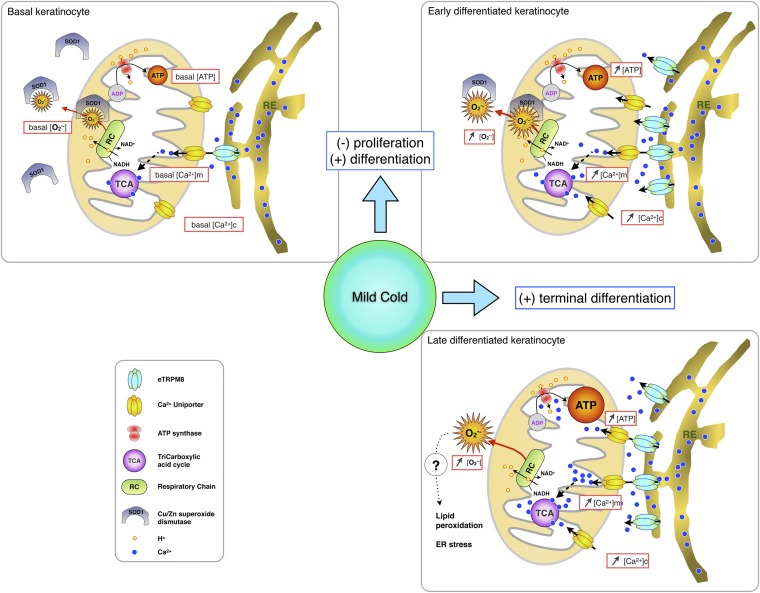
Deviation of the ambient temperature is one of the most ubiquitous stimuli that continuously affect mammals' skin. Although the role of the warmth receptors in epidermal homeostasis (EH) was elucidated in recent years, the mystery of the keratinocyte mild-cold sensor remains unsolved. Here we report the cloning and characterization of a new functional epidermal isoform of the transient receptor potential M8 (TRPM8) mild-cold receptor, dubbed epidermal TRPM8 (eTRPM8), which is localized in the keratinocyte endoplasmic reticulum membrane and controls mitochondrial Ca(2+) concentration ([Ca(2+)]m). In turn, [Ca(2+)]m modulates ATP and superoxide (O2(·-)) synthesis in a cold-dependent manner. We report that this fine tuning of ATP and O2(·-) levels by cooling controls the balance between keratinocyte proliferation and differentiation. Finally, to ascertain eTRPM8's role in EH in vivo we developed a new functional knockout mouse strain by deleting the pore domain of TRPM8 and demonstrated that eTRPM8 knockout impairs adaptation of the epidermis to low temperatures.

Keywords: calcium; cold; eTRPM8; epidermal homeostasis; mitochondria bioenergetics.


Conflict of interest statement

The authors declare no conflict of interest.

Figures

Fig. 1.
Fig. 1.
Trpm8 gene encodes alternate TRPM8 mRNA variants and their associated proteins in human keratinocytes. (A) Representative PCR fingerprinting (n = 5) revealed expression of the pore-encoding region (exons 20 and 21) in the keratinocyte HaCaT cell line, in human normal epidermal keratinocytes (hNEK), and in primary culture of human prostate epithelial (PrPE) cells. Note that segments from exons 2–7 and from exons 11–14, encoding the cytosolic N terminus of the TRPM8 channel, were detected in PrPE cells but not in keratinocytes. (B) Representative immunoblotting (n = 3) of 100 µg total protein extracts from human prostate (Pro), human normal epidermal keratinocytes (hNEK), and HaCaT cell line. A classical full-length TRPM8 channel (126–128 kDa) was detected with rabbit anti-TRPM8 antibody (Alomone Laboratories; batch from 2009). Calnexin protein was used as a reporter of equal loading. (C) Full-length PCR illustrates human tissue profiling of alternate TRPM8(15a) transcripts (n = 3). (D) The gallery shows fluorescent confocal images of human female breast skin sections (n = 3) with immunostained eTRPM8 (Upper Left, green) and keratin 10 (Upper Right, red) and their overlay (Lower Left) and corresponding transmitted light image (Lower Right). Numbers on the images depict the following: 1, dermis; 2, basal layer of epidermis; and 3, spinal and granular layers of epidermis. (Scale bar: 5 µm.) (E) Wild-type eTRPM8 and HA-tagged eTRPM8 (WT eTRPM8 and eTRPM8-HA, respectively), detected with anti-TRPM8 antibody in total protein extract from HEK cells, show a strong doublet at 39–40 kDa and much weaker doublet at 35–36 kDa. β-actin was used as a control of the protein loading. Immunoprecipitation with anti-HA antibody followed by immunoblotting with anti-TRPM8 antibody (E, Right, IP: HA) confirms specificity of both doublets and invalidates nonspecific bands between 55 kDa and 70 kDa. The same results were obtained in three independent samples. (F) Native eTRPM8 protein detected with anti-TRPM8 immunoblotting in two independent samples (hNEK-1 and -2) of the induced hNEKs. β-actin was used as a control of the protein loading. (G and H) Sample activity of eTRPM8 in response to application of 10 µM icilin, 500 nM ws-12, and 200 µM menthol, as well as inhibition by 10 μM BCTC, with levels of eTRPM8 activity summarized in H. (I) Typical records upon application of icilin, ws-12, and menthol to liposomes prepared from cells expressing the nonfunctional pore mutant eTRPM8(Y148A) or transfected with empty vector (pcDNA44). (J) Sample activity of ws-12–activated eTRPM8 at different potentials, indicated at left. Note the characteristic dependence of open probability on the command potential. (K) Dependence of the amplitude on command voltage. Straight line presents a linear fit yielding the mean channel conductance of 63.1 ± 2.4 pS. (L) Comparison of Popen vs. voltage curves at 20 °C and 37 °C (Left) and basal and menthol stimulated at 20 °C (Right). Individual points show mean ± SEM values at the indicated voltages.
Fig. S1.
Fig. S1.
TRPM8 mRNA variants encode a four-transmembrane domain monomer. (A) Not-to-scale genomic structure of the trpm8 gene aligned with the exonic structure of classical TRPM8, TRPM8(15a), and TRPM8(15a/δ16) mRNAs. Transmembrane domains and the P-loop segment are positioned in accordance with their DNA-encoding sequences. The putative first ATG codon and STOP codon are presented. (B) Real-time PCR compares quantity of TRPM8(15a) mRNA in HaCaT cells and in basal or induced (Materials and Methods) hNEKs (n = 3). (C) Expression of eTRPM8 mRNA in human female breast skin sections (n = 3) detected with in situ hybridization using a either an antisense probe targeting the pore region of TRPM8 (C, Upper Right) or its sense counterpart (C, Lower Right). The boundary between epidermis and dermis is outlined (red) in the transmitted light images of the skin sections (C, Upper Left and Lower Left). (Scale bar: 10 µm.) (D) Schematic representation of the predicted tertiary structure of TRPM8 and eTRPM8 monomers and their cellular location. (E) Western blot showing the presence of eTRPM8 and nonfunctional mutant, eTRPM8(Y148A) in ER membrane-enriched extracts of transfected HEK cells. Control experiment was achieved by the transfection of an empty vector in HEK cells. eTRPM8 was detected at the expected size of 40 kDa. Internal control for protein amount was performed through the detection of calnexin.
Fig. S2.
Fig. S2.
eTRPM8 is expressed in the keratinocyte endoplasmic reticulum (ER) but not in the cell plasma membrane. Detection of eTRPM8 and the ER marker, calnexin, was performed in (A) control HaCaT cells (CTL HaCaT), (B) HaCaT cells overexpressing epidermal TRPM8 (eTRPM8 HaCaT), and (C) human normal epidermal keratinocytes (hNEK), using indirect immunostaining. Primary antibody-specific binding to eTRPM8 and calnexin was visualized with DyLight 488- and Alexa Fluor 546-conjugated IgGs, respectively. Galleries (A–C, Left) show confocal images of Alexa Fluor 546 (the ER elements, red), DyLight 488 (eTRPM8, green), and DAPI (nuclei, blue) fluorescence and their overlay, as indicated. (A–C, Right) Enlarged images of the boxed regions.
Fig. 2.
Fig. 2.
Epidermal TRPM8 isoform (eTRPM8) ablation in mouse epidermis partially impairs epidermal homeostasis. (A) Schematic representation of the strategy used to establish the trpm8 −/− mouse line. (B) PCR amplification from exon 16 to exon 22 demonstrates expression of mouse eTRPM8 mRNA in wild type (WT) skin as well as in mPKs derived from WT mouse skin and grown with 2% FCS and 1.8 mM Ca2+ (mPK WT). Note that no eTRPM8 expression was detected in keratinocytes derived from trpm8 −/− mouse skin (mPK trpm8 −/−) (n = 3). (C) Immunoblotting shows ∼38 kDa protein in the skin of WT but not trpm8 −/− mice (one of four readings for each mouse strain). β-actin was used as a control of the protein loading. (D) Representative immunohistofluorescence images of WT and trpm8 −/− mouse palm skin reveal a decreased number of cycling cells in trpm8 −/− epidermis (reported by PCNA) and a thicker granular layer (reported by loricrin, LN). (E) Bar diagram plot compares fractions of the cells with PCNA-positive nuclei in the keratin 5 (K5)-positive cell compartment counted in the images of skin sections of five WT mice, seven trpm8 −/− mice, and five trpm8 −/− (DJ) mice (lacking full-length TRPM8 channel only). Note that the trpm8 −/− mouse skin section (D) has a thicker basal layer (K5-positive cells) but a thinner granular layer (LN-positive cells), whereas the total thickness of SS + SG remains unaltered. (F) PCR amplification from exon 16 to exon 22 demonstrates expression of mouse eTRPM8 mRNA in skin sections of WT mice, trpm8 −/− mice, and trpm8 −/− (DJ) mice. (G) Bar diagram plot compares relative thickness (Materials and Methods) of K5-, K10-, and LR-positive compartments in five WT mice, seven trpm8 −/− mice, and five trpm8 −/− (DJ) mice. (H) Distribution of keratinocyte phenotypes in the suspension of cells, freshly isolated from the back skin samples of five WT and five trpm8 −/− mice, was measured with flow cytometry and compared. The phenotypes detected include basal cells (K5+/K10−), suprabasal and early spinal cells (K5+/K10+), late spinal cells (K10+/INV+/FLG−), and granular cells (INV+/FLG+). (I) Thickness of corneosum stratum (CS) was measured in trichrome-stained slides of paraffined skin samples obtained from the different skin regions (as indicated) and compared for five WT and five trpm8 −/− mice.
Fig. 3.
Fig. 3.
eTRPM8 couples Ca2+ release from the ER to mitochondrial Ca2+ uptake. Changes of Ca2+ concentration in cytosol ([Ca2+]c) and mitochondria ([Ca2+]m) in response to external application of 200 µM menthol were monitored using x-y time series imaging of fluo-4 and rhod-2 fluorescence, respectively, in primary cultures of (A) wild-type mouse keratinocytes (WT mPK) and (B) trpm8 −/− mouse keratinocytes (trpm8 −/− mPK) and in (D) control HaCaT cells (CTL HaCaT) and (E) HaCaT cells overexpressing eTRPM8 (eTRPM8 HaCaT). The plots show the time course of normalized fluorescence (F/F0) of fluo-4 (green traces) and rhod-2 (red traces). The galleries below the plots demonstrate the images of fluo-4 and rhod-2 fluorescence (as indicated), captured at the moments depicted by the numbers on the plots, respectively. (Scale bar: 10 μm.) To eliminate capacitative Ca2+ entry, an external solution, containing 70 μM Ca2+, was supplemented with 10 μM La3+. To estimate the load of the Ca2+-sensitive indicators, the cells were exposed to 2.5 μM of ionomycin at the end of each experiment. Bar diagram plots compare masses, ΔF/F0, of the fluo-4 and rhod-2 signals (as indicated) during the period between application of menthol and application of ionomycin in (C) trpm8 −/− mPKs (n = 35) vs. WT mPKs (n = 27) and in (F) eTRPM8 HaCaT cells (n = 15) vs. CTL HaCaT cells (n = 16). Immunodetection (G) of overexpressed eTRPM8 (green) in HaCaT cells expressing a DsRed targeted to mitochondria (red) illustrates that eTRPM8-expressing ER microdomains are in close proximity to mitochondria. (G, Right) Enlarged image of the boxed region. (H and I) Coordinated motility confirms tight coupling between eTRPM8-enriched ER elements and mitochondria in HaCaT cells. The ER elements were either stained with Brefeldin A BODIPY 558/568 (H) or identified by mTurquoise2 (mTq2) fluorescence, following eTRPM8-mTq2 expression (I). The mitochondria (H and I) were stained with either MitoTracker Green FM (MTG) or MitoTracker Red FM (MTR), respectively. Spatial distribution of the ER elements and mitochondria was analyzed using x-y time series confocal imaging. The galleries (H and I, Upper Right) show enlarged images of Brefeldin A BODIPY and MTG fluorescence (H) or mTq2 and MTR fluorescence (I) captured from the boxed region (H and I, Upper Left) and their overlays, as indicated. Motility analysis was conducted for the outlined (magenta ellipses) mitochondrion and the adjacent ER element. The x and y positions of the local maxima of the MTG and Brefeldin A BODIPY fluorescence (H) or mTq2 and MTR fluorescence (I) were computed and plotted over time. The 3D plots (H and I, Lower Left) show the trajectory of the motion of the mitochondrion (H, green; I, red) and adjacent (H, red) ER element or (I, blue) eTRPM8-enriched ER element. The x and y positions of the organelles in time are seen in the x-y and x-z projections on the 3D plot, respectively. The x vs. x and y vs. y positions for the mitochondrion and the ER element are plotted (H and I, Lower Center and Lower Right, respectively). Linear regression analysis revealed high correlation between the parameters in all four cases: R = 0.973 (H, Lower Center), R = 0.970 (H, Lower Right), R = 0.963 (I, Lower Center), and R = 0.967 (I, Lower Right).
Fig. S3.
Fig. S3.
eTRPM8-mediated Ca2+ release results in mitochondrial Ca2+ uptake in human keratinocytes. (A and B) Changes of Ca2+ concentration in cytosol ([Ca2+]c) and mitochondria ([Ca2+]m) elicited by external application of 200 µM menthol were monitored using x-y time series imaging of fluo-4 and rhod-2 fluorescence, respectively, in (A) primary culture of basal and (B) induced (Materials and Methods) human primary culture keratinocytes (hPK). To eliminate capacitative Ca2+ entry, external solution, containing 70 μM Ca2+, was supplemented with 10 μM La3+. To estimate the load of the Ca2+-sensitive indicators, the cells were exposed to 2.5 μM of ionomycin at the end of each experiment. The fluorescence intensity (F) was normalized to the averaged fluorescence intensity before menthol application (F0). The plots show the time course of normalized fluorescence (F/F0) of fluo-4 (green traces) and rhod-2 (red traces). The galleries below the plots demonstrate the images of fluo-4 and rhod-2 fluorescence (as indicated) captured at the moments, depicted by the numbers on the plots, respectively. (C) Application of cold solution (21 °C) induces [Ca2+]c transients in keratinocytes bathed in Ca2+-free medium. (D) Bar diagram plot shows mean amplitudes of the fura-2 responses (fluorescence intensity ratio at 340 nm and 380 nm) to 100 µM menthol (n = 30), 10 µM icilin (n = 32), 0.1 µM WS-12 (n = 25), and mild cold (21 °C) (n = 20) in the cells bathed in Ca2+-free solution. (E) Changes in the ER luminal Ca2+ concentration [Ca2+]ER were monitored at 37 °C in digitonin-permeabilized keratinocytes, using the low-affinity Ca2+ indicator mag-fluo-4. Application of 10 µM icilin induces a gradual decrease of the normalized mag-fluo-4 fluorescence (F/F0) in control HaCaT cells (CTL HaCaT; C, Upper) but not in eTRPM8 KD HaCaT cells (shM8 HaCaT; C, Lower). To verify whether mag-fluo-4 response reflects the decrease of [Ca2+]ER, the ER was depleted at the end of the experiment by exposure of the cells to the solution containing 1 µM ionomycin and 10 µM EGTA. The traces on the graphs show the time course of the normalized mag-fluo-4 fluorescence (F/F0) averaged within outlined (red) regions. (F) Visualization of mitochondria with MitoTracker Green FM (MTG) confirms mitochondrial origin of rhod-2 response to stimulation of eTRPM8 with icilin in HaCaT cells. The plot shows the time course of self-normalized (F/F0) MTG and rhod-2 fluorescence, as indicated. The fluorescence intensity (F) was normalized to the averaged fluorescence intensity before icilin application (F0). The galleries below the plot demonstrate the images of MTG fluorescence (Top), rhod-2 fluorescence (Middle), and their overlay (Bottom): Every 12th image captured from a single HaCaT cell during the period, highlighted on the plot by a gray background, is shown (from left to right). Note that elevation of mitochondrial Ca2+ concentration ([Ca2+]m) is reported in the overlay images by change in color of mitochondria from green (dominating MTG fluorescence) to yellow (the overlay of MTG and elevated rhod-2 fluorescence).
Fig. S4.
Fig. S4.
Mutation in TRPM8 or eTRPM8 pore region abolishes the channel-mediated Ca2+ fluxes. (A) Whole-cell patch clamp recordings were conducted in WT TRPM8-, TRPM8(Y905A)-, and WT TRPM8 + TRPM8(Y905A)-transfected HEK cells. The cell membrane potential was repetitively altered by voltage ramps from −100 mV to +100 mV (applied at 0.2 Hz). The changes in the mean current density at +100 mV, elicited by the exposure to cold (22 °C), 500 μM menthol, and 10 µM icilin were compared in WT TRPM8-transfected vs. TRPM8(Y905A)-transfected cells (A, Left; n = 20 and n = 7, respectively), and in WT TRPM8-cotransfected vs. WT TRPM8 + TRPM8(Y905A)-cotransfected cells (A, Right; n = 15 and n = 8, respectively). Cotransfection of WT TRPM8 and TRPM8(Y905A) was performed at a 1:3 ratio. (B) No detectable changes of Ca2+ concentration in cytosol ([Ca2+]c) and mitochondria ([Ca2+]m) were observed in response to 200 µM menthol in HaCaT cells expressing eTRPM8(Y148A). Changes of [Ca2+]c and [Ca2+]m were monitored using x-y time series imaging of fluo-4 and rhod-2 fluorescence, respectively. To eliminate capacitative Ca2+ entry, external solution, containing 70 μM Ca2+, was supplemented with 10 μM La3+. The fluorescence intensity (F) was normalized to the averaged fluorescence intensity before menthol application (F0). Relative changes in the fluorescence intensity (ΔF/F0), averaged within each of 10 cells, denoted by the numbers on the images (B, Left), are plotted over time, respectively (B, Right). To estimate the load of the Ca2+-sensitive indicators, the cells were exposed to 2.5 μM of ionomycin at the end of the experiment. Menthol and ionomycin applications are depicted on the 3D plots by vertical cyan and magenta bars, respectively. The galleries below the plots demonstrate the images of fluo-4 and rhod-2 fluorescence (as indicated), captured at times indicated above the images. Inset (B, Top Right) shows the immunodetection of WT eTRPM8 and eTRPM8(Y148A) expressed in HEK cells. Negative control is achieved with protein extract from HEK transfected with the empty vector pcDNA4.
Fig. 4.
Fig. 4.
eTRPM8 conveys cold-dependent enhancement of ATP synthesis. (A) A steady-state [Ca2+]m was assessed using mtAEQmut probe in control and eTRPM8 KD HaCaT cells (CTL HaCaT and shM8 HaCaT, respectively). Bar diagram plot compares mean ± SEM values in CTL HaCaT cells (n = 13) and ShM8 HaCaT cells (n = 11) in three independent experiments, after rescaling the mean control value to 100%. (B) Basal ATP concentration within mitochondria ([ATP]m) was measured with mitochondria targeted ATP-dependent luciferase in CTL HaCaT (n = 12) and shM8 HaCaT (n = 12) cells at 37 °C. Decrease of [ATP]m in shM8 HaCaT cells (presented as percentage of control) is summarized in the bar diagram plot. (C) Intracellular and extracellular ATP concentrations ([ATP]i and [ATP]e) were quantified using luciferase assay (Materials and Methods) in CTL HaCaT and shM8 HaCaT cells at 37 °C and compared (n = 5). (D) The same as C but for mPKs from WT and trpm8 −/− mice (n = 5). (E) Dehydrogenase (DHase) activity assay performed at 37 °C, 31 °C, or 25 °C demonstrates strong temperature dependence of DHase activity in hNEKs cultured at 37 °C (black curve, thermo-regulated DHase activity). No significant deviations in DHase activity associated with cold acclimatization of hNEKs cultured at 37 °C, 31 °C, or 25 °C were detected by DHase assay performed at 37 °C (red curve, cold acclimatization DHase activity). n = 3. (F) Quantification of [ATP]e HaCaT cells cultured at 37 °C, 31 °C, or 25 °C for 24 h following transfection with either vector (CTL), eTRPM8, pore-killer mutant eTRPM8(Y148A), or shRNA targeting eTRPM8 (shM8). n = 5. (G) Contribution of eTRPM8 to regulation of ATP synthesis was estimated from TRPM8-dependent fraction of [ATP]e: (i) the differences between WT/CTL/siLuc and KO/shM8/siTRPM8 [ATP]e values were divided by corresponding WT/CTL/siLuc [ATP]e values, for mPKs, HaCaT cells, and hNEKs, respectively and (ii) the difference between eTRPM8 HaCaT and CTL HaCaT [ATP]e values was divided by the eTRPM8 HaCaT [ATP]e value. (Inset) Using the same strategy the eTRPM8-dependent component of a steady-state [Ca2+]m was assessed by the measurements of 4mTM3cpv Cameleon FRET efficacy (EFRET) in HaCaT and eTRPM8 HaCaT cells. Smooth curves show parabolic interpolation of the mean values (n = 5). Note that in all cases, an impact of eTRPM8 activity on [ATP]e is maximal around 31 °C. Also note correlation between eTRPM8-dependent [Ca2+]m and [ATP]e.
Fig. S5.
Fig. S5.
(A) Extracellular ATP concentration ([ATP]e) assessed in the media with cultured keratinocytes, isolated from a wild-type mouse (WT mPK) and a trpm8 knockout mouse (trpm8 −/− mPK), and grown at 25 °C, 31 °C, or 37 °C for 3 d. Data are shown as mean ± SD for six WT mice and six trpm8 −/− mice. (B) Same as A but for induced hNEKs transfected with either control siRNA (siLuc) or siRNA targeting TRPM8 (siTRPM8) and cultured at 25 °C, 31 °C, or 37 °C for 3 d. (C) Real-time PCR experiment demonstrates the effect of eTRPM8 silencing (60% decrease) in hNEK cells (siTRPM8 vs. siLuc) on the expression of genes encoding PCNA, CDKN1A, CDKN1B, keratin 5 (K5), keratin 1 (K1), keratin 10 (K10), transglutaminase 1 (TGM1), involucrin (INV), and filaggrin (FLG). Experiment was performed three times, and values are presented as mean ± SD. The mean values on the plot are rescaled so that mean value in siLuc-treated cells for each gene tested is 1 ± SD. *P < 0.05, **P < 0.01, ***P < 0.001.
Fig. 5.
Fig. 5.
Icilin- and cold-induced O2•− accumulation depends on the level of eTRPM8 expression. (A and B) Confocal images of MitoSOX Red fluorescence revealed distinct mitochondrial staining in control HaCaT cells, CTL HaCaT (A), and HaCaT cells overexpressing epithelial TRPM8, eTRPM8 HaCaT (B). Changes in the MitoSOX fluorescence in response to stimulation with 10 μM icilin were monitored using the x-y time series imaging protocol. The MitoSOX fluorescence intensity (F) was normalized to the averaged fluorescence intensity before agonist application (F0). In A and B, relative changes in the fluorescence intensity (ΔF/F0), averaged within each of eight cells denoted by the numbers on the images (Upper Left), are plotted over time, respectively (Upper Right). Icilin application is depicted by a vertical cyan bar. The galleries (A and B, Lower) show the images of MitoSOX fluorescence captured at times indicated above the images. Mean rates of O2•− accumulation were estimated as masses of MitoSOX fluorescent signal per second following icilin application, (ΔF/F0)/Δt, in CTL HaCaT (n = 28), in eTRPM8 HaCaT (n = 20), in primary cultures of either WT mouse keratinocytes (WT mPK) (n = 8) or trpm8 −/− mouse keratinocytes (trpm8 −/− mPK) (n = 10), and compared in C and D, respectively. (E) Steady-state superoxide concentration [O2•−] was assessed in living hNEKs after 72 h culturing at 37 °C, 31 °C, or 25 °C, using CellRox Deep Red Reagent. Cells were transfected either with control siRNA (siLuc) or with siRNA targeting the pore-encoding sequence of TRPM8 (siTRPM8). For each temperature and siRNA condition the measurements were performed in three Petri dishes, sequentially mounted on the microscope stage at the ambient temperature corresponding to the preincubation temperature. In each Petri dish confocal imaging of CellRox Deep Red fluorescence was performed from four fields of view, 230 × 230 µm (1,024 × 1,024 pixels) each. The O2•−- specific increases in the CellRox Deep Red signal mass (Materials and Methods) for each condition were averaged, normalized to the mean value detected at 37 °C in siLuc-transfected hNEKs, and compared. (F) The same as E, but for HaCaT cells transfected with empty vector (CTL), eTRPM8 plasmid, or eTRPM8 + SOD1 plasmids and cultured for 24 h at 37 °C, 31 °C, or 25 °C. The data were normalized to the mean value detected at 37 °C in HaCaT cells transfected with empty vector and compared. Note that the differences between corresponding values for different expression conditions (E and F) are statistically significant at all three temperatures tested with P < 0.05. Experiments in E and F were performed three times and include more than 200 cells per experiment.
Fig. S6.
Fig. S6.
Icilin-induced O2•− production is significantly reduced in primary culture of keratinocytes from trpm8−/− TRPM8 mice. (A) Relative changes in the MitoSOX Red fluorescence intensity (ΔF/F0), detected using confocal x-y time series imaging in primary culture of keratinocytes from wild-type mice, WT mPK (green trace), and keratinocytes from trpm8 −/− TRPM8 mice, trpm8 −/− mPK (magenta trace), reflect the time course of O2•− accumulation in response to application of 10 μM icilin. (B) Confocal images of oxidized CellRox deep red reagent in cells transfected with either GFP (B, Left) or mitoGFP (B, Right) revealed mitochondrial localization of CellRox deep red reagent. (C) Confocal images of CellRox deep red-loaded hNEKs incubated in solutions containing vehicle only (water; CTL) or increasing concentrations of hydrogen peroxide (H2O2), as indicated. The CellRox deep red fluorescence intensity was color coded as indicated by the bar. The same illumination intensity, photomultiplier gain, and offset were used in all of the experiments (n = 3). (D) Bar diagram plot compares mean intensity of the normalized CellRox deep red fluorescence in control hNEKs (CTL) with that in hNEKs pretreated with 100 µM MnTBAP for 30 min (MnTBAP) after 3-d cell culturing at either 37 °C or 25 °C, as indicated (n = 3). (E) Confocal images of CellRox deep red-loaded hNEKs transfected with either control siRNA (siLuc) or siRNA targeting TRPM8 (siTRPM8). Induced (Materials and Methods) cells were cultured at 25 °C, 31 °C, or 37 °C for 3 d. The CellRox deep red fluorescence intensity was color coded as indicated by the bar. The same illumination intensity, photomultiplier gain, and offset were used in all of the experiments (n = 3).
Fig. 6.
Fig. 6.
Mild cold suppresses proliferation and facilitates differentiation of keratinocytes in an eTRPM8-dependent manner. (A) The graph illustrates growth of induced (Materials and Methods) hNEKs transfected with either control siRNA (black solid line) or anti-TRPM8 siRNA (dashed line) during 6 d. Data are presented as fold increase of the cell number from day 0. n = 3. (B) Bar diagram plot compares growth of HaCaT cells transfected with empty vector (CTL), eTRPM8 vector (eTRPM8), or shRNA anti-TRPM8 vector (shM8) or cotransfected with eTRPM8 and SOD1 vectors (eTRPM8+SOD1) at 25 °C, 31 °C, and 37 °C. n = 3. (C) Charts illustrate dependence of [ATP]e (C, Left), [O2•−]i (C, Center), and cell growth (C, Right) on ambient temperature for HaCaT cells transfected with either empty vector (CTL) or eTRPM8 vector (eTRPM8) or cotransfected with eTRPM8 and SOD1 vectors (eTRPM8+SOD1). Smooth curves are the result of parabolic interpolation of the mean values (n = 3). (D) Count of PCNA-positive nuclei in basal epidermis compartment was performed on slices from three different areas of skin (Materials and Methods): furred (CTL), shaved (Shaved), and shaved with application of 1 mM Menthol twice a week (Shaved+M). Six WT and seven trpm8 −/− mice were treated for 3 wk before analysis was commenced. Bar diagram plot shows the ratio of the number of PCNA-positive cells divided by the number DAPI-positive nuclei in the basal compartment identified with anti-keratin 14 antibodies. (E) Distribution of keratinocyte phenotypes of HaCaT cells induced at 37 °C, 31 °C, or 25 °C for 24 h was measured with flow cytometry and compared for HaCaT cells transfected with empty vector (CTL), eTRPM8 vector (eTRPM8), or eTRPM8 mutant vector [eTRPM8(Y148A)] or cotransfected with eTRPM8 and SOD1 vectors (eTRPM8+SOD1). The distribution of keratinocyte phenotypes was estimated on the basis of the percentage of cells expressing basal differentiation marker, K5; early spinal differentiation marker, K10; late spinal differentiation marker, INV; and granular differentiation marker, FLG. Cold dependency of keratinocyte differentiation was calculated with normalization of values from cells grown at 25 °C and 31 °C by values from cells grown at 37 °C. Data are presented as mean ± SD (n = 3). Statistical significance was calculated for eTRPM8, eTRPM8+SOD1, and eTRPM8(Y148A) compared with control cells. (F) Same as E but for hNEKs transfected with either control siRNA (siLuc) or anti-TRPM8 siRNA (siTRPM8) for 4 d. Experiments in E and F were performed three times and include more than 100,000 cells per experiment. Data are presented as mean ± SD.
Fig. S7.
Fig. S7.
Mild cold effect on distribution of the induced hNEKs according to the expression of differentiation markers. (A) Flow cytometry codetection of keratin 5 and keratin 10 in hNEKs transfected with either control siRNA (siLuc) or siRNA targeting TRPM8 (siTRPM8) and grown at 25 °C, 31 °C, or 37 °C for 4 d. After compensation, regions of interest were chosen to highlight four cell populations (A and B, Upper Left): R1, cells expressing a single marker indicated on the y axis; R2, cells expressing nonspecific markers; R3, cells coexpressing two markers indicated on x and y axes; and R4, cells expressing a single marker indicated on the x axis. For each population (except R2) its fractional contribution is expressed as a percentage in the corresponding quadrant on the plots. Differentiation markers denoted on the x axis were immunodetected with Dyelight-488–conjugated IgG, whereas differentiation markers denoted on the y axis were immunodetected with AlexaFluor-647–conjugated IgG. (B) Same as A for codetection of involucrin and filaggrin labeled with Dyelight-488– and AlexaFluor-647–conjugated IgG, respectively.
Fig. S8.
Fig. S8.
Schematic representation of the proposed mechanism by which eTRPM8 increases proliferation of basal keratinocytes and mediates cold-dependent potentiation of keratinocyte differentiation. In basal keratinocytes (Upper Left) the level of expression of eTRPM8 is lower whereas the level of expression of superoxide dismutase 1 (SOD1) is higher than in early differentiated keratinocytes (Upper Right). Activation of eTRPM8 in basal keratinocytes will, therefore, cause a moderate increase of mitochondrial Ca2+ concentration ([Ca2+]m), which, in turn, could potentiate the tricarboxylic acid cycle (TCA) and, as a result, increase the activity of the respiratory chain (RC) and ATP synthesis and secretion. However, concomitant O2 accumulation will be limited by SOD1 activity. Moderate increase in ATP concentration will initiate cell cycle progression through paracrine activation of P2Y receptors. Induction of differentiation is associated with an increase of eTRPM8 expression and a decrease of SOD1 expression in differentiating keratinocytes (Upper Right and Lower Right). Therefore, activation of eTRPM8 in differentiated keratinocytes will boost ATP and O2 synthesis. Augmented ATP secretion and accumulation in interstitial space will induce robust elevation of cytosolic Ca2+ concentration, [Ca2+]c (e.g., via activation of P2X-mediated Ca2+ entry). Enhanced O2 synthesis will overcome the activity of down-regulated SOD1, thus resulting in accumulation of O2, which, in turn, will induce lipid peroxidation and ER stress. This, accompanied by a sustained [Ca2+]c elevation, will induce terminal differentiation of keratinocytes.

References

    1. Fuchs E. Epidermal differentiation: The bare essentials. J Cell Biol. 1990;111(6 Pt 2):2807–2814. - PMC - PubMed
    1. Smith AD, Crabtree DR, Bilzon JL, Walsh NP. The validity of wireless iButtons and thermistors for human skin temperature measurement. Physiol Meas. 2010;31(1):95–114. - PubMed
    1. Lumpkin EA, Caterina MJ. Mechanisms of sensory transduction in the skin. Nature. 2007;445(7130):858–865. - PubMed
    1. Caterina MJ, Julius D. The vanilloid receptor: A molecular gateway to the pain pathway. Annu Rev Neurosci. 2001;24:487–517. - PubMed
    1. McKemy DD, Neuhausser WM, Julius D. Identification of a cold receptor reveals a general role for TRP channels in thermosensation. Nature. 2002;416(6876):52–58. - PubMed

Publication types

Associated data

LinkOut - more resources