

Light-driven synchrony of Prochlorococcus growth and mortality in the subtropical Pacific gyre
- PMID: 26080407
- PMCID: PMC4491802
- DOI: 10.1073/pnas.1424279112
Light-driven synchrony of Prochlorococcus growth and mortality in the subtropical Pacific gyre
Abstract
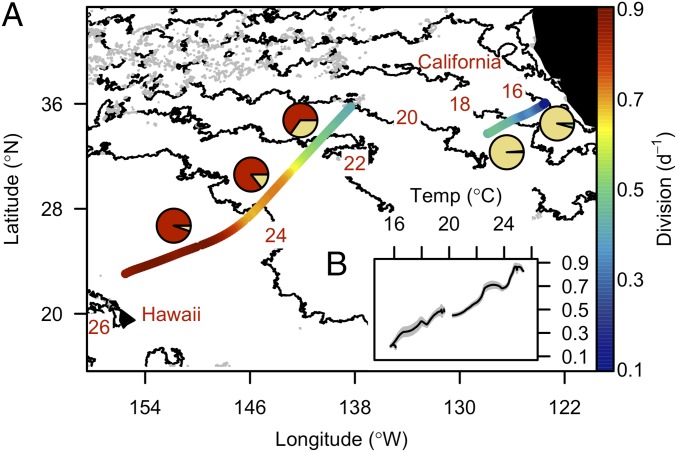
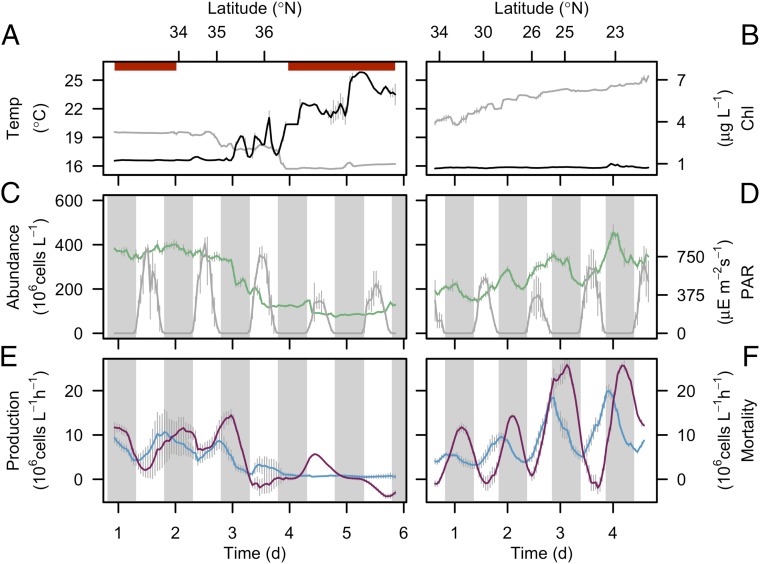
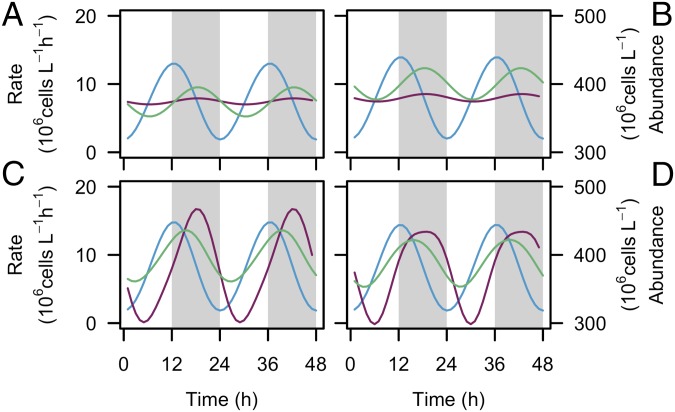
Theoretical studies predict that competition for limited resources reduces biodiversity to the point of ecological instability, whereas strong predator/prey interactions enhance the number of coexisting species and limit fluctuations in abundances. In open ocean ecosystems, competition for low availability of essential nutrients results in relatively few abundant microbial species. The remarkable stability in overall cell abundance of the dominant photosynthetic cyanobacterium Prochlorococcus is assumed to reflect a simple food web structure strongly controlled by grazers and/or viruses. This hypothesized link between stability and ecological interactions, however, has been difficult to test with open ocean microbes because sampling methods commonly have poor temporal and spatial resolution. Here we use continuous techniques on two different winter-time cruises to show that Prochlorococcus cell production and mortality rates are tightly synchronized to the day/night cycle across the subtropical Pacific Ocean. In warmer waters, we observed harmonic oscillations in cell production and mortality rates, with a peak in mortality rate consistently occurring ∼6 h after the peak in cell production. Essentially no cell mortality was observed during daylight. Our results are best explained as a synchronized two-component trophic interaction with the per-capita rates of Prochlorococcus consumption driven either directly by the day/night cycle or indirectly by Prochlorococcus cell production. Light-driven synchrony of food web dynamics in which most of the newly produced Prochlorococcus cells are consumed each night likely enforces ecosystem stability across vast expanses of the open ocean.
Keywords: SeaFlow; cell division; cyanobacteria; flow cytometry; mortality.
Conflict of interest statement
The authors declare no conflict of interest.
Figures
References
-
- McCann KS. The diversity-stability debate. Nature. 2000;405(6783):228–233. - PubMed
-
- Rooney N, McCann K, Gellner G, Moore JC. Structural asymmetry and the stability of diverse food webs. Nature. 2006;442(7100):265–269. - PubMed
-
- Allesina S, Tang S. Stability criteria for complex ecosystems. Nature. 2012;483(7388):205–208. - PubMed
-
- Loreau M, de Mazancourt C. Biodiversity and ecosystem stability: A synthesis of underlying mechanisms. Ecol Lett. 2013;16(Suppl 1):106–115. - PubMed
Publication types
MeSH terms
LinkOut - more resources
Full Text Sources
Other Literature Sources
Molecular Biology Databases
