. 2015 Jun 30;112(26):8082-7.
doi: 10.1073/pnas.1504228112. Epub 2015 Jun 15.

Three cyanobacteriochromes work together to form a light color-sensitive input system for c-di-GMP signaling of cell aggregation

Affiliations

Three cyanobacteriochromes work together to form a light color-sensitive input system for c-di-GMP signaling of cell aggregation

Gen Enomoto et al. Proc Natl Acad Sci U S A. .

Abstract

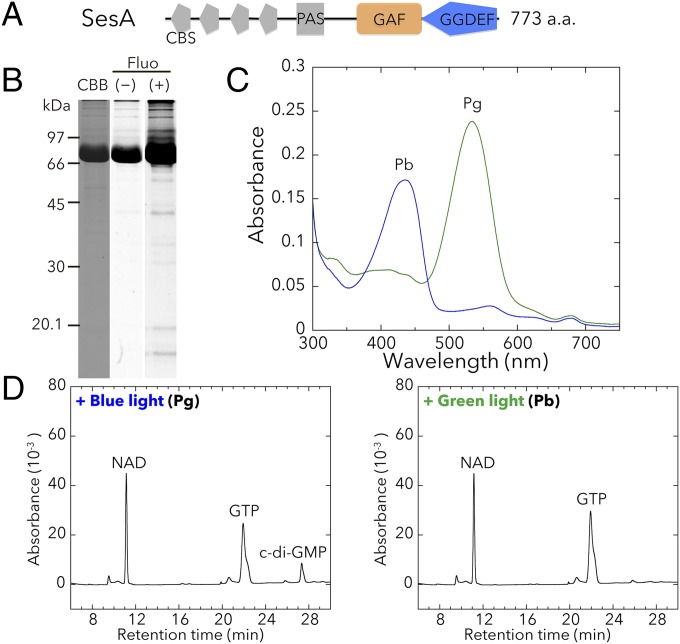
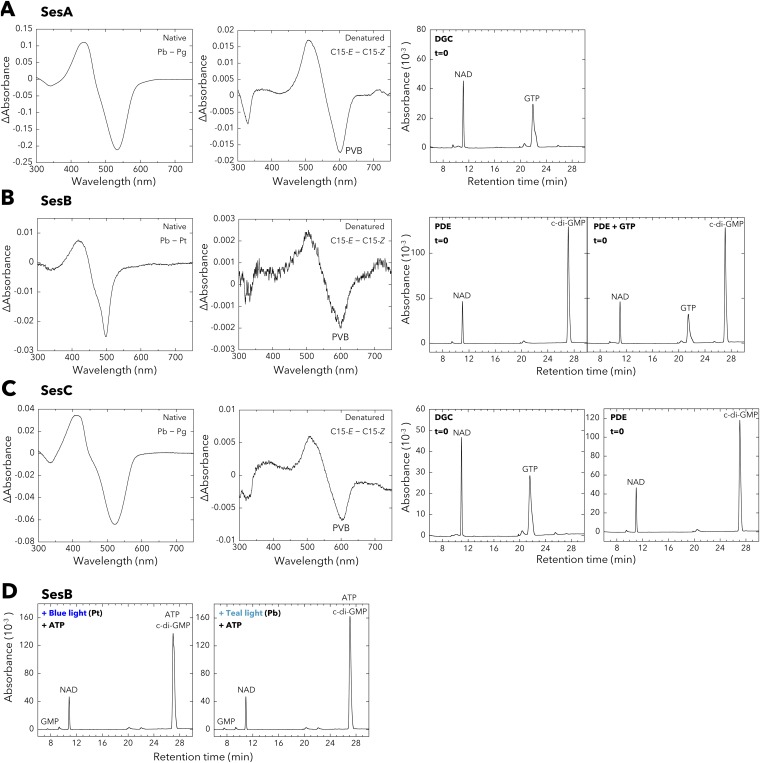
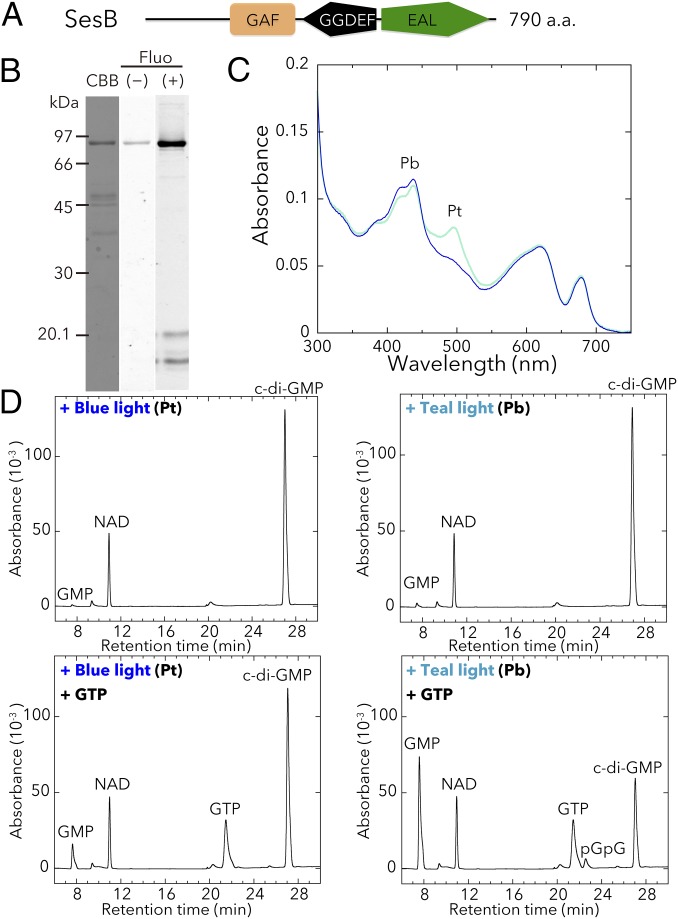
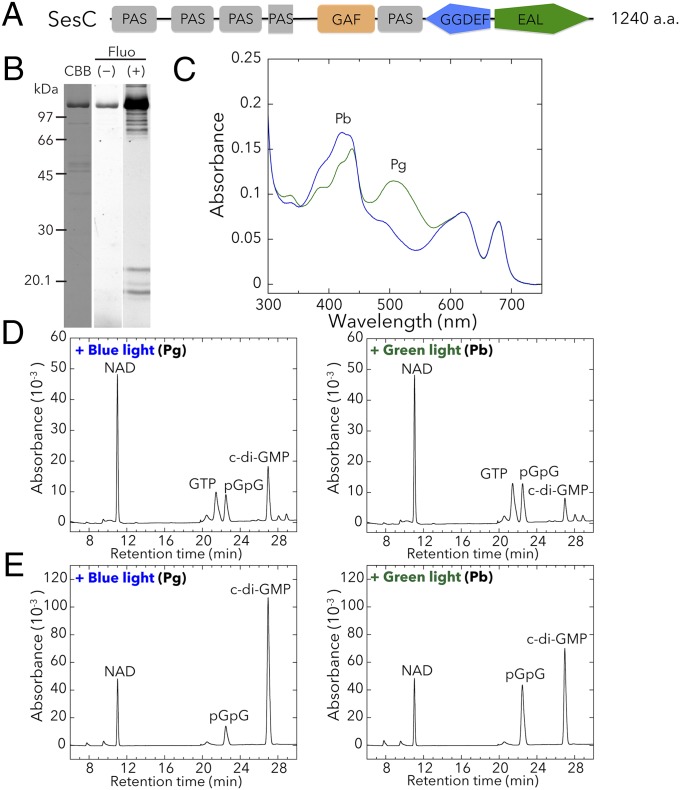
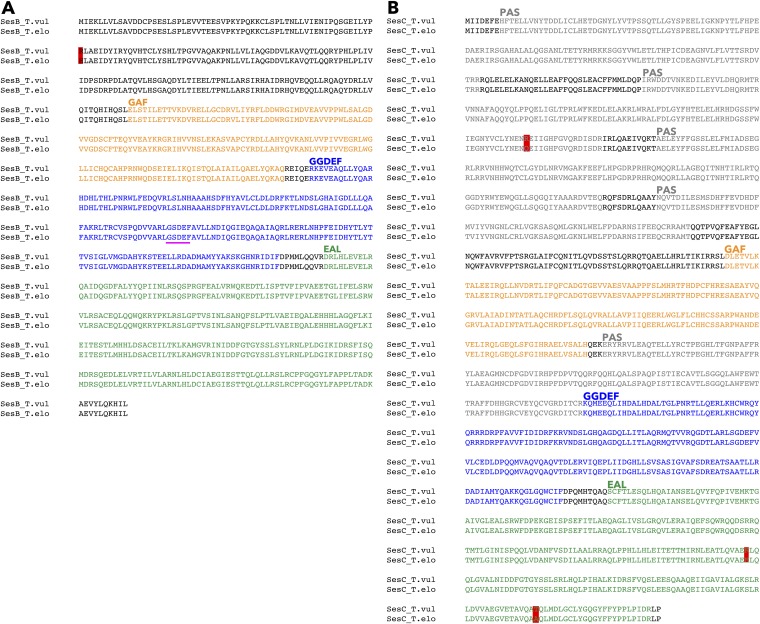
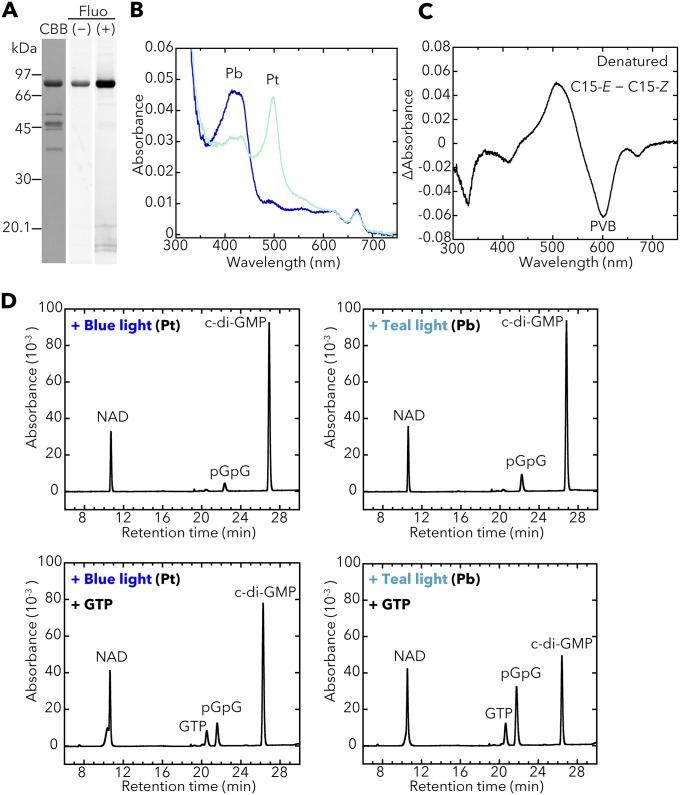
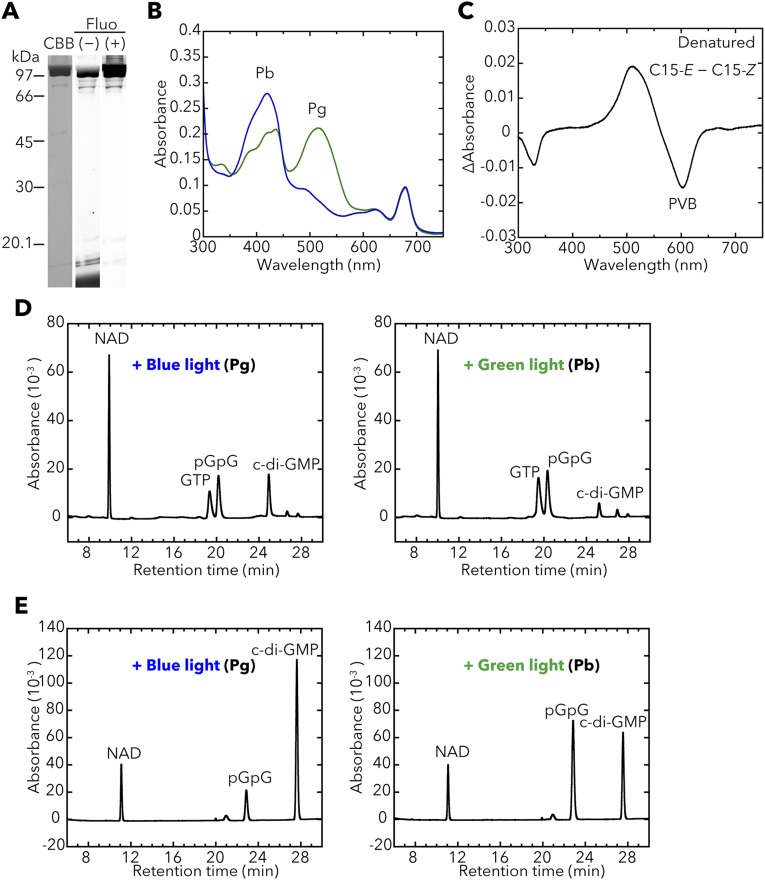
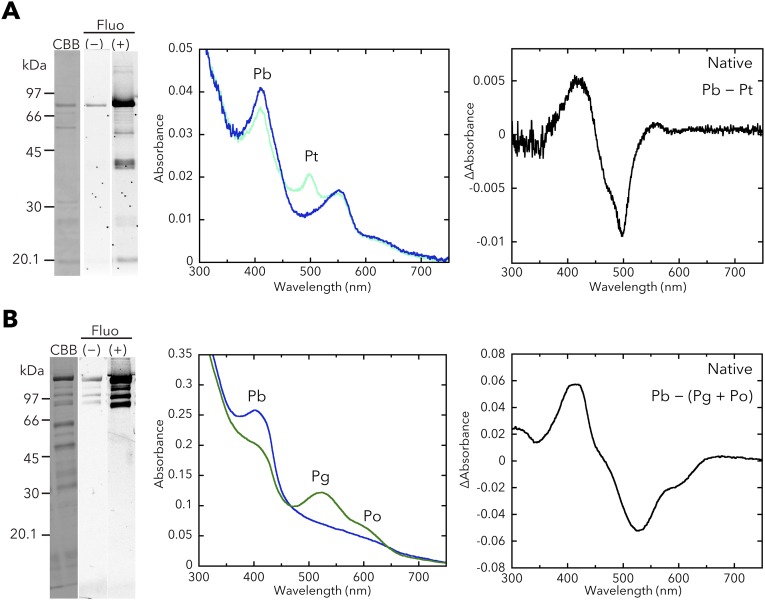
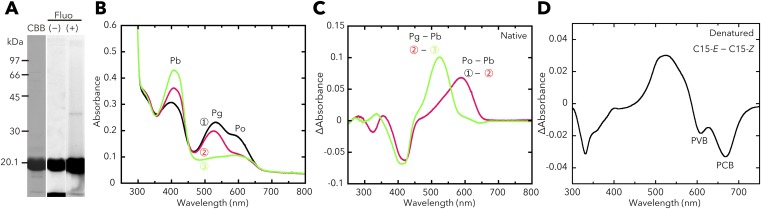
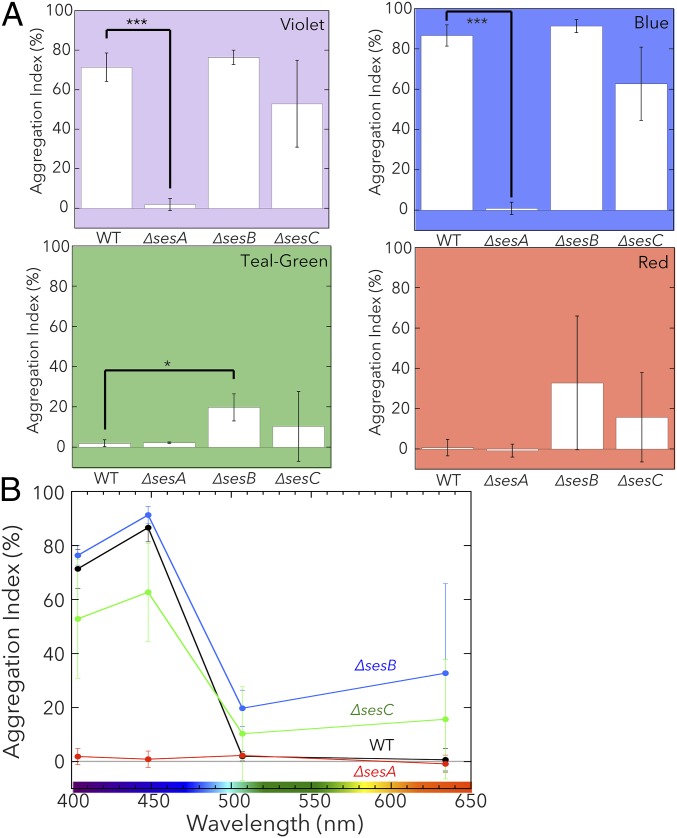
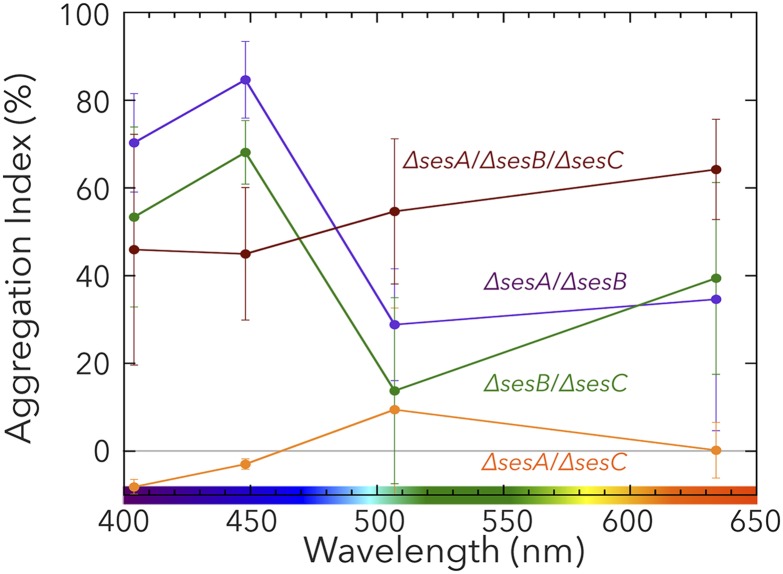
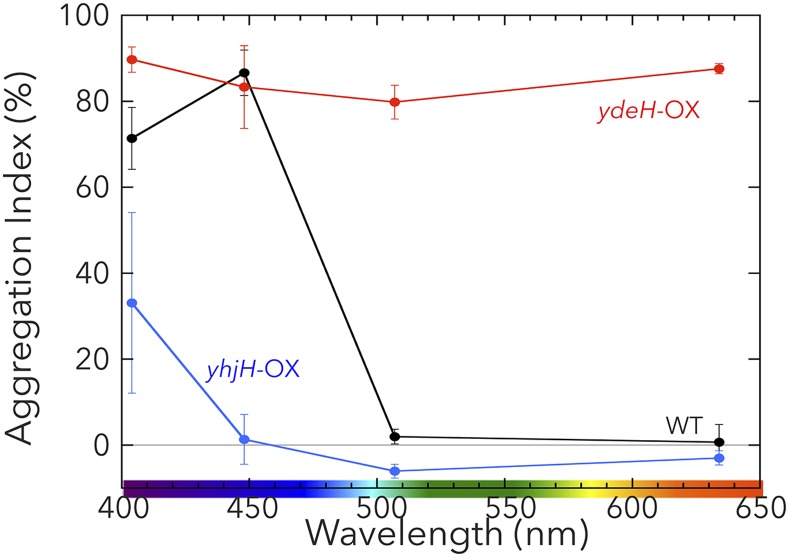
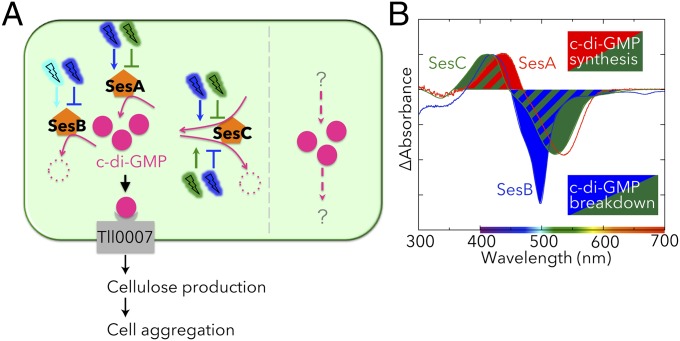
Cyanobacteriochromes (CBCRs) are cyanobacterial photoreceptors that have diverse spectral properties and domain compositions. Although large numbers of CBCR genes exist in cyanobacterial genomes, no studies have assessed whether multiple CBCRs work together. We recently showed that the diguanylate cyclase (DGC) activity of the CBCR SesA from Thermosynechococcus elongatus is activated by blue-light irradiation and that, when irradiated, SesA, via its product cyclic dimeric GMP (c-di-GMP), induces aggregation of Thermosynechococcus vulcanus cells at a temperature that is suboptimum for single-cell viability. For this report, we first characterize the photobiochemical properties of two additional CBCRs, SesB and SesC. Blue/teal light-responsive SesB has only c-di-GMP phosphodiesterase (PDE) activity, which is up-regulated by teal light and GTP. Blue/green light-responsive SesC has DGC and PDE activities. Its DGC activity is enhanced by blue light, whereas its PDE activity is enhanced by green light. A ΔsesB mutant cannot suppress cell aggregation under teal-green light. A ΔsesC mutant shows a less sensitive cell-aggregation response to ambient light. ΔsesA/ΔsesB/ΔsesC shows partial cell aggregation, which is accompanied by the loss of color dependency, implying that a nonphotoresponsive DGC(s) producing c-di-GMP can also induce the aggregation. The results suggest that SesB enhances the light color dependency of cell aggregation by degrading c-di-GMP, is particularly effective under teal light, and, therefore, seems to counteract the induction of cell aggregation by SesA. In addition, SesC seems to improve signaling specificity as an auxiliary backup to SesA/SesB activities. The coordinated action of these three CBCRs highlights why so many different CBCRs exist.

Keywords: light sensing; photoreceptors; second messenger; sessility; signal transduction.


Conflict of interest statement

The authors declare no conflict of interest.

Figures

Fig. 1.
Fig. 1.
Photobiochemical properties of T. vulcanus SesA. The full-length SesA holoprotein was prepared in and purified from the cyanobacterial expression system. (A) Domain composition of SesA (Tlr0924) deduced by SMART (smart.embl-heidelberg.de). CBS, cystathionine beta synthase; PAS, Per/ARNT/Sim. (B) SDS/PAGE of SesA after Coomassie brilliant blue (CBB) staining and fluorescence (Fluo) in the gel before (–) and after (+) Zn2+ addition. (C) Absorption spectra of native SesA Pb (blue line) after irradiation with green light, and SesA Pg (green line) after irradiation with blue light. (D) HPLC chromatograms assessing SesA DGC activity (GTP→c-di-GMP). NAD served as the internal control. Reaction mixtures, including 100 μM GTP, were incubated for 5 min under blue light (Left) or green light (Right).
Fig. S1.
Fig. S1.
Properties of the full-length T. vulcanus SesA, SesB, and SesC holoproteins expressed in and purified from the cyanobacterial expression system. (A, Left) Difference spectrum of the absorption spectra of native SesA Pb and Pg. (Middle) White light-induced difference spectrum of the chromophore (C15-E – C15-Z) for the urea/acid-denatured SesA. (Right) Control HPLC chromatogram for the DGC assay of SesA (incubation: 0 min). NAD served as the internal control. (B, Left) Difference spectrum of the absorption spectra of native SesB Pb and Pt. (Middle) White light-induced difference spectrum of the chromophore (C15-E – C15-Z) for the urea/acid-denatured SesB. (Right) Control HPLC chromatograms for the PDE assays of SesB (incubation: 0 min). NAD served as the internal control. (C, Left) Difference spectrum of the absorption spectra of native SesC Pb and Pg. (Middle) White light-induced difference spectrum of the chromophore (C15-E – C15-Z) for the urea/acid-denatured SesC. (Right) Control HPLC chromatograms for the DGC/PDE assays of SesC (incubation: 0 min). NAD served as the internal control. (D) SesB is a PDE (c-di-GMP→pGpG) that is not affected by ATP. NAD served as the internal control. Reaction mixtures including 100 µM c-di-GMP with 100 µM ATP were incubated for 10 min under blue light (Left) or teal light (Right).
Fig. 2.
Fig. 2.
Photobiochemical properties of T. vulcanus SesB. The full-length SesB holoprotein was prepared in and purified from the cyanobacterial expression system. (A) Domain composition of SesB (Tlr1999) deduced by SMART. (B) SDS/PAGE of SesB after CBB staining and the fluorescence in the gel before (–) and after (+) Zn2+ addition. (C) Absorption spectra of native SesB Pb (blue line) after irradiation with teal light, and SesB Pt (teal line) after irradiation with blue light. (D) HPLC chromatograms assessing SesB PDE activity (c-di-GMP→pGpG→GMP). NAD served as the internal control. The reaction mixtures including 100 μM c-di-GMP (substrate) were incubated for 10 min under blue light (Left) or teal light (Right). Addition of 100 μM GTP (Lower) under both light conditions enhanced PDE activity, compared with reactions performed without GTP (Upper).
Fig. 3.
Fig. 3.
Photobiochemical properties of T. vulcanus SesC. The full-length SesC holoprotein was prepared in and purified from the cyanobacterial expression system. (A) Domain composition of SesC (Tlr0911) deduced by SMART. (B) SDS/PAGE of SesC after CBB staining and the fluorescence in the gel before (–) and after (+) Zn2+ addition. (C) Absorption spectra of native SesC Pb (blue line) after irradiation with green light, and SesC Pg (green line) after irradiation with blue light. (D) HPLC chromatograms assessing SesC DGC activity (GTP→c-di-GMP). NAD served as the internal control. Reaction mixtures, including 100 μM GTP, were incubated for 10 min under blue light (Left) or green light (Right). pGpG was produced from c-di-GMP, the DGC product, via the accompanying SesC PDE activity. (E) HPLC chromatograms assessing SesC PDE activity (c-di-GMP→pGpG→GMP). NAD served as the internal control. The reaction mixtures, including 100 μM c-di-GMP, were incubated for 10 min under blue light (Left) or green light (Right).
Fig. S2.
Fig. S2.
(A) Amino acid sequence alignment of T. vulcanus and T. elongatus SesB. The degenerate motif in the GGDEF domain of SesB is underlined in magenta. The residue that differs in the two sequences is shaded red. (B) Amino acid sequence alignment of T. vulcanus and T. elongatus SesC. The residues that differ in the two sequences are shaded red.
Fig. S3.
Fig. S3.
Photobiochemical properties of the full-length T. elongatus SesB holoprotein expressed in and purified from the cyanobacterial expression system. (A) SDS/PAGE. CBB, Coomassie brilliant blue stain; Fluo, fluorescence before (–) and after (+) Zn2+ addition. (B) Photoconversion. The SesB Pb absorption spectrum induced by irradiation with teal light is shown in blue. The SesB Pt absorption spectrum induced by irradiation with blue light is shown in teal. (C) The white light-induced difference spectra of the chromophore (C15-E – C15-Z) for the urea/acid-denatured SesB. (D) SesB is a PDE (c-di-GMP→pGpG) activated by teal light and GTP. NAD served as the internal control. Reaction mixtures, including 100 µM c-di-GMP, were incubated for 10 min under blue light (Left) or teal light (Right). Addition of 100 µM GTP (Lower) under both light conditions enhanced PDE activity, compared with reactions performed without GTP (Upper).
Fig. S4.
Fig. S4.
Photobiochemical properties of the full-length T. elongatus SesC holoprotein expressed in and purified from the cyanobacterial expression system. (A) SDS/PAGE. (B) Photoconversion. The SesC Pb absorption spectrum induced by irradiation with green light is shown in blue. The SesC Pg absorption spectrum induced by blue-light irradiation is shown in green. (C) The white light-induced difference spectra of the chromophore (C15-E – C15-Z) for the urea/acid-denatured SesC. (D) SesC is a DGC (GTP→c-di-GMP) activated by blue light. NAD served as the internal control. Reaction mixtures, including 100 µM GTP, were incubated for 10 min under blue light (Left) or green light (Right). pGpG was produced from the DGC product, c-di-GMP, via SesC PDE activity. (E) SesC is a PDE (c-di-GMP→pGpG) activated by green light. NAD served as the internal control. The reaction mixtures, including 100 μM c-di-GMP, were incubated for 10 min under blue light (Left) or green light (Right).
Fig. S5.
Fig. S5.
Spectral properties of the full-length T. elongatus SesB and SesC holoproteins prepared in and purified from the E. coli expression system. (A) SesB. (Left) SDS/PAGE of SesB after CBB staining and fluorescence before (–) and after (+) Zn2+ addition. (Middle) Absorption spectra of native SesB Pb (blue line) after irradiation with teal light, and SesB Pt (teal line) after irradiation with blue light. (Right) Difference spectrum for SesB Pb and Pt. (B) SesC. (Left) SDS/PAGE of SesC after CBB staining and fluorescence before (–) and after (+) Zn2+ addition. (Middle) Absorption spectra of native SesC Pb (blue line) after irradiation with green and orange light, and SesC Pg and an orange light-absorbing form (Po) (green line) after irradiation with blue light. (Right) Difference spectrum for SesC Pb and Pg plus Po.
Fig. S6.
Fig. S6.
Two independent photoconversions of SecC PCB and PVB. The SesC-GAF protein was prepared in and purified from the E. coli expression system. (A) SDS/PAGE of SecC-GAF after CBB staining and fluorescence before (–) and after (+) Zn2+ addition. (B) Absorption spectra of native SesC-GAF after irradiation with blue light (black line; 1), then orange light (red line; 2), and finally green light (green line; 3). (C) Difference spectrum for the native SesC-GAF Pb and Po absorption spectra (red line), representing photoconversion of the PCB-bearing population, and the difference spectrum for the SesC-GAF Pb and Pg absorption spectra (green line), representing photoconversion of the PVB-bearing population. (D) The white light-induced difference spectra of the chromophore (C15-E – C15-Z) for the urea/acid-denatured SesC-GAF, representing the chromophore composition (PCB vs. PVB).
Fig. 4.
Fig. 4.
Light-induced cell aggregation of the T. vulcanus single gene-disrupted mutants. (A) Aggregation index values for wild type (WT) and its single gene-disrupted mutants (∆sesA, ∆sesB, and ∆sesC) (error bars report the SDs for three biological replicates). Cells were cultured at 31 °C for 48 h under light of a single wavelength (violet light, Upper Left; blue light, Upper Right; teal-green light, Lower Left). The cells were also cultured under only photosynthetic red light (Lower Right). Statistical significance was determined using Student’s t tests (*P < 0.05; ***P < 0.001). (B) Aggregation indexes for the single gene-disrupted mutants as a function of light wavelength using the data shown in A.
Fig. S7.
Fig. S7.
Energy spectra of the LEDs used for the cell-aggregation assays. A.U., arbitrary units.
Fig. 5.
Fig. 5.
Aggregation indexes for the T. vulcanus double (∆sesA/∆sesB, ∆sesA/∆sesC, and ∆sesB/∆sesC) and triple (∆sesA/∆sesB/∆sesC) gene-disrupted mutants as a function of light wavelength. Experiments were performed and the data are plotted as described in the legend for Fig. 4.
Fig. 6.
Fig. 6.
Aggregation indexes for the heterologous DGC/PDE expression mutants (ydeH-OX and yhjH-OX) as a function of light wavelength. ydeH-OX, the T. vulcanus mutant expressing the E. coli DGC, ydeH. yhjH-OX, the T. vulcanus mutant expressing the E. coli PDE, yhjH. The data for wild type are shown as a black line for comparison. Experiments were performed and the data are plotted as described in the legend for Fig. 4.
Fig. 7.
Fig. 7.
Coordination of the CBCRs SesA, SesB, and SesC that form a color-sensitive, highly specific c-di-GMP signaling system. (A) A signaling model for cell aggregation of Thermosynechococcus modulated SesA, SesB, and SesC. Under blue light, the DGC activities of SesA and SesC increase and the PDE activities of SesB and SesC decrease, leading to an increase in c-di-GMP levels. C-di-GMP binds to the PilZ domain of cellulose synthase Tll0007 and activates it, resulting in cell aggregation. Under teal-green light, the DGC activities of SesA and SesC are decreased and the PDE activities of SesB and SesC are increased, leading to a decrease in c-di-GMP levels. In the absence of c-di-GMP, the cellulose-synthesizing activity of Tll0007 is silenced and cell aggregation is not triggered. Thermosynechococcus probably contains a light-independent c-di-GMP signaling pathway(s), which has not been characterized. (B) The difference spectra for the photoforms of SesA, SesB, and SesC. SesA produces c-di-GMP under blue light but SesB degrades it under teal light, thereby confining the wavelength range that induces an increase in c-di-GMP levels to shorter wavelengths. SesC produces c-di-GMP at shorter wavelengths than does SesA, and degrades it at longer wavelengths than does SesB. SesC can, therefore, broaden the effective wavelength range without impacting the color specificity of c-di-GMP net synthesis.

References

    1. Gan F, et al. Extensive remodeling of a cyanobacterial photosynthetic apparatus in far-red light. Science. 2014;345(6202):1312–1317. - PubMed
    1. Kehoe DM, Gutu A. Responding to color: The regulation of complementary chromatic adaptation. Annu Rev Plant Biol. 2006;57:127–150. - PubMed
    1. Hirose Y, et al. Green/red cyanobacteriochromes regulate complementary chromatic acclimation via a protochromic photocycle. Proc Natl Acad Sci USA. 2013;110(13):4974–4979. - PMC - PubMed
    1. Yoshihara S, Ikeuchi M. Phototactic motility in the unicellular cyanobacterium Synechocystis sp. PCC 6803. Photochem Photobiol Sci. 2004;3(6):512–518. - PubMed
    1. Savakis P, et al. Light-induced alteration of c-di-GMP level controls motility of Synechocystis sp. PCC 6803. Mol Microbiol. 2012;85(2):239–251. - PubMed

Publication types

Substances

LinkOut - more resources