. 2015 Jun 30;112(26):8002-7.
doi: 10.1073/pnas.1505822112. Epub 2015 Jun 15.

Functional organization of the human 4D Nucleome

Affiliations

Functional organization of the human 4D Nucleome

Haiming Chen et al. Proc Natl Acad Sci U S A. .

Abstract

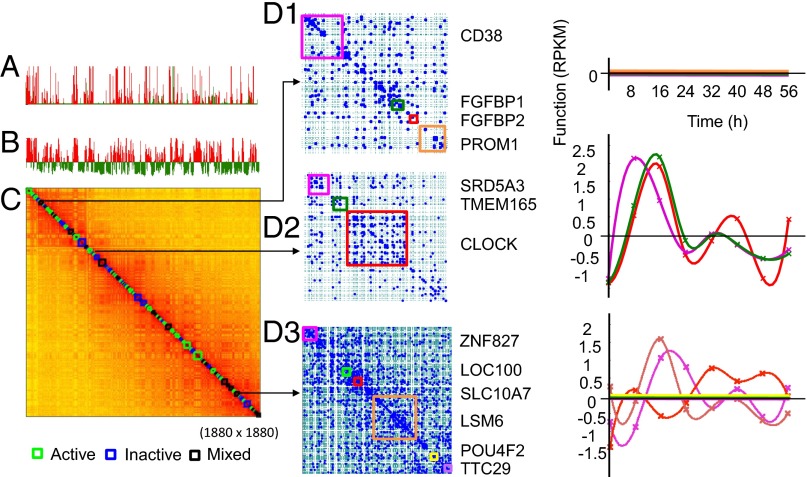
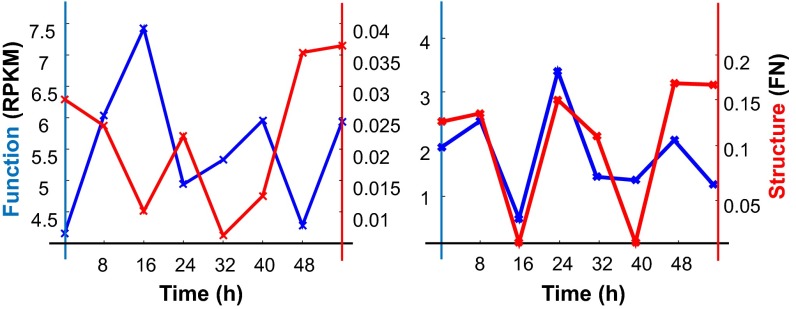
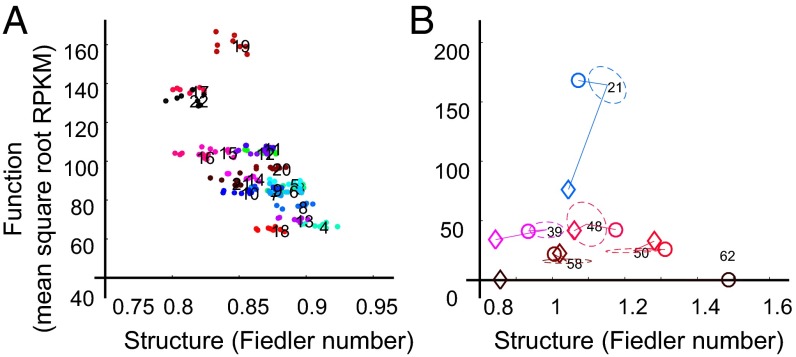
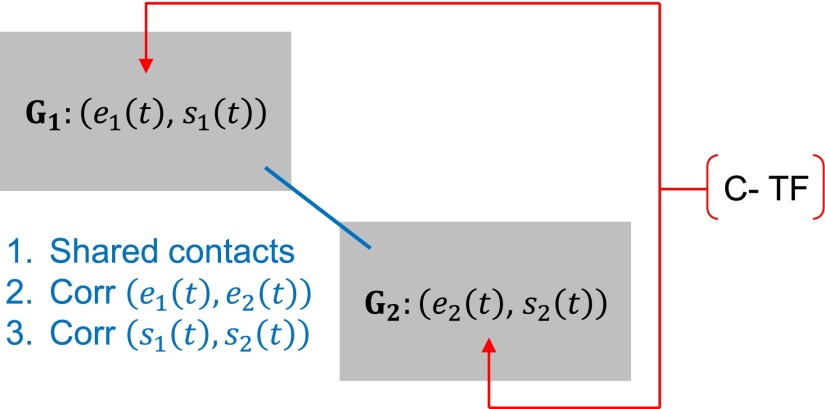
The 4D organization of the interphase nucleus, or the 4D Nucleome (4DN), reflects a dynamical interaction between 3D genome structure and function and its relationship to phenotype. We present initial analyses of the human 4DN, capturing genome-wide structure using chromosome conformation capture and 3D imaging, and function using RNA-sequencing. We introduce a quantitative index that measures underlying topological stability of a genomic region. Our results show that structural features of genomic regions correlate with function with surprising persistence over time. Furthermore, constructing genome-wide gene-level contact maps aided in identifying gene pairs with high potential for coregulation and colocalization in a manner consistent with expression via transcription factories. We additionally use 2D phase planes to visualize patterns in 4DN data. Finally, we evaluated gene pairs within a circadian gene module using 3D imaging, and found periodicity in the movement of clock circadian regulator and period circadian clock 2 relative to each other that followed a circadian rhythm and entrained with their expression.

Keywords: 4D Nucleome; Laplacian; interphase nucleus; networks; phase plane.


Conflict of interest statement

The authors declare no conflict of interest.

Figures

Fig. 1.
Fig. 1.
TAD and corresponding gene expression dynamics of chromosome 4 (Chr 4). (A) Mean RNA-seq counts [reads per kilobase length per million reads (RPKM)] of binned genes]. (B) Fiedler vector computed from the normalized Hi-C matrix. Red bins are the genes associated with the positive Fiedler vector entries, and green bins are the genes associated with negative Fiedler vector entries. (C) Hi-C matrix of Chr 4 with activity of identified TADs annotated by colored boxes on the diagonal. Active (green), inactive (blue), or mixed (black) TADs contain genes that are all actively transcribed, repressed, or a mix of both, respectively. (D1) Fragment read contact map of an inactive TAD with genes annotated by color (Left) or no detectable transcripts from any genes in this TAD over time (Right), with individual genes colored corresponding to the maps (Left). (D2) Fragment read contact map of an active TAD (Left) or active transcription of all genes in this TAD over time (Right). (D3, Left) Fragment read contact map of a mixed TAD. (D3, Right) Expression patterns of its genes are both active and inactive over time. Dashed green lines on the maps indicate HindIII cutting sites.
Fig. 2.
Fig. 2.
Gene dynamics. S-F dynamics of CLOCK (Left) and PER2 (Right).
Fig. 3.
Fig. 3.
Four-dimensional Nucleome phase plane. (A) Phase plane for Chr 1–22. (B) Phase plane for six representative TADs from Chr 4 across three cell types. Fundamental differences are seen in TAD coordinates in ES cells (○) and lymphoblastoid cells (♢) compared with the coordinates of fibroblast TAD domains (dashed ellipses).
Fig. 4.
Fig. 4.
Synthetic transcription factory (STF). G1 and G2 are two genes, where e1(t) and e2(t) are their expression levels over time and s1(t) and s2(t) are their structural changes over time. The potential for interaction between G1 and G2 can be defined with (i) shared contacts, (ii) the correlation between their expression [Corr(e1(t), e2(t))], (iii) the correlation between their structures [Corr(s1(t),s2(t))], and (iv) common transcription factors (C-TF), as determined by common binding motifs and expression of the transcription factors in our RNA-seq data. If conditions 1–4 are satisfied, the two genes have high potential for common regulation via shared transcriptional space, consistent with a transcription factory model.
Fig. 5.
Fig. 5.
Networks of dynamic intracorrelated and intercorrelated S-F gene pairs on Chr 14. Green nodes represent genes, and thick edges between pairs of genes represent a correlation. (Inset) Colors of edges show how the two genes are correlated (color key). Genes with transcription factors in common with all other genes that share edges are denoted by shaded blue squares. Transcription factors associated with gene pairs are shown in SI Appendix, Dataset S10.
Fig. 6.
Fig. 6.
Processing of 3D-FISH raw data maximum projection images (MPIs). (A) Cartesian coordinate system is superimposed after fitting nuclei to an ellipse. Red, cyan, white, and magenta points represent probe signals for PER2, cryptochrome 1 (CRY1), aryl hydrocarbon receptor nuclear translocator-like (ARNTL), and CLOCK, respectively. (B) RNA-seq data over time are plotted on the left y axis for CLOCK [solid blue line (L)] and PER2 (solid green L) in RPKM. MCD in micrometers (dashed black L) and Fiedler number (dashed red L) between CLOCK and PER2 over time are plotted on the right y axis.
Fig. 7.
Fig. 7.
CLOCK/PER2 circuit. (A) Proposed feedback circuit for CLOCK and PER2 expression, where CLOCK may self-activate. (B) Relative expression of CLOCK and PER2 (green arrows) at given relative Euclidian distances (purple arrows).

References

    1. Cavalli G, Misteli T. Functional implications of genome topology. Nat Struct Mol Biol. 2013;20(3):290–299. - PMC - PubMed
    1. Rajapakse I, Groudine M. On emerging nuclear order. J Cell Biol. 2011;192(5):711–721. - PMC - PubMed
    1. Babaei S, Akhtar W, de Jong J, Reinders M, de Ridder J. 3D hotspots of recurrent retroviral insertions reveal long-range interactions with cancer genes. Nat Commun. 2015;6(6381):6381. - PMC - PubMed
    1. Naumova N, et al. Organization of the mitotic chromosome. Science. 2013;342(6161):948–953. - PMC - PubMed
    1. Dixon JR, et al. Chromatin architecture reorganization during stem cell differentiation. Nature. 2015;518(7539):331–336. - PMC - PubMed

Publication types