. 2015 Jun 30;112(26):E3384-91.
doi: 10.1073/pnas.1508821112. Epub 2015 Jun 15.

Next-generation libraries for robust RNA interference-based genome-wide screens

Affiliations

Next-generation libraries for robust RNA interference-based genome-wide screens

Martin Kampmann et al. Proc Natl Acad Sci U S A. .

Abstract

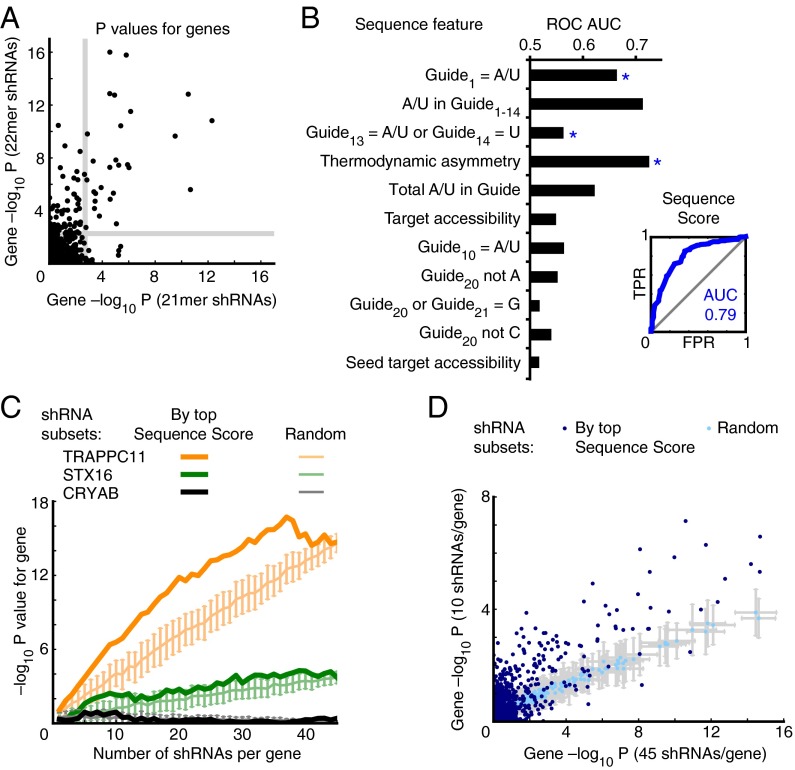
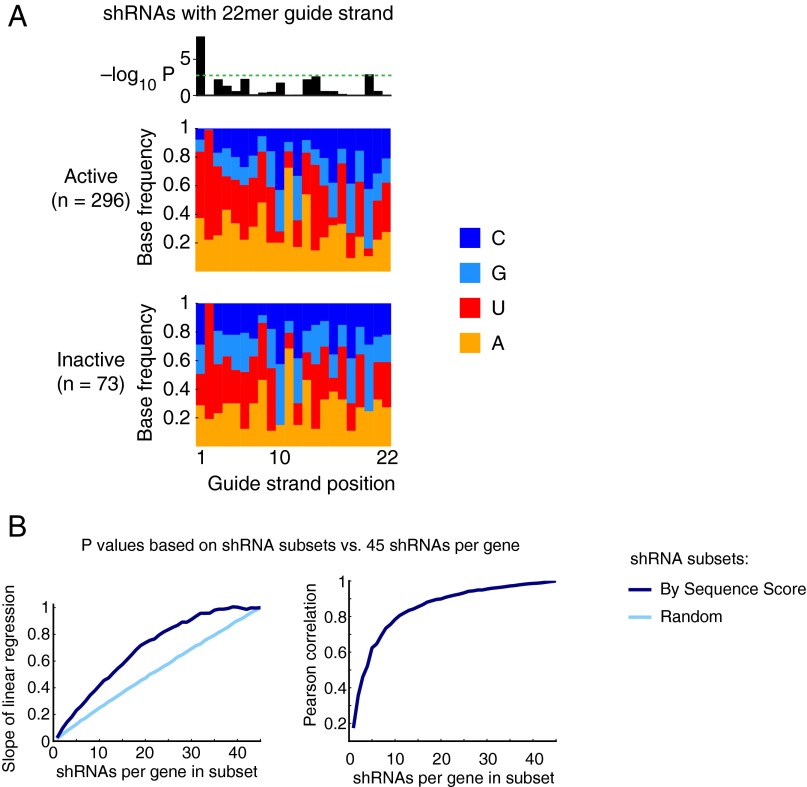
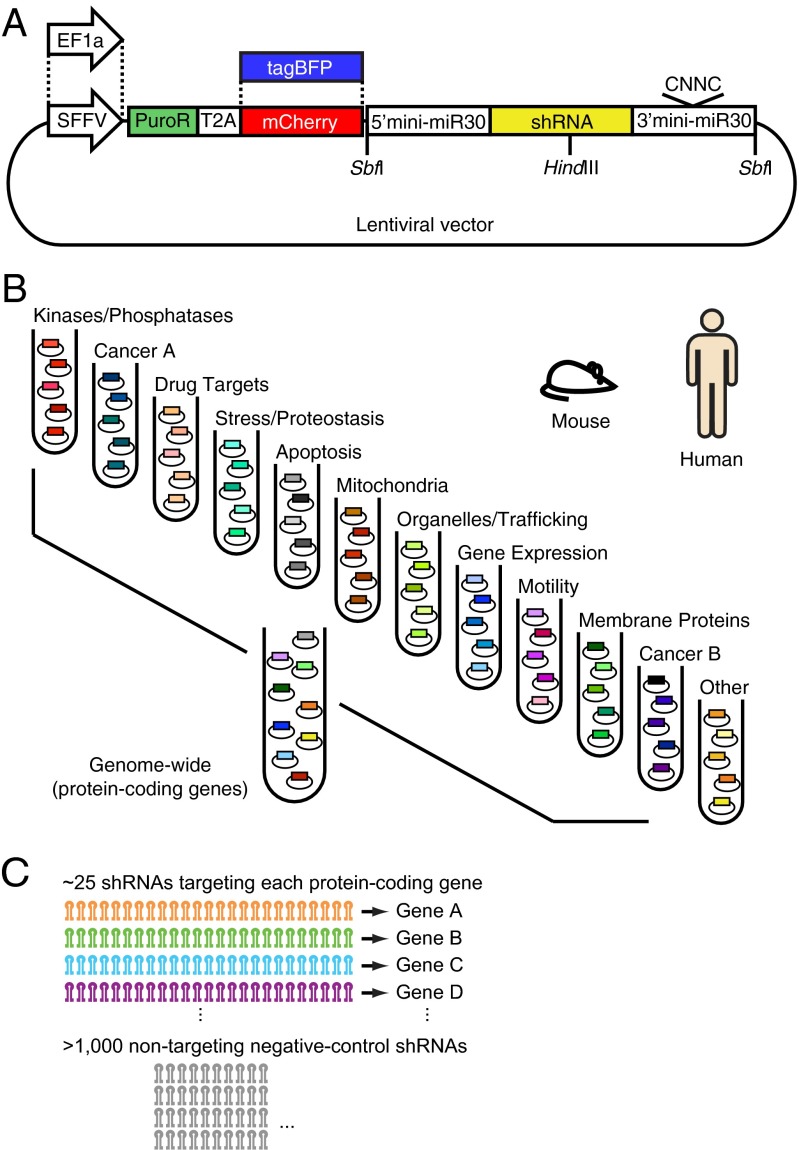
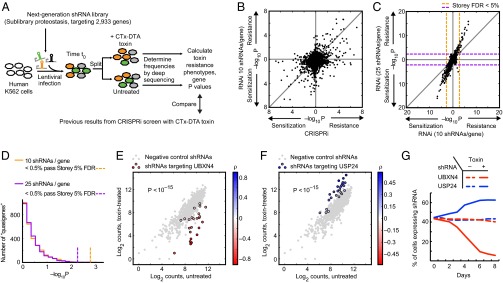
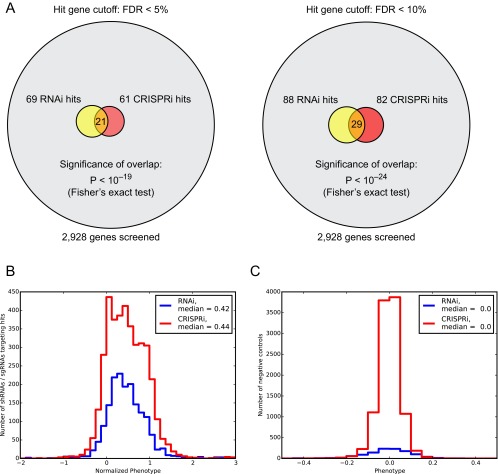
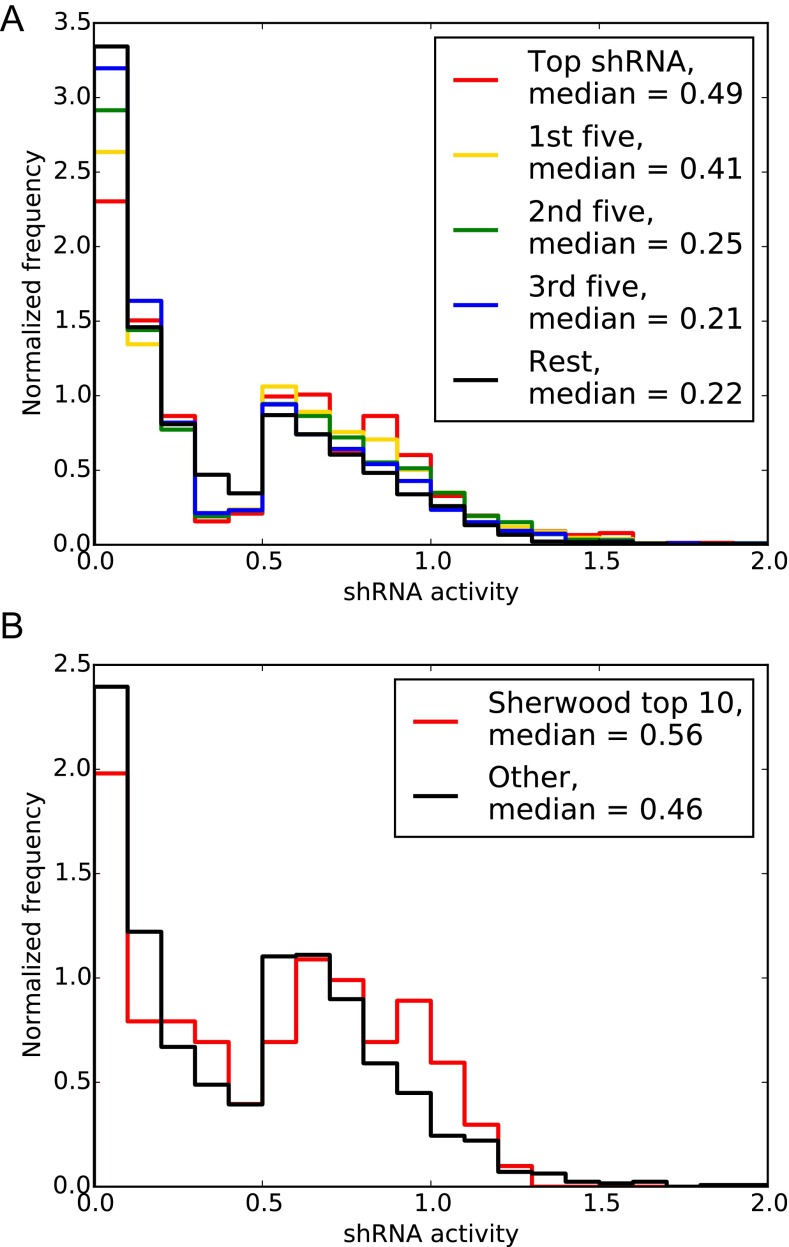
Genetic screening based on loss-of-function phenotypes is a powerful discovery tool in biology. Although the recent development of clustered regularly interspaced short palindromic repeats (CRISPR)-based screening approaches in mammalian cell culture has enormous potential, RNA interference (RNAi)-based screening remains the method of choice in several biological contexts. We previously demonstrated that ultracomplex pooled short-hairpin RNA (shRNA) libraries can largely overcome the problem of RNAi off-target effects in genome-wide screens. Here, we systematically optimize several aspects of our shRNA library, including the promoter and microRNA context for shRNA expression, selection of guide strands, and features relevant for postscreen sample preparation for deep sequencing. We present next-generation high-complexity libraries targeting human and mouse protein-coding genes, which we grouped into 12 sublibraries based on biological function. A pilot screen suggests that our next-generation RNAi library performs comparably to current CRISPR interference (CRISPRi)-based approaches and can yield complementary results with high sensitivity and high specificity.

Keywords: functional genomics; genetic screen; microRNA; pooled screen; shRNA.


Conflict of interest statement

The authors declare no conflict of interest.

Figures

Fig. S1.
Fig. S1.
Cumulative distribution of the 5′ end homogeneity scores of endogenous miRNA precursors (line). Those selected in this study as templates are indicated with dots. A homogeneity score was obtained from the ratios between the counts of reads that match the most frequent 5′ end and total reads mapped to a miRBase hairpin. The ratio was calculated only when 100 or more reads were mapped to a hairpin. The fifth percentile of the ratios throughout the reference samples was chosen as a homogeneity score for a hairpin. Hairpins with ratio values calculated using 10 or more reference samples were used in this analysis. See Dataset S1 for the detailed list of scores and for the list of reference samples used for the analysis.
Fig. 1.
Fig. 1.
Massively parallel comparison of miRNA contexts for shRNA expression. (A) Experimental strategy to test performance of different miRNA contexts and variants for shRNA expression in a pooled genetic screen. Guides targeting genes with known ricin resistance phenotypes were selected, along with negative-control guides. These were expressed in 79 different shRNA formats, which were variations on 11 endogenous human miRNA contexts. The resulting pooled library of >100,000 different shRNAs was introduced into the human K562 cell line using lentiviral infections. The cells were grown untreated or treated with ricin, and the frequencies of cells expressing a given shRNA in these two populations were determined using deep sequencing. From these data, ricin-resistance phenotypes were calculated for all shRNAs. (B) Comparison of 79 formats with respect to three metrics derived from the pooled screen: On-target effect (x axis, a measure of phenotype strength across all ricin hit genes), off-target effects (y axis, a measure of the deviation from wild-type for negative-control shRNAs), and hit detection (heat map, a measure of the statistical significance of detecting ricin hit genes). Metrics are defined quantitatively in Materials and Methods. In several instances, formats derived from the same miRNA context show similar performance across the three metrics (dashed ovals). (C) Comparison of ricin resistance phenotypes for shRNAs targeting TRAPPC8 (red circles) and negative-control shRNAs (empty circles) expressed either in a miR-30a–standard context or a miR-100–bulge context. Phenotypes of targeted shRNAs were correlated between the two expression formats.
Fig. S2.
Fig. S2.
Results from a pooled screen comparing shRNA expression formats (Fig. 1A). (A) Correlation of shRNA phenotypes for a given expression format with phenotypes obtained with the standard format miR-30a (mir30a_s) for each targeted gene. The heatmap encodes Pearson correlation coefficients R. (B) Gene-based P values for each expression format. The heatmap encodes −log10 P values.
Fig. 2.
Fig. 2.
Individual characterization of shRNA expression formats. (A) Variations of the miR-30a context. (Upper) A point mutation (red) in the sequence downstream of the hairpin creates an EcoRI site (underlined) in the encoding DNA. This destroys the CNNC motif (underlined in purple) shown to be important for miR-30a processing (15). (Lower) Two point mutations (red) in the hairpin loop create a HindIII site (underlined) in the encoding DNA. (B and C) An shRNA targeting GFP was expressed in different formats in a K562 cell line stably expressing GFP. Median GFP fluorescence was quantified by flow cytometry, and is normalized to GFP fluorescence in a cell line with a negative-control expression construct lacking a hairpin. The dotted line indicates the level of GFP fluorescence for the expression format we have previously used (EF1a promoter, EcoRI context, WT loop). (B) shRNA expressed from the WT context resulted in stronger knockdown compared with EcoRI context. Introduction of HindIII in the loop was not detrimental. (C) In K562 cells, expression from the SFFV promoter resulted in stronger knockdown than expression from the EF1a promoter.
Fig. 3.
Fig. 3.
A sequence score predictive of shRNA performance. (A) Comparison of 21mer vs. 22mer guide design. Two shRNA libraries targeting the same set of 1,079 genes each with 50 21mer guide strands vs. 50 22mer guide strands were used in a ricin resistance experiment. P values for each gene were calculated based the data from the two libraries. Gray line: cut-off for 5% FDR. (B) Sequence features as predictors of 22mer shRNA activity. Phenotypes of 22mer shRNAs targeting ricin hit genes were measured in a batch experiment and shRNAs were classifed as active or inactive. Features (quantitatively defined in Table S1) were target accessibility as predicted from the secondary structure stability of the mRNA context of the shRNA target, and modified versions of the sensor rules (18). (Left) Areas under the receiver operating characteristic curve (ROC AUC) for sensor rules used as quantitative metrics. Stepwise forward logistic regression was used to create an integrated sequence score predicting shRNA activity (Table S2). Features included in the sequence scores are marked by asterisks. (Right) ROC curve for the sequence score; FPR, false-positive rate; TPR, true positive rate. (C and D) Based on shRNA phenotypes in a ricin-resistance screen targeting genes with 50 shRNAs each, P values for each gene were calculated on the basis of subsets of the data; the number of shRNAs included per gene was varied. shRNA subsets were either chosen randomly 100 times, and means of −log10 of P values are shown, with error bars indicating SD, or shRNA subsets were chosen based on the highest sequence scores. (C) Results are shown for three representative genes: a strong hit (RAB1A), a moderate hit (STX16), and a nonhit (CRYAB). For the purpose of this analysis, sequence scores were created based on a dataset from which shRNAs targeting RAB1A, STX16 and CRYAB were excluded (Table S2). (D) P values calculated based on 45 shRNAs per gene are compared with P values calculated based on 10 shRNAs per gene for all 1,079 genes targeted by Library 2. Subsets were either chosen randomly (light blue) or based on their sequence score (dark blue). Sequence scores for individual shRNAs were calculated based on data subsets excluding these specific shRNAs, as described in SI Materials and Methods.
Fig. S3.
Fig. S3.
(A) Comparison of base frequencies at each guide strand position for active and inactive shRNAs. (Upper) −Log10 of P values indicating significant differences between base frequencies in active and inactive shRNAs (χ2 test). The dotted green line indicates a Bonferroni-corrected significance level of 0.05. (Lower) Bars indicating base frequencies at each guide strand position for active and inactive shRNAs. (B) As in Fig. 3D, P values calculated based on shRNA subsets were compared with P values calculated based on 45 shRNAs per gene. (Left) Slope of the linear regression for this comparison and (Right) the Pearson correlation coefficient, both as a function of shRNA subset size. Subsets were either chosen randomly (light blue) or based on their sequence score (dark blue).
Fig. 4.
Fig. 4.
Next-generation library design. (A) We generated a set of lentiviral expression vectors for use with the next-generation library to provide compatibility with different target cell lines and applications. Promoters: EF1a or SFFV. Fluorescent marker: mCherry or tagBFP. All vectors express the shRNA from a minimal miR-30a context that preserves the WT CNNC motif, and is embedded between SbfI sites for size fractionation and SPRI bead purification. A HindIII restriction site was introduced in the region encoding the hairpin loop. (B) Human and mouse protein-coding genes were grouped into 12 biological categories, each of which is targeted by an shRNA sublibrary that together constitute genome-wide libraries. (C) Each gene is targeted by 25 shRNAs on average. Each sublibrary also contains >1,000 negative-control shRNAs that follow the same design rules as targeted shRNAs, but have no target in the human/mouse transcriptome.
Fig. 5.
Fig. 5.
Robust detection of hit genes in a pilot screen. (A) We used the sublibrary Proteostasis of our next-generation shRNA library to screen human K562 cells for genes controlling growth and sensitivity to a cholera-diphtheria fusion toxin CTx-DTA (27). P values were calculated for each of the 2,933 genes targeted by the library. (B) P values for CTx-DTA resistance phenotypes obtained with our published CRISPRi library (1) or our next-generation RNAi library (computationally downsampled to 10 shRNAs per gene to match coverage of the CRISPRi library) agree broadly. (C) The coverage of 25 shRNAs per gene of our next-generation shRNA library detects hit genes with strongly increased statistical significance compared with a 10 shRNA per gene library. Dotted lines indicate the 5% FDR cut-off calculated using the Storey and Tibshirani approach (21). (D) Quasi-genes were generated by grouping random sets of negative-control shRNAs and calculating P values for them. The distributions of P values are not significantly different for 25 shRNAs per gene or 10 shRNAs per gene (Mann–Whitney u test). Less than 0.5% of quasi-genes pass the P value threshold corresponding to the 5% FDR calculated using the Storey and Tibshirani approach. (E–G) UBXN4, encoding a protein involved in endoplasmic reticulum-associated degradation, and USP24, encoding a ubiquitin peptidase, were two hit genes from the CTx-DTA screen. (E and F) Phenotypes of the shRNAs targeting UBXN4 and USP24 compared with the negative-control phenotypes reveals a consistent shift toward sensitization (UBXN4) or resistance (USP24). (G) Competitive growth experiment validates UBXN4 and USP24 phenotypes. K562 cells where infected with lentivirus at a multiplicity of infection of ∼0.5 expressing an shRNA targeting UBXN4 or USP24, as well as an mCherry marker that allowed monitoring of the percentage of cells expressing shRNAs. Cells were either treated with CTx-DTA toxin or grown untreated. The percentage of each cell expressing shRNAs was monitored over 8 d. UBXN4 knockdown sensitized to the toxin, whereas USP24 knockdown conferred resistance.
Fig. S4.
Fig. S4.
(A) Overlap in hit genes called at different FDR cut-offs by our CRISPRi and next-generation RNAi screens for CTx-DTA resistance phenotypes. (B) Comparison of phenotype distributions of 25 shRNAs vs. 10 sgRNAs targeting hit genes (5% FDR cut-off), normalized by dividing by the average of the three strongest shRNA/sgRNA phenotypes for a given gene. (C) Comparison of phenotypes of negative-control shRNAs/sgRNAs. Standard deviations of the negative-control phenotypes were 0.11 for RNAi and 0.05 for CRISPRi.
Fig. S5.
Fig. S5.
(A) Performance of shRNAs in the next-generation shRNA library that were ranked based on their sequence score. (B) Performance of a subset of shRNAs in the next-generation shRNA library that were grouped on whether they are among the top 10 shRNAs predicted by the Sherwood algorithm or not. shRNA activity for shRNA hit genes was normalized for each gene.

References

    1. Gilbert LA, et al. Genome-Scale CRISPR-mediated control of gene repression and activation. Cell. 2014;159(3):647–661. - PMC - PubMed
    1. Koike-Yusa H, Li Y, Tan EP, Velasco-Herrera MdelC, Yusa K. Genome-wide recessive genetic screening in mammalian cells with a lentiviral CRISPR-guide RNA library. Nat Biotechnol. 2014;32(3):267–273. - PubMed
    1. Wang T, Wei JJ, Sabatini DM, Lander ES. Genetic screens in human cells using the CRISPR-Cas9 system. Science. 2014;343(6166):80–84. - PMC - PubMed
    1. Shalem O, et al. Genome-scale CRISPR-Cas9 knockout screening in human cells. Science. 2014;343(6166):84–87. - PMC - PubMed
    1. Kampmann M, Bassik MC, Weissman JS. Integrated platform for genome-wide screening and construction of high-density genetic interaction maps in mammalian cells. Proc Natl Acad Sci USA. 2013;110(25):E2317–E2326. - PMC - PubMed

Publication types

Substances