. 2015 Sep;23(9):1465-74.
doi: 10.1038/mt.2015.113. Epub 2015 Jun 17.

miRNA-embedded shRNAs for Lineage-specific BCL11A Knockdown and Hemoglobin F Induction

Affiliations

miRNA-embedded shRNAs for Lineage-specific BCL11A Knockdown and Hemoglobin F Induction

Swaroopa Guda et al. Mol Ther. 2015 Sep.

Abstract

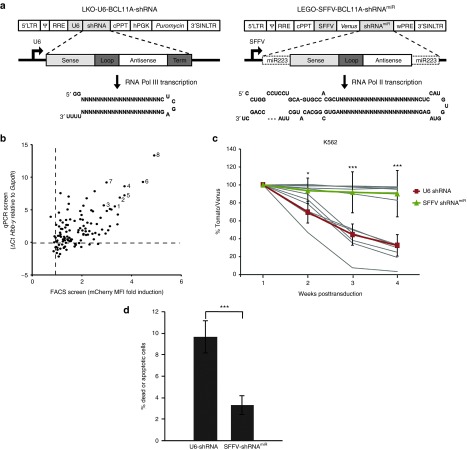
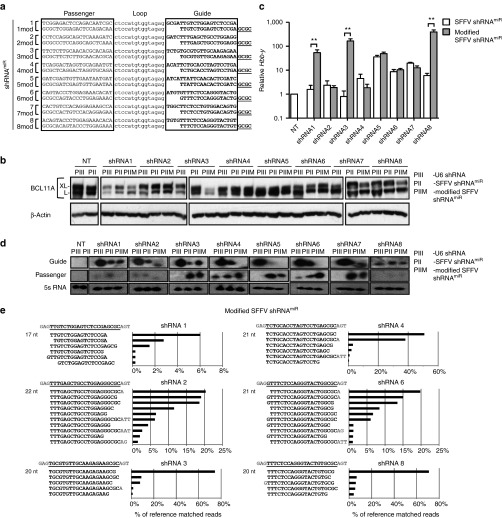
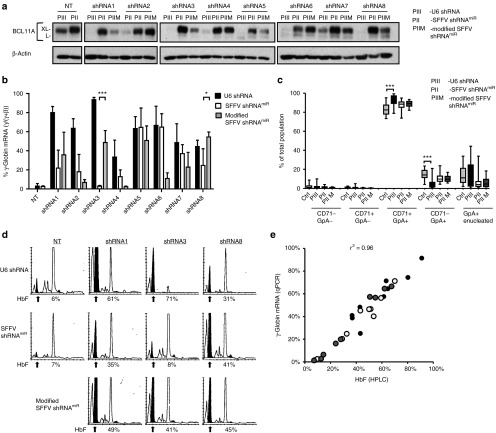
RNA interference (RNAi) technology using short hairpin RNAs (shRNAs) expressed via RNA polymerase (pol) III promoters has been widely exploited to modulate gene expression in a variety of mammalian cell types. For certain applications, such as lineage-specific knockdown, embedding targeting sequences into pol II-driven microRNA (miRNA) architecture is required. Here, using the potential therapeutic target BCL11A, we demonstrate that pol III-driven shRNAs lead to significantly increased knockdown but also increased cytotoxcity in comparison to pol II-driven miRNA adapted shRNAs (shRNA(miR)) in multiple hematopoietic cell lines. We show that the two expression systems yield mature guide strand sequences that differ by a 4 bp shift. This results in alternate seed sequences and consequently influences the efficacy of target gene knockdown. Incorporating a corresponding 4 bp shift into the guide strand of shRNA(miR)s resulted in improved knockdown efficiency of BCL11A. This was associated with a significant de-repression of the hemoglobin target of BCL11A, human γ-globin or the murine homolog Hbb-y. Our results suggest the requirement for optimization of shRNA sequences upon incorporation into a miRNA backbone. These findings have important implications in future design of shRNA(miR)s for RNAi-based therapy in hemoglobinopathies and other diseases requiring lineage-specific expression of gene silencing sequences.


Figures

Figure 1
Figure 1
Screening of shRNAs targeting BCL11A in pol III system and assessment of cytotoxicity among pol III and pol II expression systems. (a) Schematic representation of LKO-U6-BCL11A-shRNA (left side) and LEGO-SFFV-BCL11A-shRNAmiR (right side). The light gray boxes represent the sense strand; white boxes represent the antisense strand; dark gray boxes represent the loop structure, and the miRNA223 scaffold is indicated by a dotted line. The hairpin structures are shown below. (b) High-throughput screening of multiple shRNA sequences targeting BCL11A mRNA for knockdown efficiency using pol III-based lentivirus vectors. Both induction of Hbb-y mRNA by qRT-PCR and induction of mCherry reporter by FACS (as a surrogate for ɛ -y induction in a reporter cell line) were used as a functional readout for BCL11a knockdown. Normalized expression of Hbb-y mRNA relative to nontargeting control is plotted on y-axis and fold induction of mCherry expression (by mean fluorescence intensity, MFI) relative to nontransduced control is plotted on x-axis. (c) Comparative assessment of shRNA and shRNAmiR induced cytotoxicity. K562 cells were transduced with lentiviral vectors expressing each of the shRNAs numbered 1–8 in b either in U6-shRNA or SFFV-shRNAmiR and the expression levels were monitored by flow cytometry for 5 weeks posttransduction. The mean percentages of all U6-shRNA (Tomato) and SFFV-shRNAmiRs (Venus) were represented on top of the individual set of candidates respectively. (d) The percentage of apoptotic cells was detected by Annexin V and 7AAD staining on day 11 of posttransduction. Data represent mean ± SD from a representative experiment of three independent experiments conducted in triplicates. *P < 0.05; **P < 0.01; ***P < 0.001. n.s., not significant.
Figure 2
Figure 2
Evaluation of shRNAs targeting BCL11A in pol III and pol II expression systems. (a) Comparison of knockdown efficiency of selected shRNAs (labeled as 1 through 8) in pol III (U6)- and pol II (SFFV)-based systems. BCL11A protein levels are shown by immunoblot with β-actin as control. (b) Fold induction of normalized expression of Hbb-y compared to nontargeting control measured by qPCR. Black bars represent the relative expression by U6 promoter-driven shRNAs, and white bars represent SFFV promoter-driven shRNAs. Data represent mean ± SD from a representative experiment of three independent experiments conducted in triplicates. *P < 0.05 is comparison between U6-shRNAs and SFFV-shRNAmiRs.
Figure 3
Figure 3
Small RNA sequencing analysis reveals differential processing between pol III vs pol II transcripts. (a, b) Small RNA sequencing results of MEL cells transduced with U6-shRNAs and SFFV-shRNAmiRs 1, 2, 3, 4, 6, or 8. The RNA sequences were aligned to the corresponding reference guide strand sequence, shown at the top of each panel in bold underlined and the flanking sequences in grey. nt length indicates size of predominant species. The five most abundant variants of guide strands produced from (a) U6 shRNAs or (b) SFFV-shRNAmiRs are plotted on the y-axis. The relative % contribution of each variant is indicated on the x-axis calculated based on the total number of reads matching the reference shRNA sequence.
Figure 4
Figure 4
Modification of shRNA sequences leads to increased knockdown and improved guide versus passenger strand ratio in MEL cells. (a) shRNAmiRs were modified by deleting the first four bases from the guide sequence and the addition of GCGC to the 3′ end (shRNA modified). (b) Comparison of knockdown efficiency of modified and parental shRNAmiR sequences expressed from a SFFV-pol II promoter in MEL cells. (c) Fold induction of Hbb-y mediated by unmodified (white bars) and modified (gray bars) shRNAmiR sequences measured by qRT-PCR. Data represent mean ± SD. **P < 0.01. (d) Northern blot analysis of total RNA from cells transduced with multiple shRNAs and shRNAmiRs. Probes (20 nt) complementarity to the guide and passenger strands from positions 1 to 20 of shRNAs and shRNAmiRs were utilized to measure the abundance of processed small RNAs. 5S RNA was used as an internal control. (e) RNA-sequencing results of transduced MEL cells expressing shRNA1, 2, 3, 4, 6, or 8. The sequences of these RNAs were aligned to the corresponding reference guide strand sequence shown at the top of each panel. The sequences of different guide strand species are displayed on the y-axis and the frequency as percentage of aligned reads are shown on the x-axis. PIII: U6 shRNA; PII: SFFV shRNAmiR; PIIM: modified SFFV shRNAmiR.
Figure 5
Figure 5
Modified shRNAmiRs lead to increased BCL11A knockdown efficiency and gamma globin induction in human CD34+ derived erythroid cells. (a) CD34+ cells transduced with U6-shRNA or SFFV-shRNAmiR vectors expressing different shRNAs with and without modification were selected either in the presence of puromycin (U6-shRNA) or sorted for Venus expression (SFFV-shRNAmiR and modified SFFV-shRNAmiR). BCL11A expression was measured by immunoblot with β-actin as a loading control on day 11 of differentiation. (b) Induction of γ-globin mRNA was determined on day 18 of differentiation by qRT-PCR. Data represents the percentage of γ-globin of total β-locus output (γ + β-globin) for U6-shRNAs (black bars), SFFV-shRNAmiR (white bars), and modified SFFV-shRNAmiR (grey bars). *P > 0.05; ***P > 0.001. (c) Quantification and statistical analysis of erythroid differentiation markers (CD71, GpA) and enucleation were assessed by flow cytometry. CTRL: control vectors SFFVshRNAmiRNT and SFFV-GFP; PIII: U6 shRNA; PII: SFFV shRNAmiR; PIIM: modified SFFV shRNAmiR. Data represents mean ± SD from three independent experiments. ***P > 0.001. (d) Hemoglobin F of cell lysates was measured by HPLC on day 18 of differentiation. The arrow indicates the HbF peaks and the percentage of HbF of total hemoglobin is shown below the chromatogram. (e) Correlation graph of γ-globin mRNA expression assessed by qRT-PCR versus HbF by HPLC. Black circles represent U6 shRNAs, open and gray circles represent SFFV shRNAmiRs or modified SFFV shRNAmiRs, respectively. Correlation coefficient (r2) is shown for all data.

References

    1. Grimm, D, Streetz, KL, Jopling, CL, Storm, TA, Pandey, K, Davis, CR et al. (2006). Fatality in mice due to oversaturation of cellular microRNA/short hairpin RNA pathways. Nature 441: 537–541. - PubMed
    1. McBride, JL, Boudreau, RL, Harper, SQ, Staber, PD, Monteys, AM, Martins, I et al. (2008). Artificial miRNAs mitigate shRNA-mediated toxicity in the brain: implications for the therapeutic development of RNAi. Proc Natl Acad Sci USA 105: 5868–5873. - PMC - PubMed
    1. Khan, AA, Betel, D, Miller, ML, Sander, C, Leslie, CS and Marks, DS (2009). Transfection of small RNAs globally perturbs gene regulation by endogenous microRNAs. Nat Biotechnol 27: 549–555. - PMC - PubMed
    1. Giering, JC, Grimm, D, Storm, TA and Kay, MA (2008). Expression of shRNA from a tissue-specific pol II promoter is an effective and safe RNAi therapeutic. Mol Ther 16: 1630–1636. - PubMed
    1. Boudreau, RL, Martins, I and Davidson, BL (2009). Artificial microRNAs as siRNA shuttles: improved safety as compared to shRNAs in vitro and in vivo. Mol Ther 17: 169–175. - PMC - PubMed

Publication types

MeSH terms