. 2015 Jun 17:6:7264.
doi: 10.1038/ncomms8264.

Alk1 and Alk5 inhibition by Nrp1 controls vascular sprouting downstream of Notch

Affiliations

Alk1 and Alk5 inhibition by Nrp1 controls vascular sprouting downstream of Notch

Irene Maria Aspalter et al. Nat Commun. .

Abstract

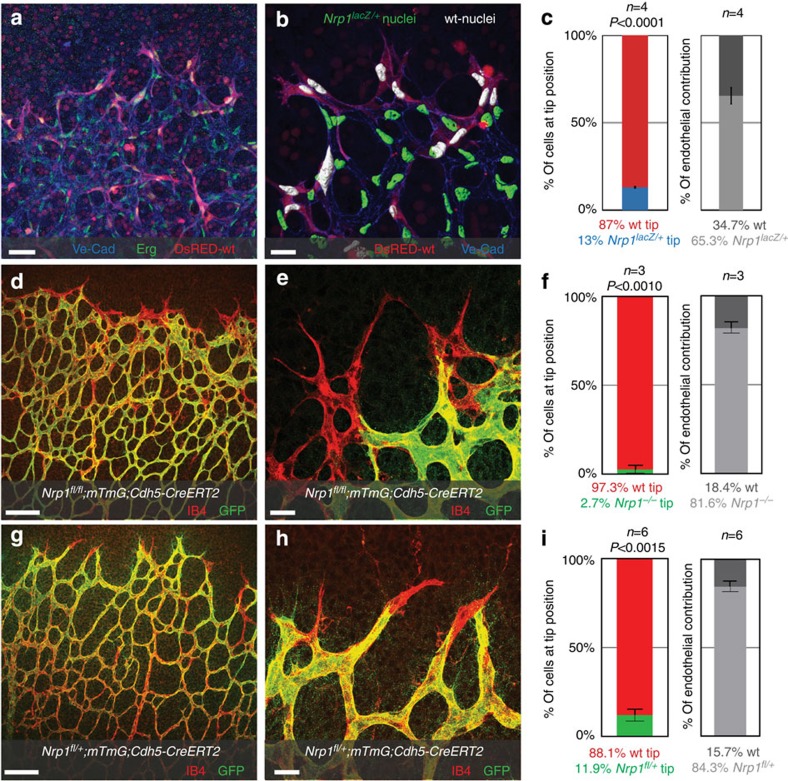
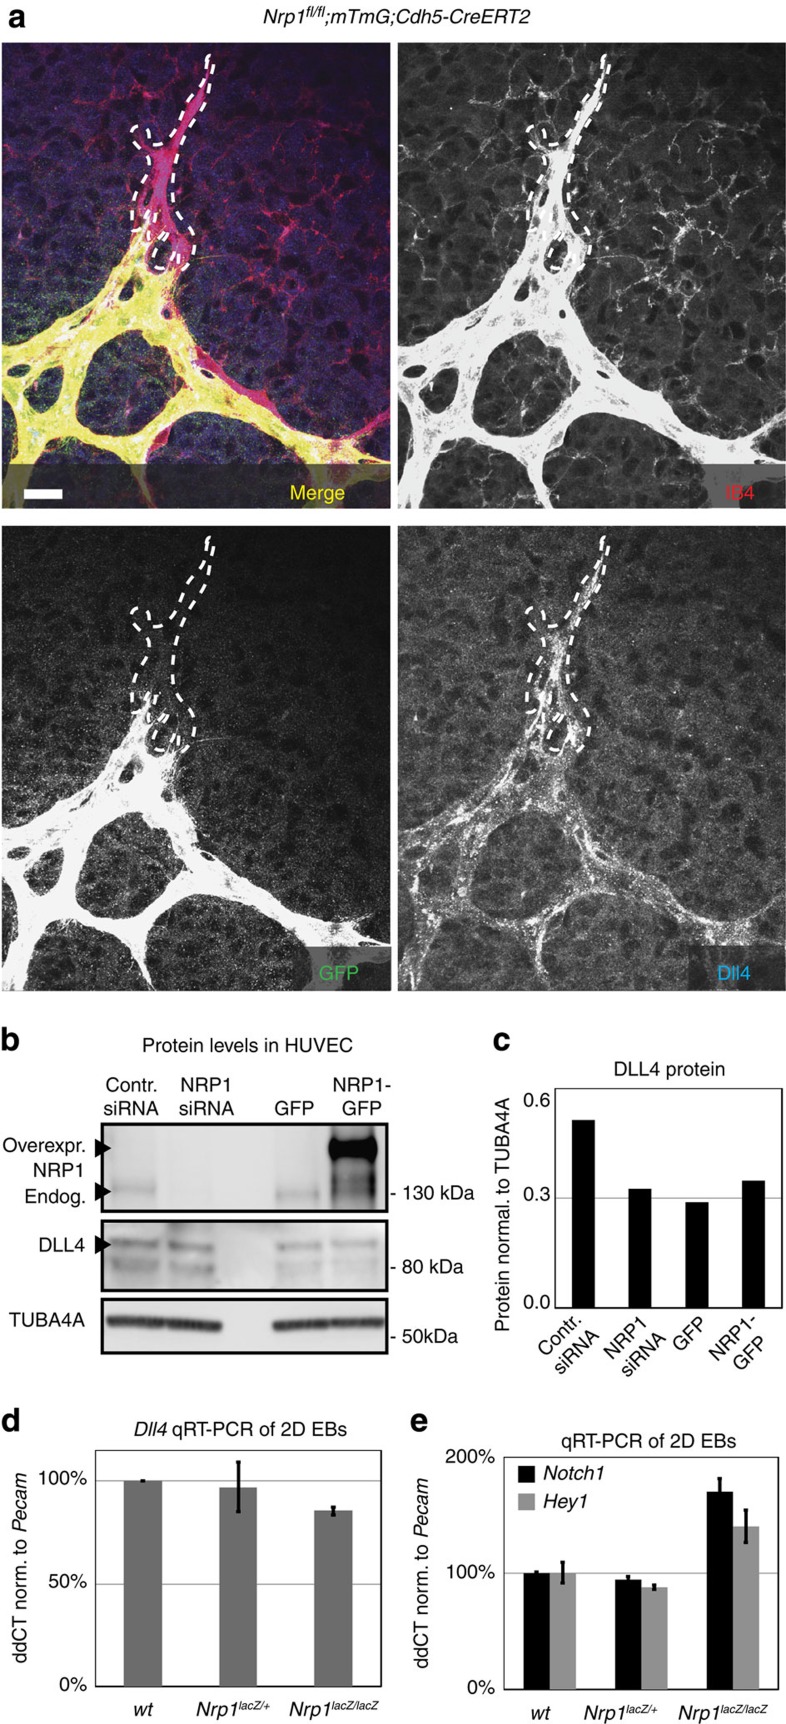
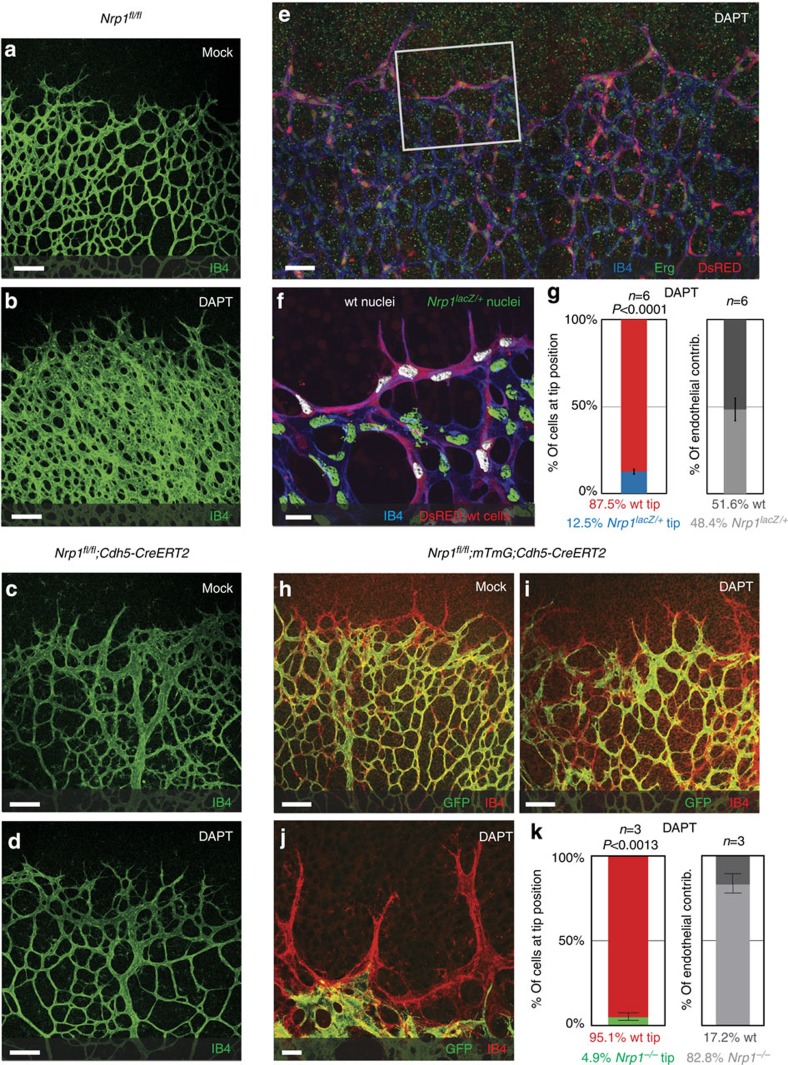
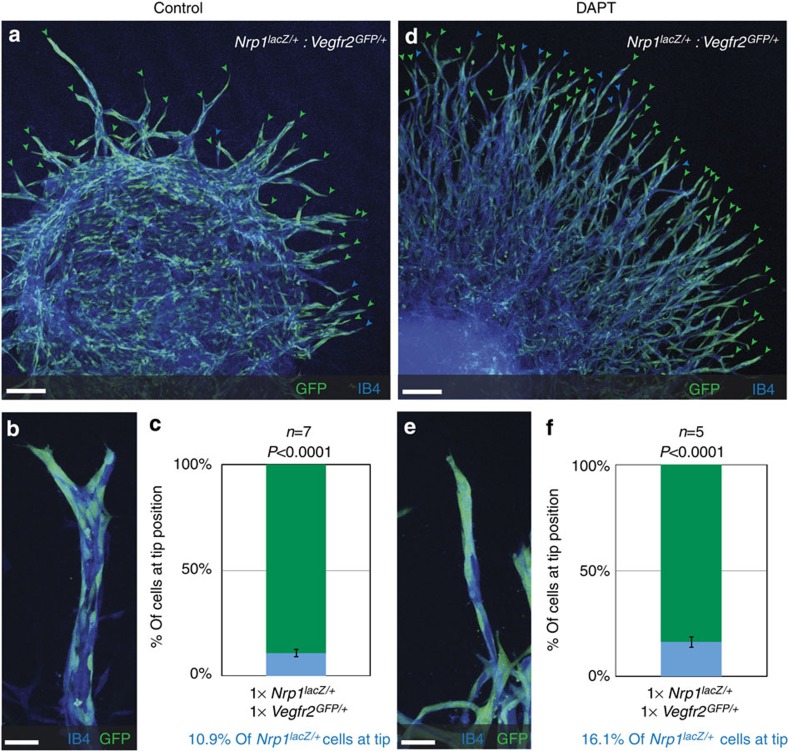
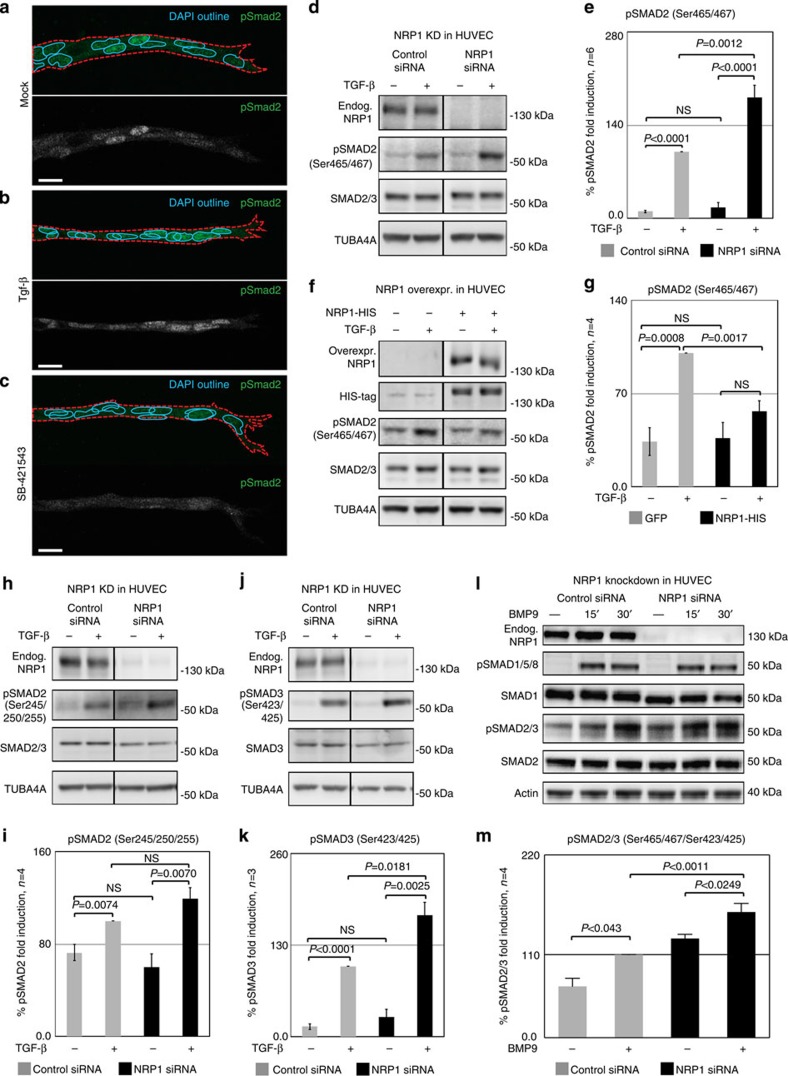
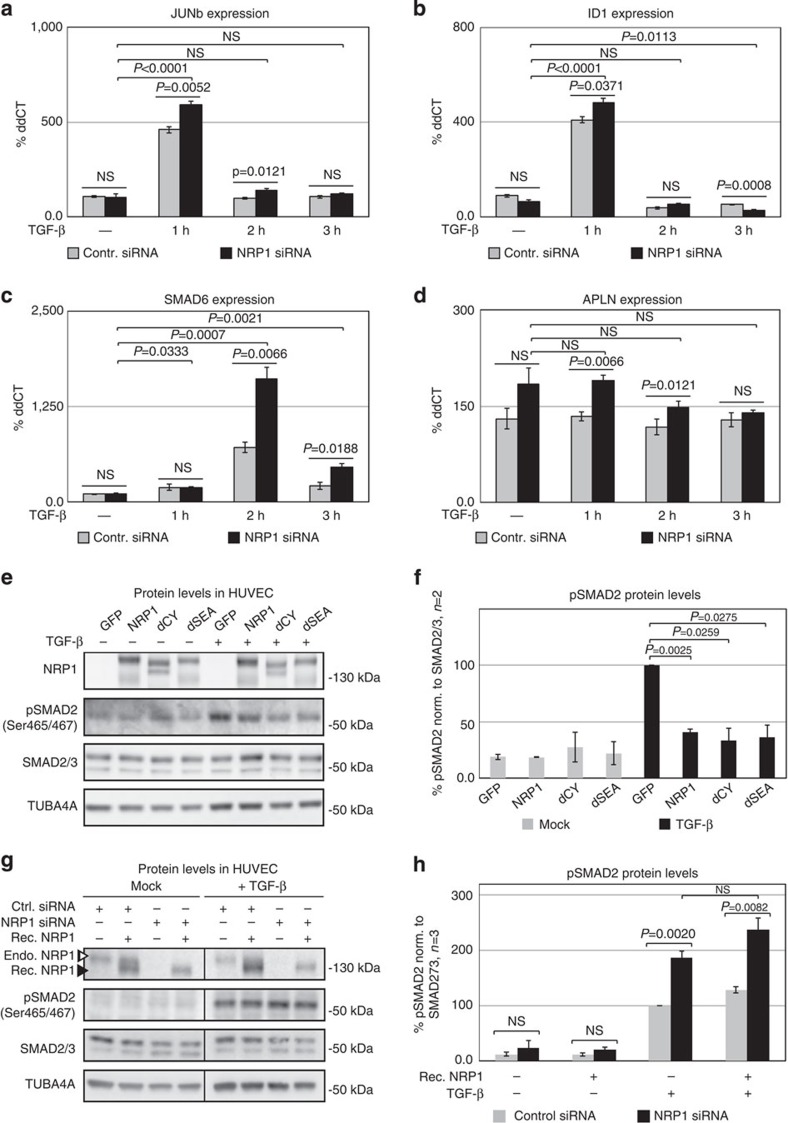
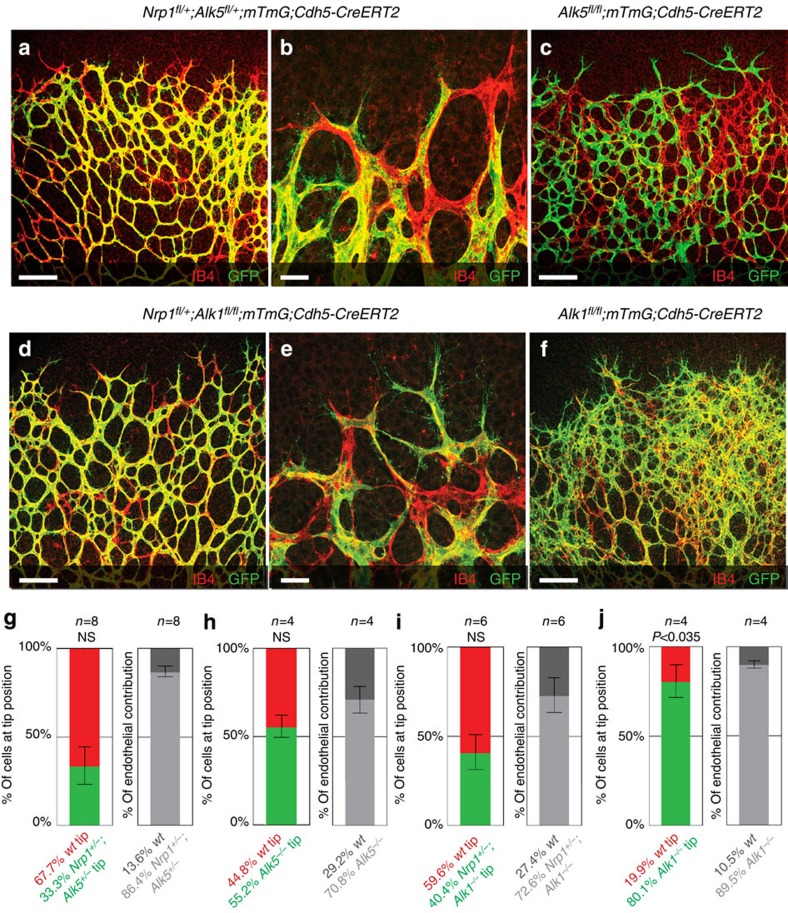
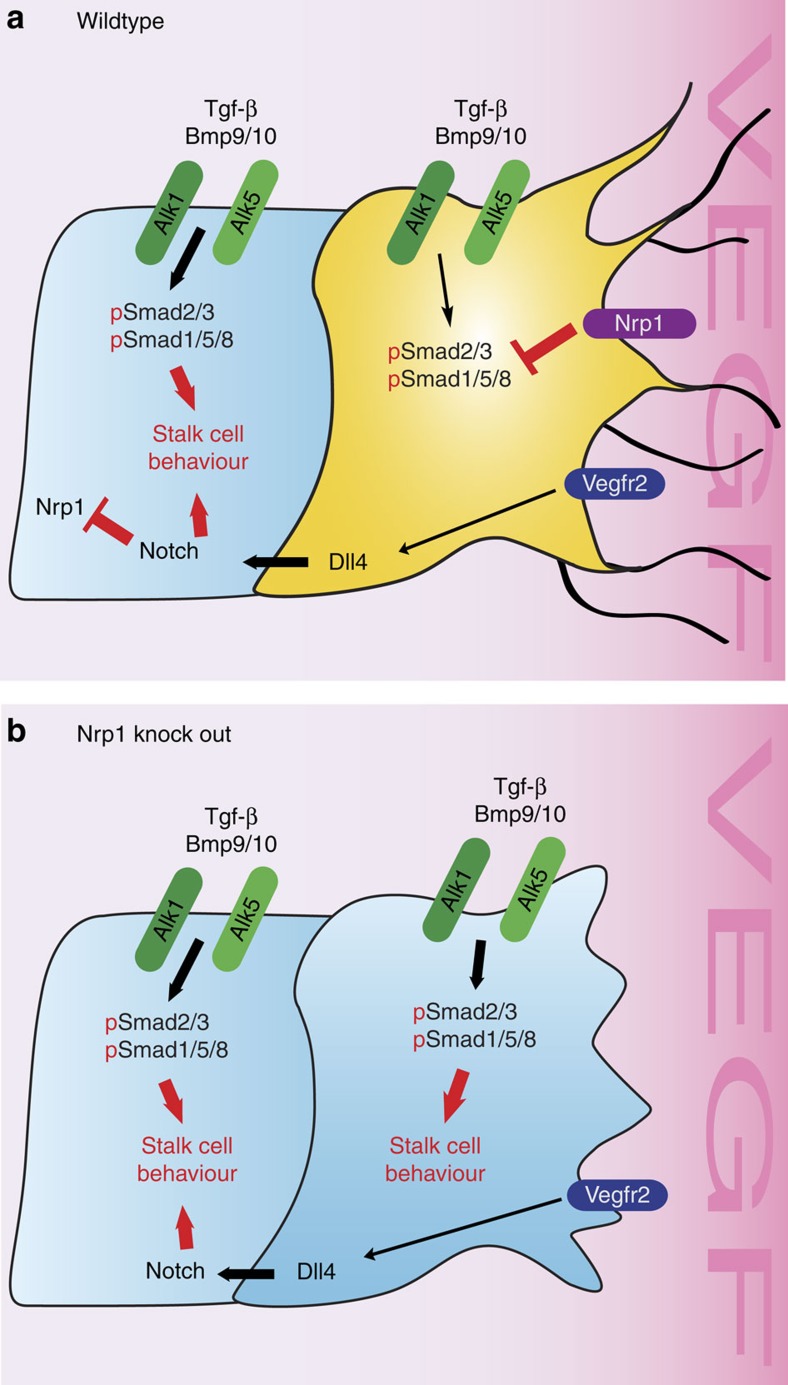
Sprouting angiogenesis drives blood vessel growth in healthy and diseased tissues. Vegf and Dll4/Notch signalling cooperate in a negative feedback loop that specifies endothelial tip and stalk cells to ensure adequate vessel branching and function. Current concepts posit that endothelial cells default to the tip-cell phenotype when Notch is inactive. Here we identify instead that the stalk-cell phenotype needs to be actively repressed to allow tip-cell formation. We show this is a key endothelial function of neuropilin-1 (Nrp1), which suppresses the stalk-cell phenotype by limiting Smad2/3 activation through Alk1 and Alk5. Notch downregulates Nrp1, thus relieving the inhibition of Alk1 and Alk5, thereby driving stalk-cell behaviour. Conceptually, our work shows that the heterogeneity between neighbouring endothelial cells established by the lateral feedback loop of Dll4/Notch utilizes Nrp1 levels as the pivot, which in turn establishes differential responsiveness to TGF-β/BMP signalling.


Figures

Figure 1
Figure 1. Differential Nrp1 levels affect tip cell competition.
(ac) Retinal vessels from a wild-type host expressing DsRED injected with Nrp1Lacz/+ ES cells, assayed at postnatal day P5. (a) Representative overview of the sprouting front; scale bar, 420 μm. (b) Segmented images showing wt nuclei (white) and nuclei from Nrp1lacZ/+ cells (green), using Erg staining; scale bar, 20 μm. (c) Quantification of tip cell contribution normalized to overall contribution of cells to the endothelium, P<0.0001 compared with wt cells injected retinas. (di) Retinas of Nrp1fl/fl; mTmG; Cdh5-CreERT2 and Nrp1fl/+; mTmG; Cdh5-CreERT2 mice injected with 30 μg tamoxifen at P1, retinas were assayed P5. (d,g) Representative overview of the sprouting front, scale bar, 100 μm, and higher magnification, scale bar, 20 μm (e,h). Unrecombined, wt cells are labelled with Isolectin-B4 only; recombined Nrp1-deficient cells express GFP. (f,i) Quantification of recombined Nrp1-deficient cells at the tip, normalized to overall contribution of cells to the endothelium. Statistical significance was determined by comparing the proportion of Nrp1-deficient (green) cells at the tip with the total proportion of Nrp1-deficient cells; P<0.001 (f), P<0.0015 (i). n=the number of retinas analysed; n=4 (c), n=3 (f) and n=6 (i). Values represent mean±s.e.m. Statistical significance was assessed using a Student's unpaired t-test.
Figure 2
Figure 2. Nrp1-deficient cells express Dll4.
(a) Representative image of Dll4 expression in endothelial cells at the vascular front of mice carrying endothelial-specific Nrp1 deletion, scale bar, 20 μm. Mice were injected with 30 μg of tamoxifen at P1. Tip cell outline is indicated by a dashed line. Dll4 expression was comparable between Nrp1-deficient, GFP-positive cells and Nrp1-positive, GFP-negative cells. (b) P4 HUVEC cells transfected with control siRNA, NRP1 siRNA, control-GFP construct and NRP1–GFP–His-construct. NRP1 and DLL4 protein levels were assessed 24 h after transfection by western blot (two individual experiments). Full western blots are shown in Supplementary Fig. 9. (c) Quantification of DLL4 protein expression normalized to TUBA4A, a representative of two experiments is shown. (d,e) Real-time quantitative PCR for Dll4 (d) and Notch/Hey1 (e) from 2D EBs derived from wt cells, Nrp1lacZ/+ cells and Nrp1lacZ/lacZ cells. Experimental triplicates were performed; represented values were normalized to Pecam expression and wt transcription levels. Values indicate mean±s.d.
Figure 3
Figure 3. Nrp1 acts as downstream effector of Notch.
(ad) Representative images of the Isolectin-B4-stained retinal vasculature, of P5 Nrp1fl/fl and Nrp1fl/fl; Cdh5-CreERT2 mice, injected with 100 μg tamoxifen at P1/P2 and treated with 100 mg kg−1 DAPT at P4; scale bar, 100 μm. (a) Retinal vessels of Nrp1fl/fl mice; (b) DAPT treatment of Nrp1fl/fl; (c) Nrp1fl/fl; Cdh5-CreERT2; (d) DAPT-treated Nrp1fl/fl; Cdh5-CreERT2 mice. n=number of retinas examined; n=4 (a), n=4 (b), n=6 (c) and n=6 (d). (eg) P5 retinal vasculature of wt blastocysts expressing DsRED injected with Nrp1lacZ/+ ES cells, treated with DAPT (100 mg kg−1) at P4. (e) Representative overview of the sprouting front; scale bar, 420 μm. (f) Segmented images; wt nuclei (white) and Nrp1lacZ/+ nuclei (green); scale bar: 20 μm. (g) Quantification of Nrp1lacZ/+ cells at the tip, normalized to overall contribution of cells to the endothelium; n=6 (number of retinas analysed); P<0.0001. (hk) P5 retinas of Nrp1fl/fl; mTmG; Cdh5-CreERT2 mice injected with 30 μg tamoxifen at P1, and treated with 100 mg kg−1 DAPT at P4. Unrecombined wt cells are labelled with Isolectin-B4 only; recombined Nrp1-deficient cells express GFP. (h) Representative overview of MOCK control. (i) Representative overview of DAPT-treated animals; scale bar, 100 μm, magnification is shown in j; scale bar, 20 μm. (k) Quantification of recombined Nrp1-deficient cells at the tip, normalized to overall contribution of cells to the endothelium. Statistical significance was determined by comparing the proportion of Nrp1-deficient (green) cells at the tip with the total proportion of Nrp1-deficient (green) cells; n=3 (number of retinas analysed); P<0.0013. (g,k) Values represent mean±s.e.m. Statistical significance was assessed using a Student's unpaired t-test.
Figure 4
Figure 4. Nrp1 deficiency overrules Vegfr2 deficiency during tip cell competition.
(a,b,d,e) Representative confocal images of the sprouting vasculature of a chimeric EB composed of Vegfr2GFP/+ cells and Nrp1Lacz/+ cells. Untreated (a,b) or treated with 5 μM DAPT for 5 days until harvesting at day 10 (d,e). (a,d) Tip cells derived from Vegfr2GFP/+ cells are indicated by green arrowheads and Nrp1Lacz/+ tip cells by blue arrowheads; scale bar, 130 μm. Magnifications of individual sprouts; scale bar, 36 μm (b,e). (c,f) Quantification of tip cells from Vegfr2GFP/+:Nrp1LacZ/+ chimeric EBs with equal input levels, either untreated (c) or treated with 5 μM DAPT (f). n=number of EBs analysed; number of counted tips: 458; n=7 (c) and 940; n=5 (f). P values were calculated using a Student's unpaired t-test by comparing quantified contribution with initial percentage of input levels; P<0.0001 (c,f). Values represent mean±s.e.m.
Figure 5
Figure 5. Nrp1 influences Smad2/3 activation.
(ac) Representative confocal images of wt sprouts from EBs immunolabelled for pSmad2. The outline of the wt sprouts is indicated with a dashed line using the endogenous DsRED marker. DAPI staining (not shown) was used to mark nuclei (blue line). Sprouts from (a) untreated EBs, (b) treated with 2 ng ml−1 Tgf-β for 1 h and(c) treated with 10 μM SB-421543 for 4 h. Scale bar, 13 μm. (d,e) Western blot analysis of proteins from P4 HUVEC transfected with control siRNA and NRP1 siRNA, with or without stimulation with 2 ng ml−1 TGF-β for 1 h. Full western blots are shown in Supplementary Fig. 10. A representative blot of six is shown; P=0.0012 NRP1 siRNA compared with control. (f,g) Proteins from P4 HUVEC transfected with control-GFP and NRP1–GFP–His construct for 24 h, with or without stimulation with 2 ng ml−1 TGF-β for 1 h were assessed for SMAD2 phosphorylation. Full western blots are shown in Supplementary Fig. 11. A representative blot of four is shown; P=0.0017 NRP1 overexpression compared with control. (e,g) Quantification of pSMAD2 protein normalized to SMAD2/3. (hk) Western blot analysis of proteins from P4 HUVEC transfected with control siRNA and NRP1 siRNA, with or without stimulation with 2 ng ml−1 TGF-β for 1 h. Full western blots are shown in Supplementary Figs 12 and 13. (i) Quantification of pSMAD2 protein normalized to SMAD2/3; P=0.0848 Nrp1 siRNA compared with control. (k) Quantification of pSMAD3 protein normalized to SMAD3; P=0.0181 NRP1 siRNA compared with control. (l,m) Western blot analysis of P4 HUVEC transfected with control siRNA and NRP1 siRNA, with or without stimulation with 10 ng ml−1 BMP9 for 15 and 30 min. Full western blots are shown in Supplementary Fig. 14. A representative blot of four is shown. (m) Quantification of pSMAD2/3 protein normalized to SMAD2; P<0.0011 NRP1 siRNA compared with control. All values represent mean±s.e.m. DAPI, 4,6-diamidino-2-phenylindole; NS, not significant.
Figure 6
Figure 6. Nrp1 affects Tgf-β pathway activation independently of its intracellular domain.
(ad) Real-time quantitative PCR for JUNb, ID1, SMAD6 and APLN of P4 HUVEC transfected with control siRNA and NRP1 siRNA for 48 h. 2 ng ml−1 TGF-β stimulation was performed in a time course, 1, 2 and 3 h prior to cell lysis. All values are normalized to GAPDH and non-induced control siRNA. All samples have been performed as biological triplicates as well as technical triplicates; P values are indicated in the figure. (e,f) P4 HUVEC transfected with control-GFP construct, full-length NRP1–GFP–His construct, cytoplasmic-domain-deleted NRP1–dCY–GFP–His construct and SEA-domain-deleted NRP1–dSEA–GFP–His construct for 24 h prior stimulation with 2 ng ml−1 TGF-β for 1 h. Full western blots are shown in Supplementary Fig. 15. A representative of two biological repetitions is shown. (f) Quantification of pSMAD2 protein levels normalized to SMAD2/3; P values are indicated in the figure. (g,h) Western blot analysis of P4 HUVEC transfected with control siRNA and NRP1 siRNA for 48 h treated with 10 nM recombinant NRP1 1 h prior stimulation with 2 ng ml−1 TGF-β for 1 h. (g) Western blot for NRP1 shows endogenous (open arrowhead) and recombinant NRP1 (closed arrowhead). Full western blots are shown in Supplementary Fig. 16. A representative of three biological repetitions is shown. (h) Quantification of pSMAD2 protein normalized to SMAD2/3; P values are indicated in the figure. All values represent mean±s.e.m. Statistical significance was assessed using a Student's unpaired t-test. NS, not significant.
Figure 7
Figure 7. Inhibition of Alk5 and Alk1 rescues the Nrp1-deficient sprouting defect.
Retinas of Nrp1fl/+; Alk5fl/+; mTmG; Cdh5-CreERT2 mice (a,b), Alk5fl/fl; mTmG; Cdh5-CreERT2 mice (c), Nrp1fl/+; Alk1fl/fl; mTmG; Cdh5-CreERT2 mice (d,e) or Alk1fl/fl; mTmG; Cdh5-CreERT2 mice (f) injected with 30 μg tamoxifen at P1; retinas were assayed P5. Unrecombined wt cells are labelled with Isolectin-B4 only; recombined cells express GFP. Magnification of a is shown in b, magnification of d is shown in e; scale bar, 100 μm (a,c,d,f), 20 μm (b,e). Quantification of recombined Nrp1fl/+; Alk5fl/+ (g), Alk5fl/fl (h), Nrp1fl/+; Alk1fl/fl (i) or Alk1fl/fl (j) cells at the tip, normalized to overall contribution of cells to the endothelium. Statistical significance was determined by comparing the proportion of deficient (green) cells at the tip with the total proportion of deficient (green) cells; P=NS (0.0536) (g), P=NS (0.7576) (h), P=NS (0.275) (i), P<0.0358 (j). n=number of retinas analysed; n=8 (g), n=4 (h), n=6 (i) and n=4 (j); values represent mean±s.e.m. Statistical significance was assessed using a Student's unpaired t-test. NS, not significant.
Figure 8
Figure 8. Working model for Nrp1 function in tip cell formation.
(a) The data suggest that Nrp1 inhibits Smad2/3 phosphorylation by Alk5 and Alk1 in response to Tgf-β and Bmp9/10 in tip cells (yellow). VEGF-dependent, but Nrp1-independent upregulation of Dll4 in the tip leads to Notch activation in stalk cells, which decreases Nrp1 levels in the stalk cell (blue). The reduction of Nrp1 in the stalk results in higher pSmad2/3 levels and stalk cell behaviour. (b) In an Nrp1 knock-out situation, pSmad2/3 activation leads to the activation of stalk cell behaviour in all endothelial cells, resulting in sprouting inhibition.

References

    1. Potente M., Gerhardt H. & Carmeliet P. Basic and therapeutic aspects of angiogenesis. Cell 146, 873–887 (2011). - PubMed
    1. Geudens I. & Gerhardt H. Coordinating cell behaviour during blood vessel formation. Development 138, 4569–4583 (2011). - PubMed
    1. Eichmann A. & Simons M. VEGF signaling inside vascular endothelial cells and beyond. Curr. Opin. Cell Biol. 24, 188–193 (2012). - PMC - PubMed
    1. Gerhardt H. et al. VEGF guides angiogenic sprouting utilizing endothelial tip cell filopodia. J. Cell Biol. 161, 1163–1177 (2003). - PMC - PubMed
    1. Hellstrom M. et al. Dll4 signalling through Notch1 regulates formation of tip cells during angiogenesis. Nature 445, 776–780 (2007). - PubMed

Publication types

MeSH terms

LinkOut - more resources