. 2015 Jun 17;16(1):464.
doi: 10.1186/s12864-015-1643-9.

Whole-genome cartography of p53 response elements ranked on transactivation potential

Affiliations

Whole-genome cartography of p53 response elements ranked on transactivation potential

Toma Tebaldi et al. BMC Genomics. .

Abstract

Background: Many recent studies using ChIP-seq approaches cross-referenced to trascriptome data and also to potentially unbiased in vitro DNA binding selection experiments are detailing with increasing precision the p53-directed gene regulatory network that, nevertheless, is still expanding. However, most experiments have been conducted in established cell lines subjected to specific p53-inducing stimuli, both factors potentially biasing the results.

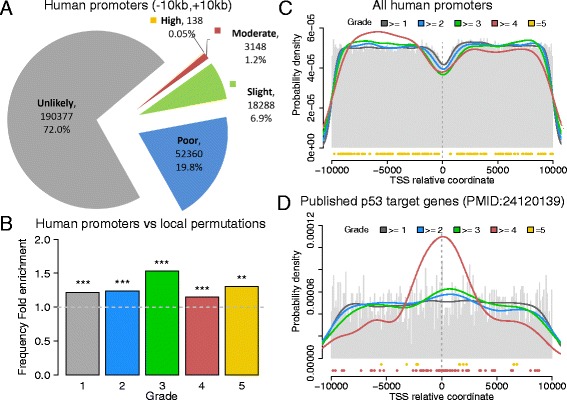
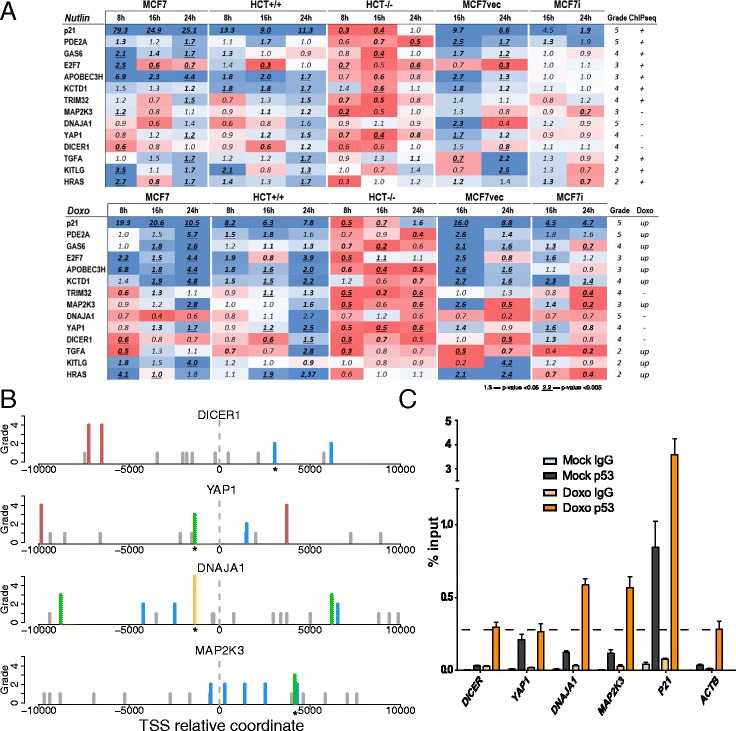
Results: We developed p53retriever, a pattern search algorithm that maps p53 response elements (REs) and ranks them according to predicted transactivation potentials in five classes. Besides canonical, full site REs, we developed specific pattern searches for non-canonical half sites and 3/4 sites and show that they can mediate p53-dependent responsiveness of associated coding sequences. Using ENCODE data, we also mapped p53 REs in about 44,000 distant enhancers and identified a 16-fold enrichment for high activity REs within those sites in the comparison with genomic regions near transcriptional start sites (TSS). Predictions from our pattern search were cross-referenced to ChIP-seq, ChIP-exo, expression, and various literature data sources. Based on the mapping of predicted functional REs near TSS, we examined expression changes of thirteen genes as a function of different p53-inducing conditions, providing further evidence for PDE2A, GAS6, E2F7, APOBEC3H, KCTD1, TRIM32, DICER, HRAS, KITLG and TGFA p53-dependent regulation, while MAP2K3, DNAJA1 and potentially YAP1 were identified as new direct p53 target genes.

Conclusions: We provide a comprehensive annotation of canonical and non-canonical p53 REs in the human genome, ranked on predicted transactivation potential. We also establish or corroborate direct p53 transcriptional control of thirteen genes. The entire list of identified and functionally classified p53 REs near all UCSC-annotated genes and within ENCODE mapped enhancer elements is provided. Our approach is distinct from, and complementary to, existing methods designed to identify p53 response elements. p53retriever is available as an R package at: http://tomateba.github.io/p53retriever .


Figures

Fig. 1
Fig. 1
Summary of RE sequence features and associated grades in p53retriever. a Grade: classification of REs reflecting associated functional scores. The color code matching the 5 different grades will be maintained in all figures. b Mismatch label: classification of mismatches in different positions. High penalties are given to mismatches located in the core consensus sequence (label A and B), lower penalties are given when mismatches are gradually distant from the core (label C and D). Label O is given to a site without mismatches. Mismatches group penalties: different penalties are attributed to groups of mismatches according to how they are scattered or grouped along the site. c Schematic representation of the main rules on which p53retriever search algorithm is based. The full list of rules is listed in Additional file 1. The p53 consensus sequence is presented, grouping dinucleotide motifs that were revealed to provide a specific impact on transactivation potentials, based on our previous studies (see text for details) [28]. Penalties are indicated by an increment in the number of the “-” symbol and a color code broadly matching the grade scale. Single mismatches are more penalized when affecting a base in the internal portion of the RE, as indicated. On the contrary, the AT motif at the center of the CWWG core is a positive feature, particularly in the case of non-canonical REs (3Q = 3Q sites and half sites)
Fig. 2
Fig. 2
Analysis of p53 REs found in human promoters. a Pie chart displaying the distribution of grades associated to REs found in all human promoters. b Comparison between the frequencies of REs found in human promoters, and the frequencies of REs found in scrambled promoter sequences after applying local permutations (to preserve the local GC content). The comparison is shown for each grade. The ratio is 1 if the frequency is the same, > 1 if the frequency is higher in real promoters, <1 if the frequency is higher in scrambled promoters. All enrichments are significant, the binomial test p-value is 4.84E-04 for grade 5 (**), <1E-15 for all the other grades (***). c p53 occupancy metaprofile, based on the position of REs in all human promoters, centered on the TSS position. The grey histogram displays the probability distribution of all REs independently from the grade. Colored lines represent the density distribution of REs with higher grades (the grade threshold corresponding to each color is displayed in the legend). The specific positions of grade 5 REs are dotted in yellow under the histogram. d p53 occupancy metaprofile, based on the position of REs in the human promoters of 228 p53 target genes, published in [15]. The color scheme is the same as in panel C. The specific positions of grade 4 and 5 REs are dotted under the histogram (in yellow for grade 5, red for grade 4)
Fig. 3
Fig. 3
Comparison of p53retriever with other p53 binding site datasets and tools. a Pie chart displaying p53retriever classification on a list of 81 regions commonly identified by 7 different ChIP-seq experiments [15]. b Left panel: pie chart displaying p53retriever classification on a list of 2250 regions identified by ChIP-exo [14]. Right panel: boxplot displaying for each grade assigned by p53retriever to ChIP-exo sequences, the distribution of the corresponding ChIP-exo occupancies, measured in [14]. n.g. = no grade given by p53retriever. c Pie chart displaying p53retriever classification on a list of 4416 regions identified by ChIP-seq in [17]. d p53 target gene lists from curated databases (Biobase and IPA) or from expression datasets (Doxo up: genes up-regulated upon doxorubicin treatment) were compared to the list of p53 promoter REs obtained with p53retriever. Presented in the bar graph are the predicted p53 REs grouped by the maximum functional grade identified by p53retriever in their promoter. e Comparison between p53 REs identified in human promoters by p53retriever, and the corresponding score given by Jaspar p53 PWM (MA0106.2), based on ChIPseq data. REs are divided in 5 groups along the horizontal axis, corresponding to the grade assigned by p53retriever. For each group, the distribution of the scores given by Jaspar PWM is represented as a violin plot, i.e., a box plot with a rotated kernel density plot on each side. Jaspar scores range from 0 (the RE is not identified) to 1 (the RE is optimal)
Fig. 4
Fig. 4
Analysis of p53 REs found in distal DNAse hypersensitive regions. a Boxplot of the nucleotide length of human distal DNAse hypersensitive regions, determined as described in Methods. b Pie chart displaying the distribution of grades associated to REs found in human distal DNAse hypersensitive regions. c Comparison between the frequencies of REs found in human distal DNAse hypersensitive regions, and the frequencies of REs found in random sequences with the same GC content. The comparison is shown for each grade. The ratio is 1 if the frequency is the same (horizontal dotted line), > 1 if the frequency is higher in DNAse regions, <1 if the frequency is higher in random sequences. All enrichments of REs mapped to distal DNAse hypersensitive regions are highly significant (Binomial test p-value < 1E-20). d Pie charts displaying p53retriever classification on two lists of regions identified by ChIP-seq in [17] as proto-enhancers (upper panel) and enhancers (lower panel)
Fig 5
Fig 5
p53-responsiveness of target genes associated with predicted functional REs. a qPCR results of 13 selected genes. Fold of changes values (∆∆Cq) upon each treatment are presented as a heatmap. Upper part shows mRNAs level after Nutlin-3A treatment while the lower shows the same after Doxorubicin (Doxo) treatment. Expression levels were tested in different cell lines (MCF7, HCT +/+, HCT −/−, MCF7 vector and MCF7 shp53) and at different time points (8, 16 and 24 h) (Details are presented in Additional file 7). For each gene, the “Grade” column presents the binding site grade reported by our algorithm. “ChIPseq” column shows the presence (+) or absence (−) of reported p53 binding sites [8]. “Doxo” column presents mRNA levels obtained by microarray data [49]. b Positional representation of p53 binding sites in TSS proximity for DICER, YAP1, DNAJA1, MAP2K3. Bar height is proportional to the binding site grade. Grade 5 is yellow, grade 4 is red, grade 3 is green, grade 2 is blue and grade 1 is grey. c p53 occupancy on the promoter of DICER, YAP1, DNAJA1 and MAP2K3 comparing Mock and Doxo condition in MCF7 cells. P21, well-known p53 direct target, is a positive control. ACTB is used as a reference. Sites validated by ChIP are indicated by a * symbol in Figure 5b

References

    1. Lane D, Levine A. p53 Research: The Past Thirty Years and the Next Thirty Years. Cold Spring Harb Perspect Biol. 2010;2(12):a000893. doi: 10.1101/cshperspect.a000893. - DOI - PMC - PubMed
    1. Riley T, Sontag E, Chen P, Levine A. Transcriptional control of human p53-regulated genes. Nat Rev Mol Cell Biol. 2008;9:402–12. doi: 10.1038/nrm2395. - DOI - PubMed
    1. Beckerman R, Prives C. Transcriptional regulation by p53. Cold Spring Harb Perspect Biol. 2010;2(8):a000935. doi: 10.1101/cshperspect.a000935. - DOI - PMC - PubMed
    1. Sullivan KD, Gallant-Behm CL, Henry RE, Fraikin JL, Espinosa JM. The p53 circuit board. Biochim Biophys Acta. 2012;1825(2):229–44. - PMC - PubMed
    1. Menendez D, Inga A, Resnick MA. The expanding universe of p53 targets. Nature Rev Cancer. 2009;9:724–37. doi: 10.1038/nrc2730. - DOI - PubMed

Publication types

MeSH terms