. 2015 Oct;35(10):1579-86.
doi: 10.1038/jcbfm.2015.140. Epub 2015 Jun 17.

Optogenetic stimulation of GABA neurons can decrease local neuronal activity while increasing cortical blood flow

Affiliations

Optogenetic stimulation of GABA neurons can decrease local neuronal activity while increasing cortical blood flow

Eitan Anenberg et al. J Cereb Blood Flow Metab. 2015 Oct.

Abstract

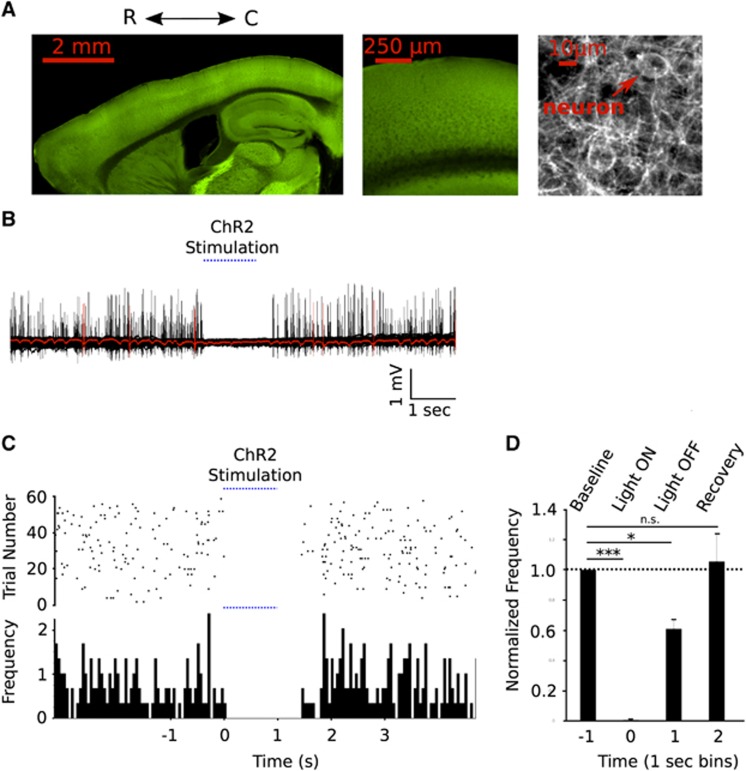
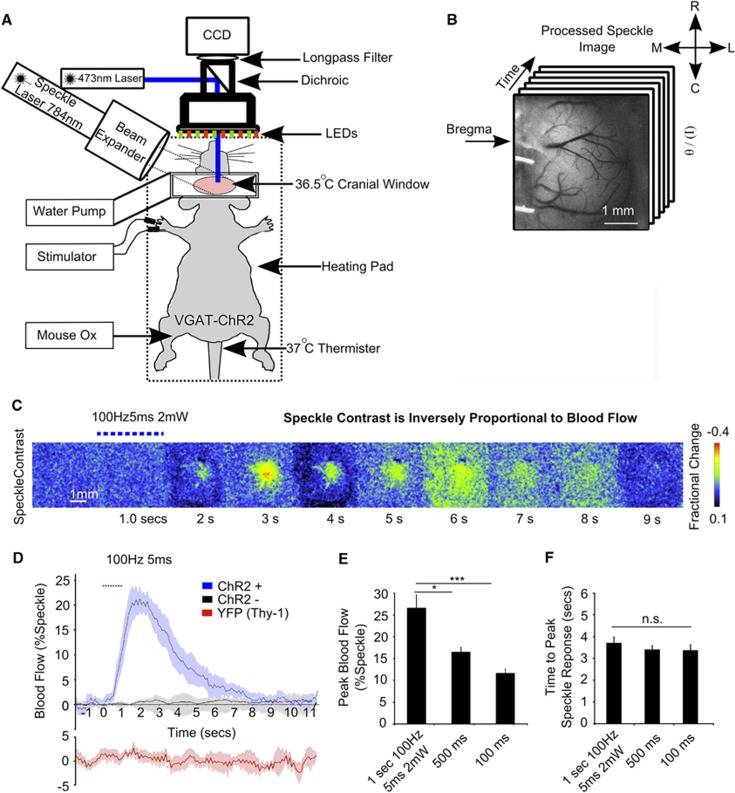
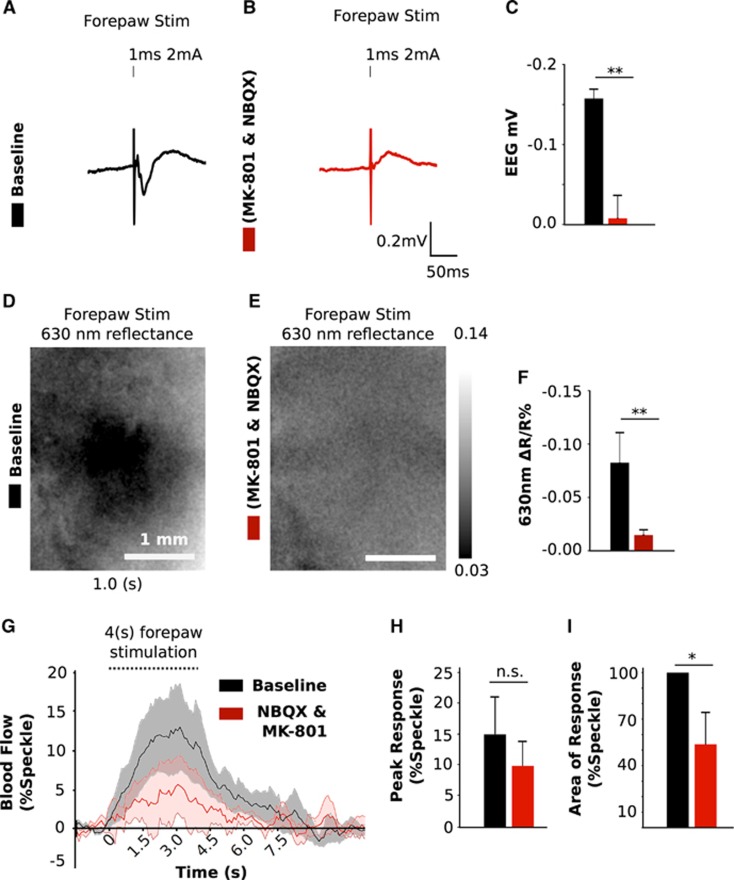
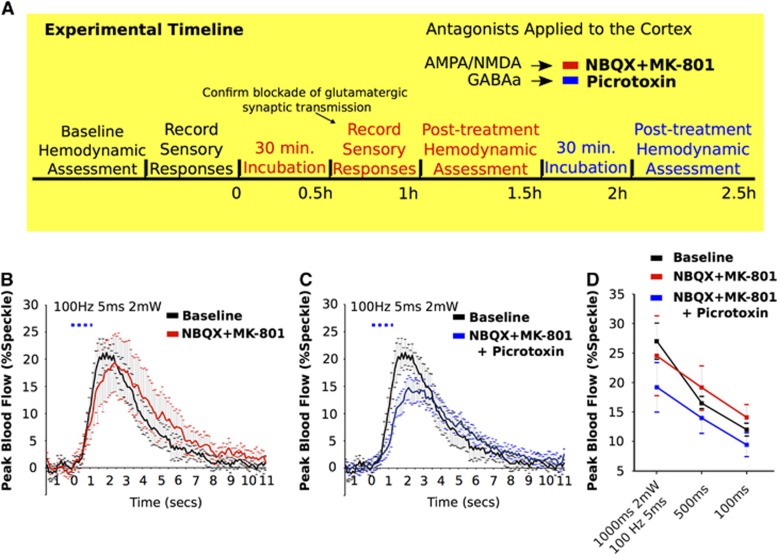
We investigated the link between direct activation of inhibitory neurons, local neuronal activity, and hemodynamics. Direct optogenetic cortical stimulation in the sensorimotor cortex of transgenic mice expressing Channelrhodopsin-2 in GABAergic neurons (VGAT-ChR2) greatly attenuated spontaneous cortical spikes, but was sufficient to increase blood flow as measured with laser speckle contrast imaging. To determine whether the observed optogenetically evoked gamma aminobutyric acid (GABA)-neuron hemodynamic responses were dependent on ionotropic glutamatergic or GABAergic synaptic mechanisms, we paired optogenetic stimulation with application of antagonists to the cortex. Incubation of glutamatergic antagonists directly on the cortex (NBQX and MK-801) blocked cortical sensory evoked responses (as measured with electroencephalography and intrinsic optical signal imaging), but did not significantly attenuate optogenetically evoked hemodynamic responses. Significant light-evoked hemodynamic responses were still present after the addition of picrotoxin (GABA-A receptor antagonist) in the presence of the glutamatergic synaptic blockade. This activation of cortical inhibitory interneurons can mediate large changes in blood flow in a manner that is by and large not dependent on ionotropic glutamatergic or GABAergic synaptic transmission. This supports the hypothesis that activation of inhibitory neurons can increase local cerebral blood flow in a manner that is not entirely dependent on levels of net ongoing neuronal activity.


Figures

Figure 1
Figure 1
(A) Confocal microscopy was used to visualize emissions from YFP-ChR2 fusion protein. Left: Sagittal cross sections of a ChR2-VGAT mouse brain Middle: a view of the cortex highlighting laminar distribution of YFP-ChR2. Right: high power view showing dense network of labeled fibres and cell body seen in projection images from sensorimotor cortex. (B) Activation of cortical inhibitory interneurons silences spontaneous spiking activity. Sixty trials of spontaneous cortical recordings acquired with a glass electrode and interrupted by ChR2 stimulation (in one VGAT ChR2 mouse). A single trial is highlighted in red. (C) Raster plot of neuronal spikes over time in each trial and a quantification of identified spikes per second. (D) Normalized spikes per second from 1 second bins before, during, and for 2 seconds after stimulation (n=3). Error bars represent mean values±s.e.m.
Figure 2
Figure 2
Cortical hemodynamic responses evoked with direct photostimulation of inhibitory interneurons. (A) Experimental arrangement for acute in vivo optogenetic stimulation experiments. (B) Variance-filtered speckle image, where darker tones represent higher velocity blood flow. (C) Montage of fractional change in speckle contrast from 1 second of stimulation (100 Hz, 5 ms, 2 mW) in a single VGAT-ChR2 mouse. (D) Evoked blood flow response (the inverse square of speckle contrast scaled between minimum and maximum) from 1 second of photostimluation (100 Hz, 5 ms, 2 mW) in VGAT-ChR2 mice (n=6), ChR2-negative littermates (n=2) and Thy-1 YFP mice (3 mW stimulation; n=4). Plots show mean values±s.e.m. (E) Peak blood flow and (F) latency to the peak response (n=6) from 100 Hz, 5 ms, 2 mW stimulation at three different durations (1.0; n=6, 0.5 n=6, 0.1; n=5 seconds).
Figure 3
Figure 3
Effect of glutamatergic antagonists on sensory responses. Example of the sensory-evoked response measured with electroencephalography (EEG) before (A) and after (B) application of glutamatergic antagonists. (C) Group data of peak EEG response (n=4). Average change of 630 nm reflectance after sensory stimulation from 1 second of activity captured before (D) and after (E) treatment (% change). (F) Peak 630 nm reflectance response (initial dip) after sensory stimulation of the forepaw from a 1 mm2 region of interest captured before and after application of glutamatergic antagonists (n=5). (G) Time course and (H) peak amplitude and area under the curve (I) of sensory-evoked hemodynamic responses from 4 seconds of stimulation before and after treatment (n=6). All values are mean values±s.e.m.
Figure 4
Figure 4
Glutamatergic and GABA-A receptor antagonists do not attenuate hemodynamic responses evoked by cortical optogenetic stimulation in VGAT-ChR2 mice. (A) Timeline for pharmacology experiments. Baseline hemodynamic responses were assessed before application of NBQX and MK801 to the brain. Post-treatment hemodynamic assessment began after a 30 minutes incubation period. Picrotoxin was directly applied to the cortex (which already has been incubated with glutamatergic antagonists) for 30 minutes before hemodynamic responses were assessed for a third time in the same animal. (B) Time course from optogenetically evoked increases in blood flow from 1.0 second stimulation, at baseline and after application of NBQX and MK-801 (B), and after incubation with Picrotoxin (C). (D) Alteration in peak blood velocity (laser speckle) at three stimulus durations (1.0, 0.5, and 0.1 seconds) from each condition (Baseline, glutamatergic antagonists, and after the addition of picrotoxin). All values are mean values±s.e.m.

Similar articles

Cited by

References

    1. 1Raichle ME, Mintun MA. Brain work and brain imaging. Annu Rev Neurosci 2006; 29: 449–476. - PubMed
    1. 2Zhao S, Ting JT, Atallah HE, Qiu L, Tan J, Gloss B et al. Cell type–specific channelrhodopsin-2 transgenic mice for optogenetic dissection of neural circuitry function. Nat Methods 2011; 8: 745–752. - PMC - PubMed
    1. 3Cardin JA, Carlén M, Meletis K, Knoblich U, Zhang F, Deisseroth K et al. Driving fast-spiking cells induces gamma rhythm and controls sensory responses. Nature 2009; 459: 663–667. - PMC - PubMed
    1. 4Niessing J, Ebisch B, Schmidt KE, Niessing M, Singer W, Galuske RA. Hemodynamic signals correlate tightly with synchronized gamma oscillations. Science 2005; 309: 948–951. - PubMed
    1. 5Sumiyoshi A, Suzuki H, Ogawa T, Riera JJ, Shimokawa H, Kawashima R. Coupling between gamma oscillation and fMRI signal in the rat somatosensory cortex: Its dependence on systemic physiological parameters. NeuroImage 2012; 60: 738–746. - PubMed

Publication types

MeSH terms