. 2015 Aug;35(8):1224-32.
doi: 10.1038/jcbfm.2015.138. Epub 2015 Jun 17.

Noninvasive high-speed photoacoustic tomography of cerebral hemodynamics in awake-moving rats

Affiliations

Noninvasive high-speed photoacoustic tomography of cerebral hemodynamics in awake-moving rats

Jianbo Tang et al. J Cereb Blood Flow Metab. 2015 Aug.

Abstract

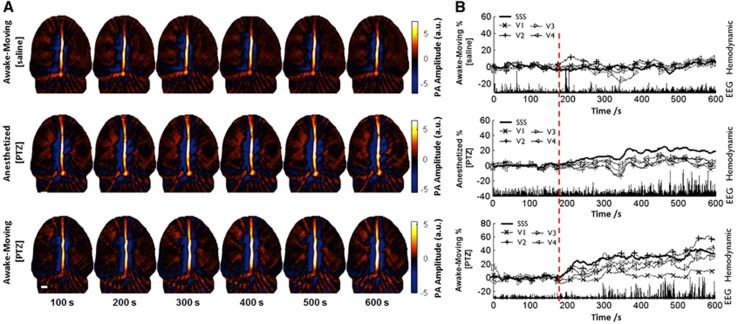
We present a noninvasive method of photoacoustic tomography (PAT) for imaging cerebral hemodynamics in awake-moving rats. The wearable PAT (wPAT) system has a size of 15 mm in height and 33 mm in diameter, and a weight of ~8 g (excluding cabling). The wPAT achieved an imaging rate of 3.33 frames/s with a lateral resolution of 243 μm. Animal experiments were designed to show wPAT feasibility for imaging cerebral hemodynamics on awake-moving animals. Results showed that the cerebral oxy-hemoglobin and deoxy-hemoglobin changed significantly in response to hyperoxia; and, after the injection of pentylenetetrazol (PTZ), cerebral blood volume changed faster over time and larger in amplitude for rats in awake-moving state compared with rats under anesthesia. By providing a light-weight, high-resolution technology for in vivo monitoring of cerebral hemodynamics in awake-behaving animals, it will be possible to develop a comprehensive understanding on how activity alters hemodynamics in normal and diseased states.


Figures

Figure 1
Figure 1
Wearable photoacoustic tomography (wPAT) imaging system and validation. (A) Photograph of wPAT probe. (B) Schematic diagram of 64-element PAT transducer array manufactured with polyvinylidene fluoride (PVDF) film. Top, separated positive face; bottom, shared negative face. (C) Detected ultrasound signal of one element (top) and its frequency response (bottom). (D) Schematic diagram of wPAT light illumination and energy monitoring system. (E) Noninvasive wPAT image of an awake-moving rat brain with skin and skull intact, data acquired with six times averaging. Units of colorbar are arbitrary (a.u.).
Figure 2
Figure 2
The spatial resolution evaluation. (A) Simulated cross-sectional ultrasound detection domain for wearable photoacoustic tomography (wPAT). (B) Cross-sectional wPAT image (top) and profile (bottom) along the line connecting the two copper rods (diameter=50 μm). (C) Photograph (left) and wPAT image (right) of a phantom sample with three hairs (diameter=~70 μm each) embedded at a depth of 2 mm. Units of colorbars are arbitrary (a.u.).
Figure 3
Figure 3
Functional imaging ability assessment of wearable photoacoustic (PA) tomography (wPAT). (A) Photograph of a rat brain with scalp and skull removed after the imaging experiment. (B) wPAT images at 710 nm; the rat was in normoxia at the 50th second, 200th second, 500th second, and 800th second; the rat was under hyperoxia at the 125th second, 275th second, 575th second, and 875th second. SSS, superior sagittal sinus; V1, V2, V3, and V4, major cortical blood vessel regions 1, 2, 3, and 4, respectively. (C) Schematic diagram of the experiment setup. (D) Optical absorption coefficients of oxy-hemoglobin (HbO) and deoxy-hemoglobin (HbR). (E) Hemodynamic time courses of SSS, V1, V2, V3, and V4 at 1,064 nm (HbO), 710 nm (HbR), and 797 nm (HbT); the rat was applied with oxygen gas in the periods marked with shaded gray color. Length of scale bar: 1 mm. Units of colorbar are arbitrary (a.u.). HO, hyperoxia.
Figure 4
Figure 4
Experiment setup for pentylenetetrazol (PTZ)-induced generalized seizure. (A) Schematic diagram of experimental setup. (B) Dorsal view of rat head overlaid with brain outlines; five regions of interest were marked with red ellipse; two electrodes were implanted in the acentric region for electroencephalography (EEG) recording (location shown with small black circle). SSS, superior sagittal sinus; V1, V2, V3, and V4: major cortical blood vessel regions 1, 2, 3, and 4, respectively. (C) Schematic diagram of the passive weight support system. (D) Three photographs show the moving ability of a rat wearing wearable photoacoustic (PA) tomography (wPAT).
Figure 5
Figure 5
Cerebral blood volume responses for rats under different states. (A) Six time points' wearable photoacoustic (PA) tomography (wPAT) images, overlaid onto a revised picture of a rat brain. (B) Hemodynamic percent intensity change for each region of interest (ROI) over time and concurrent electroencephalography (EEG) signals (at the bottom of each figure). Top, an awake-moving rat with saline injection; middle, an anesthetized rat with pentylenetetrazol (PTZ) injection; bottom, an awake-moving rat with PTZ injection. All injections were performed at the 180th second, indicated with red dashed line. SSS, superior sagittal sinus; V1, V2, V3, and V4, major cortical blood vessel regions 1, 2, 3, and 4, respectively.
Figure 6
Figure 6
(A) Statistic analysis (mean±s.e.m.) of hemodynamic response percent intensity change of regions of interest (ROIs) for eight rats (four anesthetized and four in awake-moving state); Left panel, 60 seconds after pentylenetetrazol (PTZ) injection relative to baseline (anesthetized state, 3.75±0.49%, 4.98±1%, 1.73±1.66%, 1.48±3.11%, and 8.44±1.27% for superior sagittal sinus (SSS), V1, V2, V3, and V4, respectively; awake-moving state, 8.29±3.69%, 2.29±2.41%, −1.61±5.17%, −3.6±2.11%, and 6.8±6.82% for SSS, V1, V2, V3, and V4, respectively; ANOVA, P<0.05); Right panel, from PTZ injection at the 180th second to the 600th second relative to the baseline (anesthetized state, 10.16±2.28%, 9.28±1.95%, 4.38±2.6%, 2.00±1.12%, and 12.02±1.43% for SSS, V1, V2, V3, and V4, respectively; awake-moving state, 22.1±1.4%, 18.88±2.49%, 19.54±5.13%, 5.89±1.72%, and 19.71±4.45% for SSS, V1, V2, V3, and V4, respectively; ANOVA, P<0.01). (B) Statistic analysis (mean±s.e.m.) of latency time for all ROIs and electroencephalography (EEG) signal. Anesthetized state, 15.75±2.56%, 150.78±44.11%, 73.95±25.61%, 61.95±13.46%, 58.93±15.3%, and 150.03±15.57% for SSS, V1, V2, V3, V4, and EEG, respectively; awake-moving state, 8.3±1.49%, 29.8±12.96%, 8.85±0.99%, 9.28±2.33%, 15.23±2.66%, and 62.3±17.15% for SSS, V1, V2, V3, V4, and EEG, respectively; ANOVA, P<0.01. (C) Correlation analysis between hemodynamic responses and power spectral density; Left, result of an anesthetized rat (Spearmans' Rank correlation analysis, P<0.05, R2=0.45); Right, result of an awake-moving rat (Spearmans' Rank correlation analysis, P<0.05, R2=0.27). (D) Statistic analysis (mean±s.e.m.) of correlation coefficient (R2) for both states; anesthetized state: 0.38±0.050, awake-moving state: 0.18±0.032; ANOVA, P<0.05.

Comment in

  • At long last, PAT hats for the lab rats.
    Sakadžić S. Sakadžić S. J Cereb Blood Flow Metab. 2015 Aug;35(8):1223. doi: 10.1038/jcbfm.2015.136. Epub 2015 Jun 17. J Cereb Blood Flow Metab. 2015. PMID: 26082018 Free PMC article. No abstract available.

Similar articles

Cited by

References

    1. Kerr JN, Nimmerjahn A. Functional imaging in freely moving animals. Curr Opin Neurobiol. 2012;22:45–53. - PubMed
    1. Sawinski J, Wallace DJ, Greenberg DS, Grossmann S, Denk W, Kerr JN. Visually evoked activity in cortical cells imaged in freely moving animals. Proc Natl Acad Sci. 2009;106:19557–19562. - PMC - PubMed
    1. Harvey CD, Collman F, Dombeck DA, Tank DW. Intracellular dynamics of hippocampal place cells during virtual navigation. Nature. 2009;461:941–946. - PMC - PubMed
    1. Vanderwolf CH. Hippocampal electrical activity and voluntary movement in the rat. Electroencephalogr Clin Neurophysiol. 1969;26:407–418. - PubMed
    1. O'Keefe J, Dostrovsky J. The hippocampus as a spatial map. Preliminary evidence from unit activity in the freely-moving rat. Brain Res. 1971;34:171–175. - PubMed

Publication types

LinkOut - more resources