. 2015 Jun 16;8(381):ra59.
doi: 10.1126/scisignal.aaa2155.

Analysis of single-cell cytokine secretion reveals a role for paracrine signaling in coordinating macrophage responses to TLR4 stimulation

Affiliations

Analysis of single-cell cytokine secretion reveals a role for paracrine signaling in coordinating macrophage responses to TLR4 stimulation

Qiong Xue et al. Sci Signal. .

Abstract

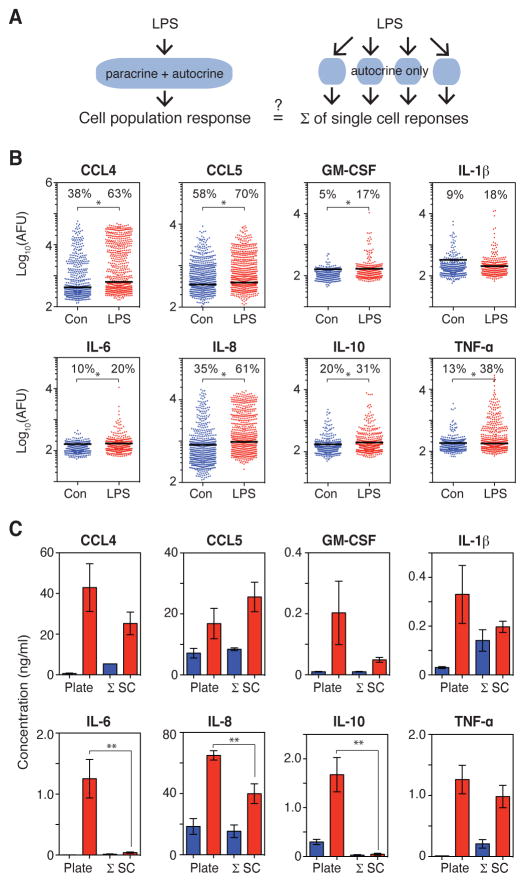
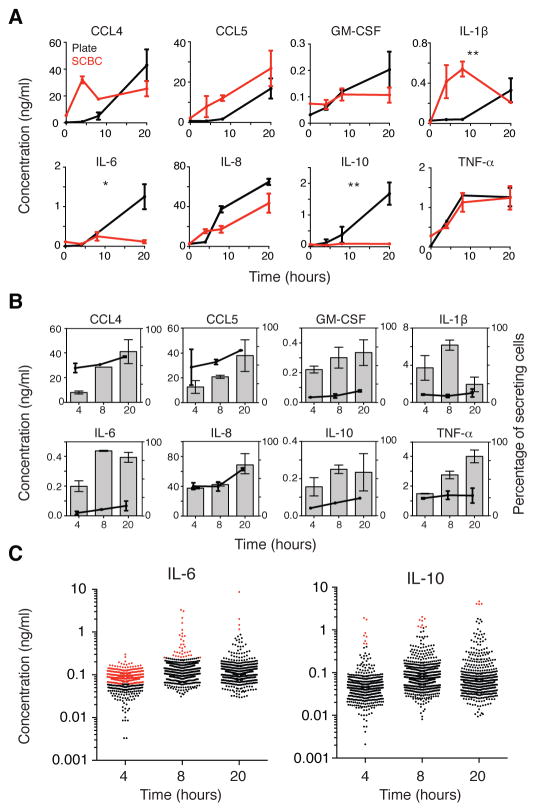
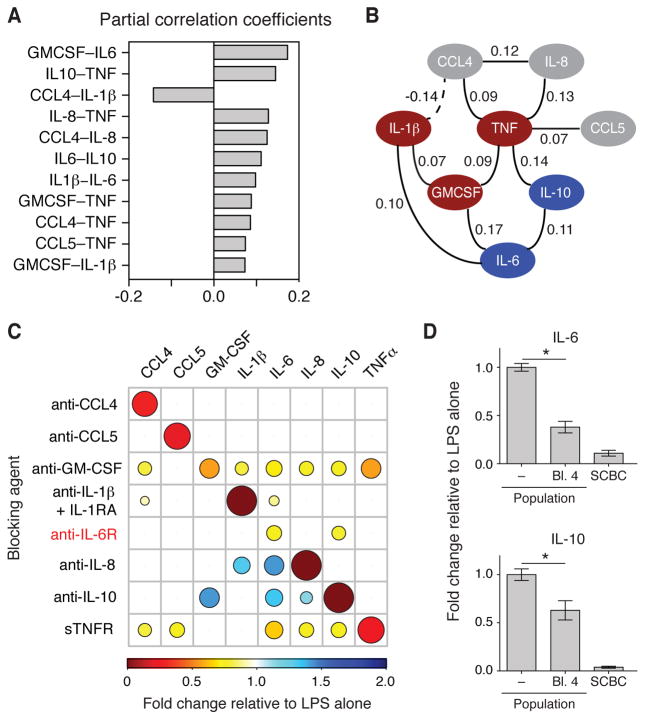
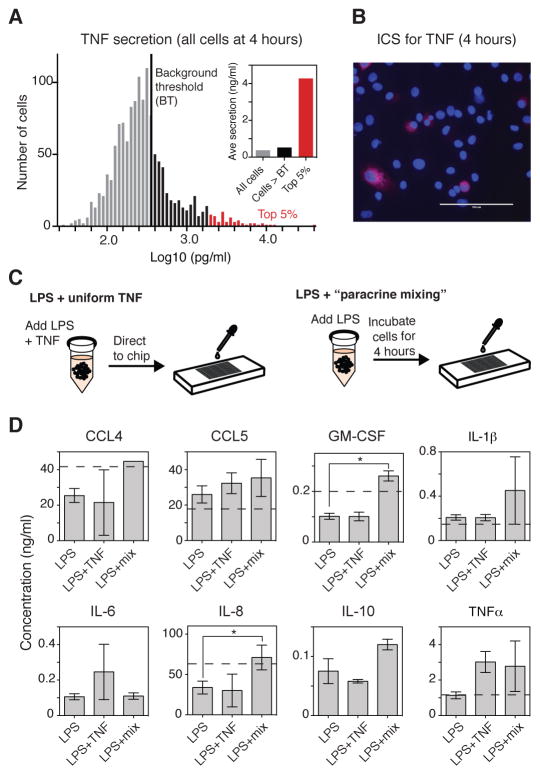
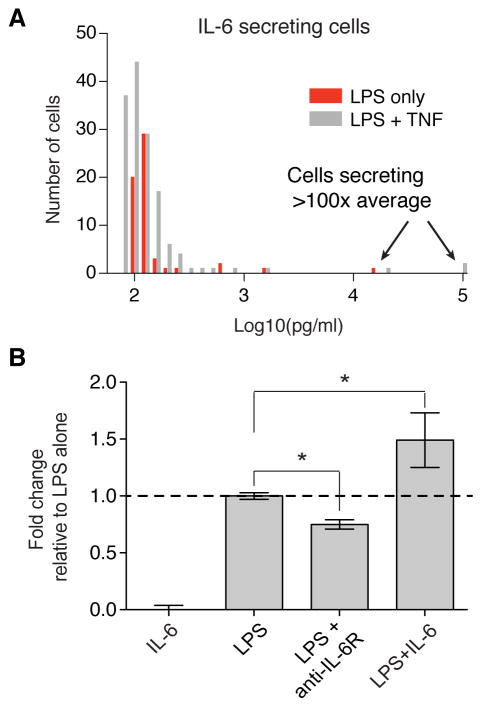
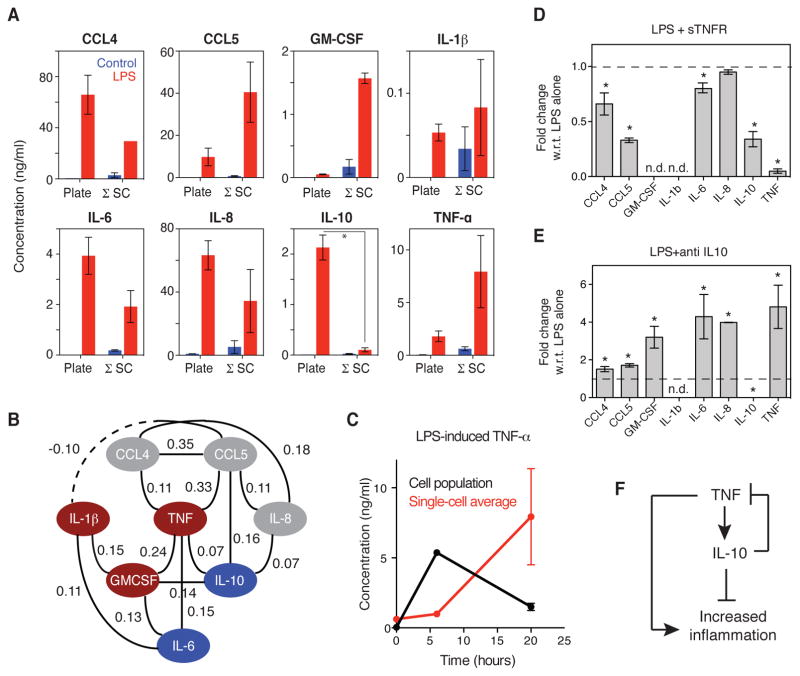
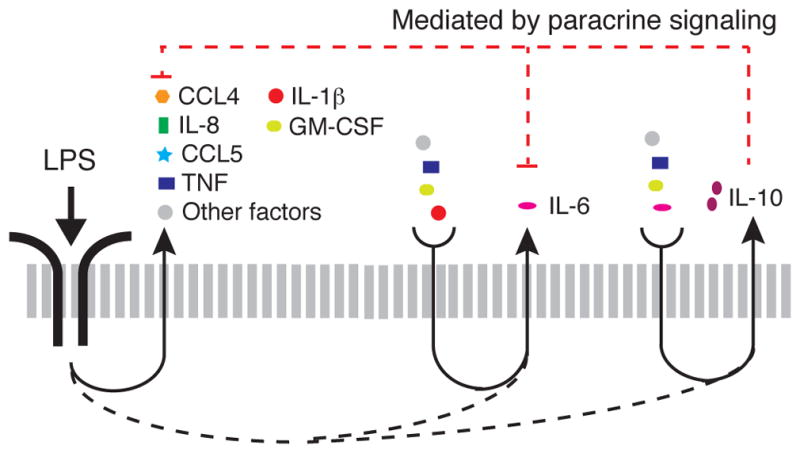
Macrophages not only produce multiple cytokines but also respond to multiple cytokines, which likely shapes the ultimate response of the population. To determine the role of paracrine signaling in shaping the profile of inflammatory cytokines secreted by macrophages in response to stimulation of Toll-like receptor 4 (TLR4) with lipopolysaccharide (LPS), we combined multiplexed, microwell-based measurements of cytokine secretion by single cells with analysis of cytokine secretion by cell populations. Loss of paracrine signaling as a result of cell isolation reduced the secretion by macrophage-like U937 cells and human monocyte-derived macrophages (MDMs) of a subset of LPS-stimulated cytokines, including interleukin-6 (IL-6) and IL-10. Graphical Gaussian modeling (GGM) of the single-cell data defined a regulatory network of paracrine signals, which was validated experimentally in the population through antibody-mediated neutralization of individual cytokines. Tumor necrosis factor-α (TNF-α) was the most influential cytokine in the GGM network. Paracrine signaling by TNF-α secreted from a small subpopulation of "high-secreting" cells was necessary, but not sufficient, for the secretion of large amounts of IL-6 and IL-10 by the cell population. Decreased relative IL-10 secretion by isolated MDMs was linked to increased TNF-α secretion, suggesting that inhibition of the inflammatory response also depends on paracrine signaling. Our results reveal a previously uncharacterized role for cell-to-cell communication within a population in coordinating a rapid innate immune response despite underlying cell-to-cell heterogeneity.


Conflict of interest statement

Competing interests: R.F. has substantial financial interests (including equity) in Isoplexis.

Figures

Fig. 1
Fig. 1. Loss of paracrine signaling in isolated single cells attenuates the LPS-stimulated secretion of some cytokines
(A) LPS-induced inflammatory responses may be altered between cell populations (left) and isolated cells (right) because of the loss of paracrine signaling among isolated cells. (B) Intensities (arbitrary fluorescence units, AFU) of the indicated proteins secreted from single U937 cells treated with vehicle control (blue; n = 586 cells) or LPS for 20 hours (red; n = 601 cells) from one experiment that is representative of two or four independent experiments for control and LPS, respectively. The background threshold (BT) for each protein (black line) is calculated based on the zero-cell wells (see the Materials and Methods). The percentages of cells with secretion intensities above the BT are indicated. *P < 0.05 by Bonferroni-corrected Wilcoxon-Mann-Whitney test. (C) Comparison of the concentrations of the indicated secreted proteins in the culture medium of the cell population (plate) and the average concentration of all single cells cultured in the SCBC (Σ SC) for vehicle-treated (blue) and LPS-treated (red) cells. The protein concentrations in the culture medium of the cell population were measured by ELISA and are means ± standard error of the mean (SEM) of at least three biological replicates. Single-cell secretion intensities were converted to concentrations based on recombinant protein standard curves (fig. S3, and see the Materials and Methods), and concentrations for cells with intensities below the BT were set to zero. Values are means ± SEM of two (control) or four (LPS) biological replicates. **P < 0.05 by t test.
Fig. 2
Fig. 2. Isolated single cells show altered cytokine secretion patterns over time as compared to those of cells in a population
(A) Comparison of the concentrations of the indicated proteins secreted by cells in a population (black) and the average concentration of secreted proteins of all single cells cultured in the SCBC (red) in response to treatment with LPS for the indicated times. Fluorescence intensities for the secreted proteins were converted to concentrations as described earlier and include all cells above the detection threshold (DT) even if they were below the BT (as in fig. S4). Time courses were compared by two-factor analysis of variance (ANOVA). *P < 0.05. **P < 0.01. (B) Average concentrations of the indicated proteins secreted by secreting cells (that is, cells with intensities above the BT; bars, left axis) and the percentages of secreting cells (circles, right axis). Data in (A) and (B) are means ± SEM of at least two independent SCBC or cell population experiments. (C) Concentrations of IL-6 (left) and IL-10 (right) secreted by single U937 cells at 4 (n = 587 cells), 8 (n = 812), and 20 hours (n = 601) after stimulation with LPS. Cells that secreted cytokines at concentrations above those detected in the cultured cell population are indicated in red. Data are from one experiment that is representative of at least two independent experiments.
Fig. 3
Fig. 3. Gaussian graphical modeling of single-cell data reveals paracrine dependencies in the LPS-stimulated network
(A) Significant partial correlation coefficients in the LPS-stimulated cytokine network based on the combined LPS-treated single-cell secretion data (4, 8, and 20 hours). The significance of a partial correlation between two cytokines was evaluated as described in the Materials and Methods and retained if P ≤ 0.06. (B) An undirected graph of the partial correlation coefficients in A is shown, where the solid and dashed lines indicate positive and negative partial correlations, respectively. Cytokines are categorized as being dependent on paracrine signaling for their secretion (blue), being mediators of paracrine signaling (red), or being non-paracrine signals (gray). (C) Changes in the LPS-stimulated secretion by the cell population of the indicated cytokines at 20 hours after stimulation that were caused by the indicated blocking agents (see table S2 for the blocking antibodies and targets). The amounts of secreted cytokines were measured by ELISA or Bio-plex. Data are means of three biological replicates, and only statistically significant results are shown (P < 0.05 by t test; see fig. S8 for bar graphs of the means ± SEM of the complete data set). The colors and sizes of the circles indicate the magnitude of inhibition or enhancement of secretion. (D) Fold-change in the LPS-stimulated secretion of IL-6 (top) and IL-10 (bottom) at 20 hours in the absence or presence of reagents that simultaneously blocked GM-CSF, IL-1β, IL-6, and TNF-α signaling (labeled as “Bl. 4”). The amounts of secreted cytokines were measured by ELISA, and data are means ± SEM of three biological replicates. *P < 0.05 by t test. Data from the SCBC are included for reference.
Fig. 4
Fig. 4. Paracrine signaling enhances cytokine secretion
(A) Distribution of the single-cell secretion of TNF-α 4 hours after stimulation with LPS. Data are from 1329 cells combined from two independent experiments. The BT (black line) is 373 pg/ml. Cells that secreted TNF-α at a concentration above the BT are in black, whereas the top 5% of cells (in terms of amount of TNF-α that they secreted) are in red. Inset: Average secretion for all cells, cells above the BT (black), and the top 5% of cells (red). (B) Staining for intracellular TNF-α (red channel) in a cultured population of U937 cells that were incubated for 4 hours with LPS in the presence of brefeldin A. Cell nuclei were stained with DAPI. Images are representative of two experiments. (C) Schematic of the experimental set-up for testing how the addition of a “uniform TNF-α” signal (1 ng/ml) compared to culturing the cells together for 4 hours (“paracrine mixing”) before they were isolated in the SCBC. (D) Measurement of the average amounts of the indicated cytokines that were secreted by single U937 cells cultured in the SCBC for 20 hours after they had been stimulated with LPS alone, LPS and TNF-α (1 ng/ml), or with LPS followed by “paracrine mixing”. Data are means ± SEM of two independent SCBC experiments (n > 1280 cells for each condition). *P < 0.05 by t test. All cells above the DT were included in the analysis. The dotted line indicates the average amount of the indicated cytokines secreted in a cultured cell population (not shown for IL-6 and IL-10 because of differences in scale).
Fig. 5
Fig. 5. Positive autoregulation of IL-6 may increase cell-to-cell heterogeneity when single cells are isolated
(A) Distribution of the amounts of IL-6 secreted above the BT by 202 cells after 20 hours of incubation with LPS alone (red) or in the presence of TNF (gray). (B) Normalized concentrations of IL-6 secreted by a cell population after 20 hours of treatment with LPS alone, IL-6 alone (100 pg/ml), LPS with an anti-IL-6R antibody, or LPS with recombinant IL-6. The amounts of IL-6 secreted were measured by ELISA, and the final IL-6 concentration was calculated as [concentration measured in sample – concentration measured for recombinant IL-6 without cells]. Data are normalized to treatment with LPS alone and are means ± SEM of two or three biological replicates. *P < 0.05 by t test.
Fig. 6
Fig. 6. Decreased secretion of IL-10 by isolated primary human MDMs is coupled to increased secretion of TNF-α and other inflammatory cytokines
(A) Comparison of the concentrations of the indicated secreted proteins 20 hours after incubation with vehicle (blue) or LPS (red) for cells in a population (left) and in the SCBC (right). Single-cell secretion intensities were converted to concentrations based on recombinant protein standard curves as described earlier (fig. S3 and the Materials and Methods). Secreted cytokine concentrations for the cell population were measured by ELISA. Data are means ± SEM for two independent experiments for both the SCBC (n = 1331 cells) and population experiments. *P < 0.05 by t test. (B) GGM of the LPS-induced signaling network in MDMs inferred from data from single-cell experiments. Edges were included if P < 0.05. Cytokines are colored as described for Fig. 3B. (C) Comparison of the concentration of TNF-α secreted by the cell population (black) and the average concentration of TNF-α secreted by single cells cultured in the SCBC (red) at 0, 6, and 20 hours after stimulation with LPS. (D and E) Fold-changes in the LPS-stimulated secretion of the indicated cytokines after 20 hours of incubation in the context of blocking (D) TNF-α or (E) IL-10 signaling. The amounts of the cytokines secreted were measured by Bio-plex and are means ± SEM of three biological replicates. *P < 0.05 by t test compared to cells treated with LPS alone. (F) Network diagram of an I1-FFL formed by TNF-α and IL-10 (see Discussion).
Fig. 7
Fig. 7. Schematic model illustrating how paracrine signaling drives LPS-stimulated cytokine secretion
Most macrophages stimulated with LPS secrete CCL4, CCL5, and IL-8, whereas a smaller percentage of cells secrete IL-1β, TNF-α, GM-CSF, IL-6, and IL-10. The secretion of IL-6 and IL-10 are dependent on paracrine signals from the subset of cells that secrete IL-1β, TNF-α, GM-CSF, and other factors not measured in our study. The secretion of IL-10 further depends on paracrine signaling by IL-6. IL-10 is the cytokine whose secretion was most adversely affected by the isolation of MDM cells. Cells that secrete IL-10 inhibit the secretion of TNF-α, GM-CSF and IL-6, as well as of some chemokines (21, 32, 33), which may account for the increased concentrations of TNF-α and GM-CSF that were secreted by isolated MDMs.

References

    1. Spencer SL, Gaudet S, Albeck JG, Burke JM, Sorger PK. Non-genetic origins of cell-to-cell variability in TRAIL-induced apoptosis. Nature. 2009;459:428–432. - PMC - PubMed
    1. Paszek P, Ryan S, Ashall L, Sillitoe K, Harper CV, Spiller DG, Rand DA, White MR. Population robustness arising from cellular heterogeneity. Proc Natl Acad Sci U S A. 2010;107:11644–11649. - PMC - PubMed
    1. Chang HH, Hemberg M, Barahona M, Ingber DE, Huang S. Transcriptome-wide noise controls lineage choice in mammalian progenitor cells. Nature. 2008;453:544–547. - PMC - PubMed
    1. Youk H, Lim WA. Secreting and sensing the same molecule allows cells to achieve versatile social behaviors. Science. 2014;343:1242782. - PMC - PubMed
    1. Janes KA, Gaudet S, Albeck JG, Nielsen UB, Lauffenburger DA, Sorger PK. The response of human epithelial cells to TNF involves an inducible autocrine cascade. Cell. 2006;124:1225–1239. - PubMed

Publication types

MeSH terms

LinkOut - more resources