. 2015 Sep 8;6(26):22934-48.
doi: 10.18632/oncotarget.4473.

Small molecule/ML327 mediated transcriptional de-repression of E-cadherin and inhibition of epithelial-to-mesenchymal transition

Affiliations

Small molecule/ML327 mediated transcriptional de-repression of E-cadherin and inhibition of epithelial-to-mesenchymal transition

Hanbing An et al. Oncotarget. .

Abstract

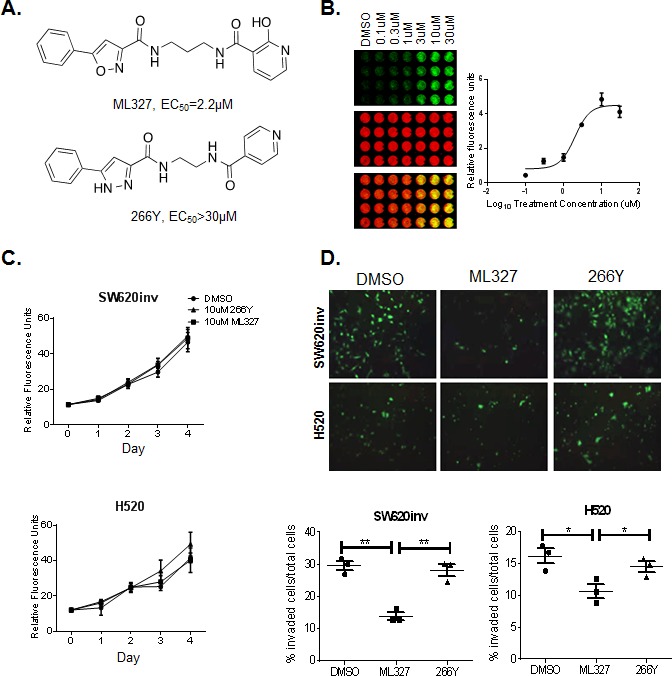
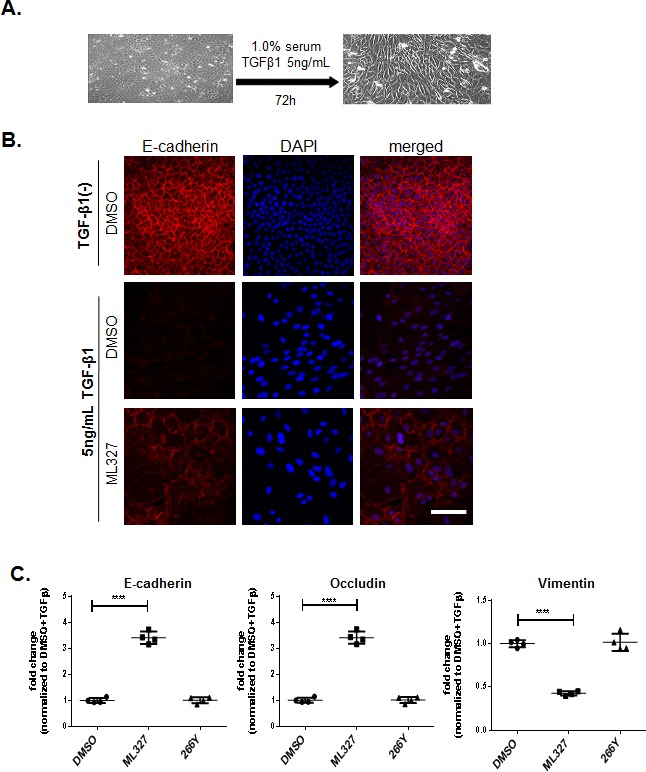
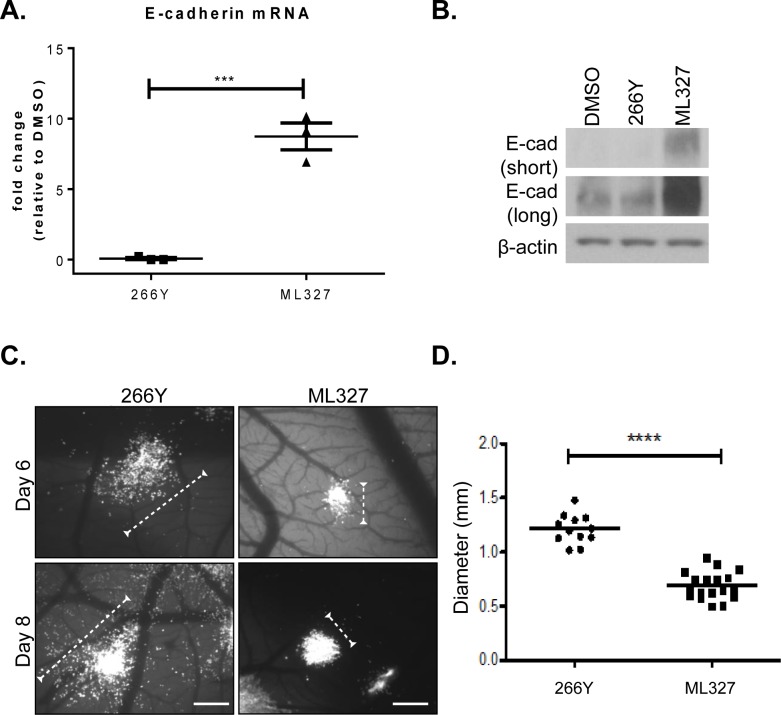
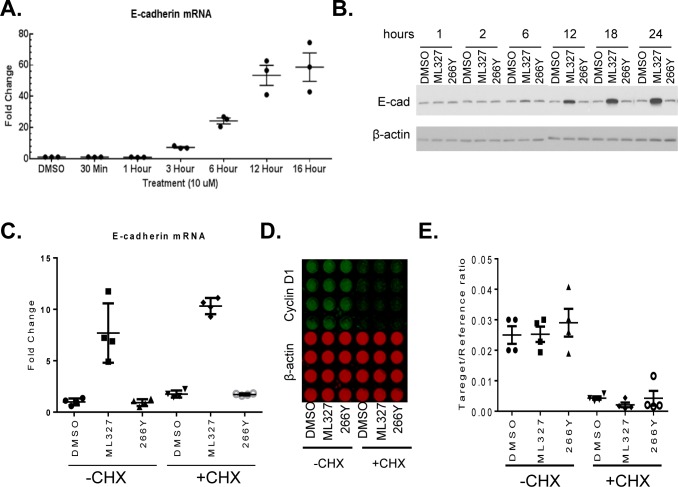
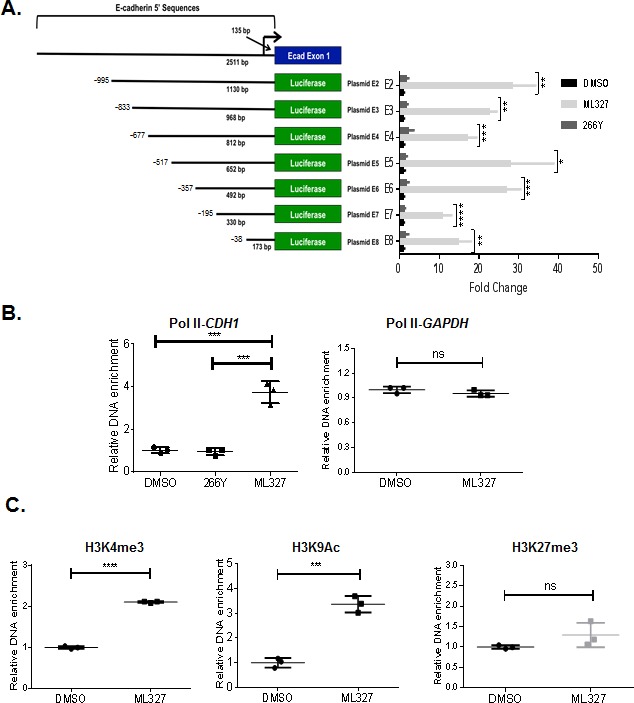
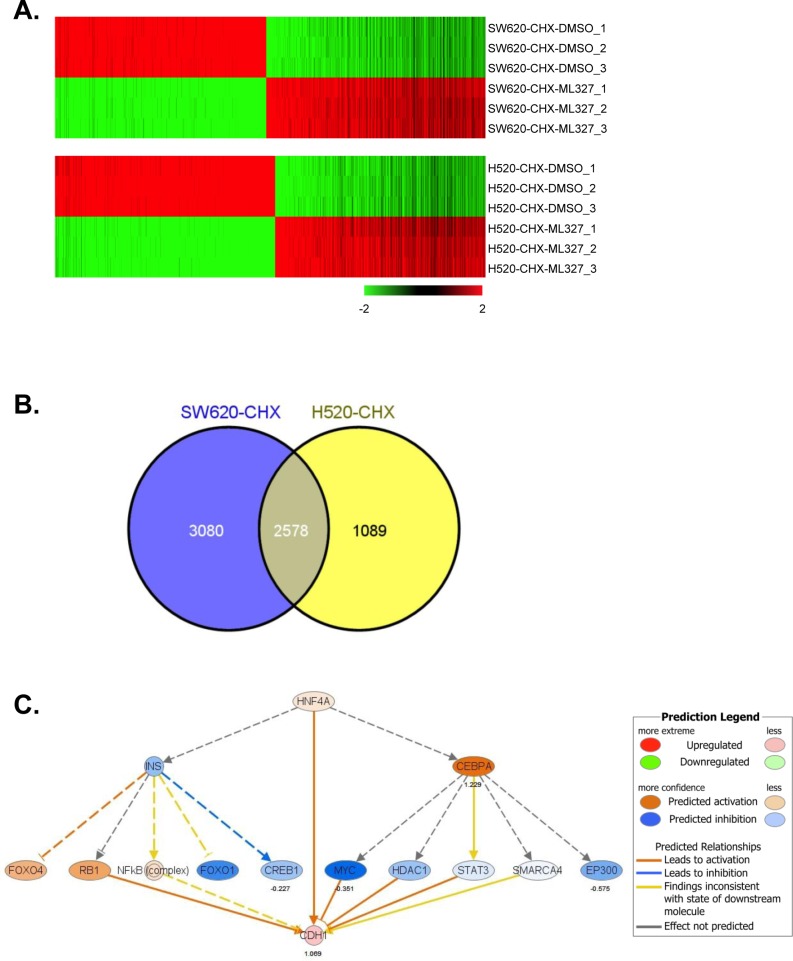
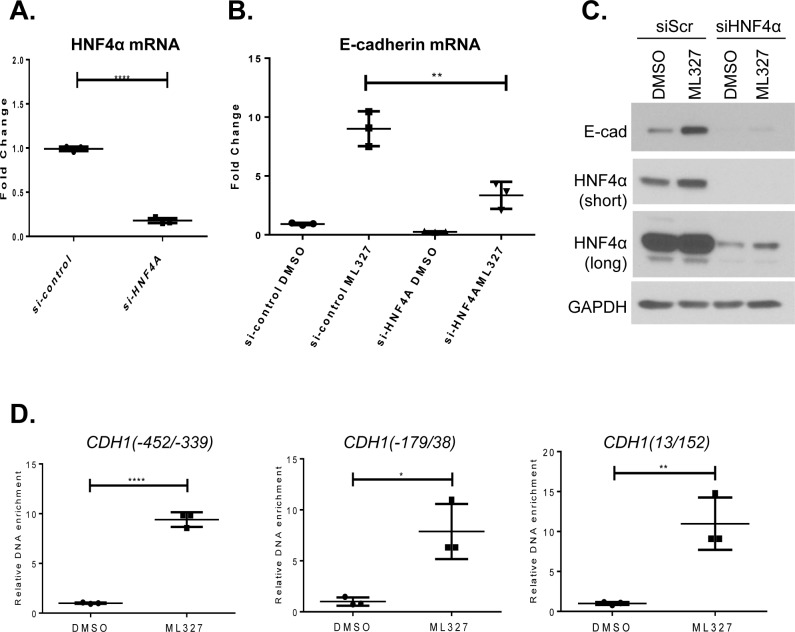
Transcriptional repression of E-cadherin is a hallmark of Epithelial-to-Mesenchymal Transition (EMT) and is associated with cancer cell invasion and metastasis. Understanding the mechanisms underlying E-cadherin repression during EMT may provide insights into the development of novel targeted therapeutics for cancer. Here, we report on the chemical probe, ML327, which de-represses E-cadherin transcription, partially reverses EMT, and inhibits cancer cell invasiveness and tumor cell migration in vitro and in vivo. Induction of E-cadherin mRNA expression by ML327 treatment does not require de novo protein synthesis. RNA sequencing analysis revealed that ML327 treatment significantly alters expression of over 2,500 genes within three hours in the presence of the translational inhibitor, cycloheximide. Network analysis reveals Hepatocyte Nuclear Factor 4-alpha (HNF4α) as the most significant upstream transcriptional regulator of multiple genes whose expressions were altered by ML327 treatment. Further, small interfering RNA-mediated depletion of HNF4α markedly attenuates the E-cadherin expression response to ML327. In summary, ML327 represents a valuable tool to understand mechanisms of EMT and may provide the basis for a novel targeted therapeutic strategy for carcinomas.

Keywords: E-cadherin; EMT; small molecule.


Conflict of interest statement

CONFLICTS OF INTEREST

None.

Figures

Figure 1
Figure 1. Treatment with ML327 reduces cancer cell invasive potential but has no effect on cell viability
A. Chemical structures of ML327 and its inactive analogue, 266Y. Effective dose is listed for each compound. B. Representative in cell western (ICW) plate showing concentration-dependent changes in E-cadherin protein (green) relative to β-actin (red) following treatment with ML327 concentration as indicated. The graph shows mean values with standard error bars from 3 replicate plates. C. SW620inv and H520 cells were cultured in the presence of 10μM ML327, 10μM 266Y or DMSO for up to 4 days. Individual wells (n = 4 per group) were harvested for DNA content measures by fluorometry at 24 hour intervals. Mean fluorescence units (FU) is graphed with standard deviations for replicate wells in a representative experiment. The graphs are representative of at least three separate experiments with similar results. D. TOP: Images (200x magnification) of invading fluorescently labeled SW620inv and H520 cells cultured on Matrigel-coated transwells in the presence of 10μM ML327, 10μM 266Y or DMSO. BOTTOM: The proportion of stained cells that invaded through the transwell is graphed with a bar indicating the mean value and the whiskers indicating the standard deviation for 3 replicate wells in a representative experiment, statistical significance was calculated using unpaired t test, ** indicates p < 0.005, * indicates p < 0.05. The graphed data is representative of at least three separate experiments with similar results.
Figure 2
Figure 2. Treatment with ML327 partially reverses TGF-β-induced EMT
A. Bright field microcopy images (200x magnification) showing the cell morphology after 72 hours TGF- β1 treatment. B. Immunofluorescence images showing E-cadherin (red) expression and localization in NMuMg cells following treatment without or with 5ng/mL TGF-β1 for 72 hours, then adding either DMSO, or 10 μM ML327 for an additional 48 hours. Nuclei (blue) are labeled with DAPI. Bar = 100 μM. C. Relative levels of E-cadherin, Occludin and Vimentin specific mRNA species in NMuMg cells following treatments shown in B., the graph shows mean values with standard error bars from 4 replicate wells in a representative experiment. Statistical significance was calculated using unpaired t test **** indicates p < 0.0001. These experiments have been done at least three separate times with similar results.
Figure 3
Figure 3. Treatment with ML327 inhibits tumor cell migration in vivo
A. Relative E-cadherin mRNA expression in HEp3 cells following 6 hours treatment with either 266Y or ML327, the graph shows mean values with standard error bars from 3 replicate wells in a representative experiment, statistical significance was calculated using unpaired t test, *** indicates p < 0.001. The grafted data is representative of three separate experiments with similar results. B. Western blot showing E-cadherin (E-cad) protein expression (short and long exposure) in HEp3 cells following treatment with DMSO, 266Y or ML327 for 24 hours. C. Avian embryos were treated with compounds 266Y or ML327 24 hours after intravenous injection of GFP-expressing HEp3 cells. Images were acquired using a fluorescent stereoscope at 50X magnification. Representative images are shown, scale bar = 500 μm. D. Graph shows quantification of colony diameter at 6 days post injection. The data represent a total of 30 embryos from two independent experiments: 12 treated with 266Y and 18 treated with ML327. Each data point on the scatterplot represents the geometric mean diameter of 6-10 colonies analyzed per embryo, statistical significance was calculated using Mann Whitney U test, **** indicates p < 0.0001. The graphed data is representative of two separate experiments with similar results.
Figure 4
Figure 4. ML327 increases E-cadherin expression in SW620inv colon cancer cells
A. Quantitative PCR results for E-cadherin specific mRNA in SW620inv cells following treatment with ML327 at the indicated time periods (data points represent results from3 biological replicates). Fold change relative to DMSO treatment is determined by the formula log2−ΔΔCp. B. Western blot shows time dependent changes in SW620inv E-cadherin (E-cad) protein expression relative to β-actin following treatment with DMSO, 10 μM ML327, or 266Y. C. Quantitative PCR analysis of E-cadherin mRNA in SW620inv cells following 1 hour with or without CHX pretreatment, then adding DMSO, ML327, or 266Y for another 6 hours. Fold change in E-cadherin mRNA, relative to DMSO without CHX is calculated by the formula log2−ΔΔCp. Graphed data represent four independent experiments. D. ICW plate matched to C. showing quantification of cyclin D1 protein (green) and β-actin (red). E.The graph shows quantification of relative cyclin D1 signal matched to D..
Figure 5
Figure 5. ML327 activity exerts its effect at a proximal region of the E-cadherin promoter
A. Diagram of E-cadherin promoter reporter plasmids (E2-E8), and the luciferase activity in SW620inv cells transfected with E2-E8 and treated immediately with DMSO, 10 μM ML327, or 266Y for 24 hours. All samples are normalized to DMSO control for each plasmid transfection group. Statistical significance was calculated using a two-way ANOVA (Holm-Sidak method): **** = p < 0.00005, *** = p < 0.0005, ** = p < 0.005, * = p < 0.05. Data points represent technical replicates (n = 3) from a representative experiment. The graphed data are representative of three separate experiments with similar results. B. Results of ChIP assay demonstrating Polymerase II (Pol II) association with the proximal region (−76/64) of the CDH1 promoter, or GAPDH promoter following 4 hours treatment of SW620inv cells with either DMSO, 10μM ML327, or 10μM 266Y (results from a representative experiment with n = 3 technical replicates shown), statistical significance was calculated using unpaired t test, *** indicates p < 0.001, ns indicates p > 0.05. The graphed data are representative of three separate experiments with similar results. C. Results of ChIP assay demonstrating H3K4me3, H3K9Ac, and H3K27me3 association with the proximal region (−76/64) of the CDH1 promoter following 4 hours treatment of SW620inv cells with either DMSO, or 10μM ML327 (results from a representative experiment with n = 3 technical replicates shown), statistical significance was calculated using unpaired t test, **** indicates p < 0.0001, *** indicates p < 0.001, ns indicates p > 0.05. The graphed data are representative of three separate experiments with similar results.
Figure 6
Figure 6. ML327 alters gene expression in a pattern implicating HNF4α
A. Heat map of 5658 genes (FDR < 0.0001) was significantly altered in SW620inv cells (2881 upregulated genes, 2777 down-regulated genes), and 3667 genes (FDR < 0.0001) was altered in H520 cells (1792 upregulated genes, 1875 down-regulated genes) in a comparison (CHX-ML327 versus CHX-DMSO), each cell line comparison has three biological replicates. B. Venn diagram showing the intersection of the lists of differentially expressed genes in SW620inv and H520 cells. C. HNF4α network from the Ingenuity analysis based on the common differentially expressed genes. Oval nodes indicate transcription factors, solid lines connecting nodes indicate direct interactions and dashed lines indicate indirect interactions. Arrows indicate activation and stops indicate inhibition.
Figure 7
Figure 7. HNF4α is associated with ML327 activity
A. Quantitative PCR analysis of HNF4α mRNA in SW620inv cells following transient transfection with either ON-target plus Non-targeting Pool control siRNA or HNF4α specific ON-target plus SMART pool siRNA for 48 hours. Fold change relative to si-control is determined by the formula log2−ΔΔCp, statistical significance was calculated using unpaired t test, *** indicates p < 0.001(results from a representative experiment with n = 3 technical replicates are shown). The graphed data are representative of three separate experiments with similar results. B. Quantitative PCR results for E-cadherin specific mRNA in SW620inv cells following HNF4α knock down with siRNA for 48 hours, then treatment with DMSO or 10μM ML327 for 6 hours, Fold change relative to si-control with DMSO treatment is determined by the formula log2−ΔΔCp, statistical significance was calculated using unpaired t test, ** indicates p < 0.01(results from a representative experiment with n = 3 technical replicates are shown). The graphed data are representative of three separate experiments with similar results. C. Western blot showing the effect of HNF4α siRNA mediated knock-down (siScr = control, 48hr. recovery following transfection) on E-cadherin (Ecad) protein expression following treatment with DMSO or 10μM ML327 for 6 hours. HNF4α (short and long exposures) and E-cadherin protein levels are shown. D. Relative enrichment of HNF4α binding to the proximal region of the CDH1 promoter following 4 hour treatment of SW620inv cells with either DMSO, or 10μM ML327 (results from a representative experiment with n = 3 technical replicates are shown), statistical significance was calculated using unpaired t test, **** indicates p < 0.0001, ** indicates p < 0.01, * indicates p < 0.05. The graphed data are representative of at least three separate experiments with similar results.

References

    1. Jemal A, Siegel R, Ward E, Murray T, Xu J, Thun MJ. Cancer statistics, 2007. CA: a cancer journal for clinicians. 2007;57:43–66. - PubMed
    1. Gupta GP, Massague J. Cancer metastasis: building a framework. Cell. 2006;127:679–695. - PubMed
    1. Kang Y, Massague J. Epithelial-mesenchymal transitions: twist in development and metastasis. Cell. 2004;118:277–279. - PubMed
    1. Schneider MR, Kolligs FT. E-cadherin's role in development, tissue homeostasis and disease: Insights from mouse models: Tissue-specific inactivation of the adhesion protein E-cadherin in mice reveals its functions in health and disease. Bioessays. 2015;37:294–304. - PubMed
    1. Guilford PJ, Hopkins JB, Grady WM, Markowitz SD, Willis J, Lynch H, Rajput A, Wiesner GL, Lindor NM, Burgart LJ, Toro TT, Lee D, Limacher JM, Shaw DW, Findlay MP, Reeve AE. E-cadherin germline mutations define an inherited cancer syndrome dominated by diffuse gastric cancer. Human mutation. 1999;14:249–255. - PubMed

Publication types

MeSH terms