. 2015 Jul 23;126(4):508-19.
doi: 10.1182/blood-2014-11-611194. Epub 2015 Jun 16.

Whole-genome sequencing reveals oncogenic mutations in mycosis fungoides

Affiliations

Whole-genome sequencing reveals oncogenic mutations in mycosis fungoides

Laura Y McGirt et al. Blood. .

Abstract

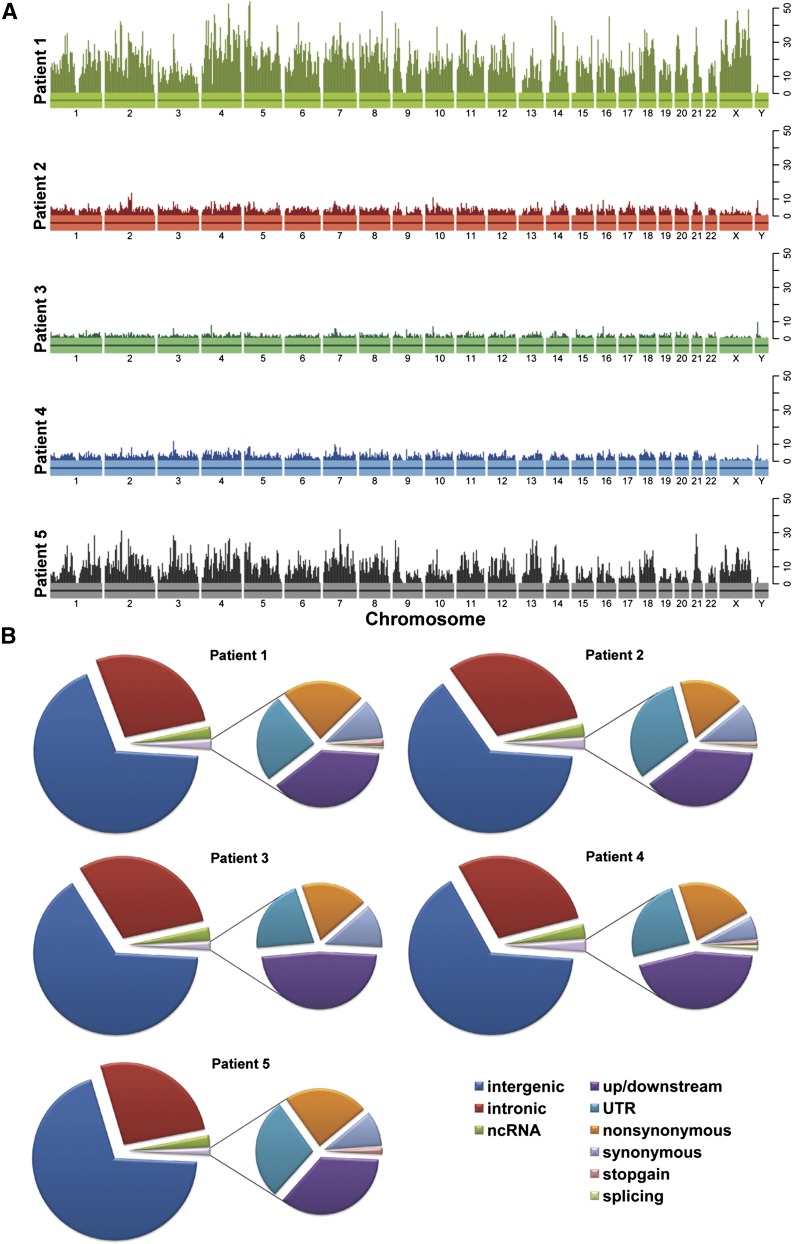
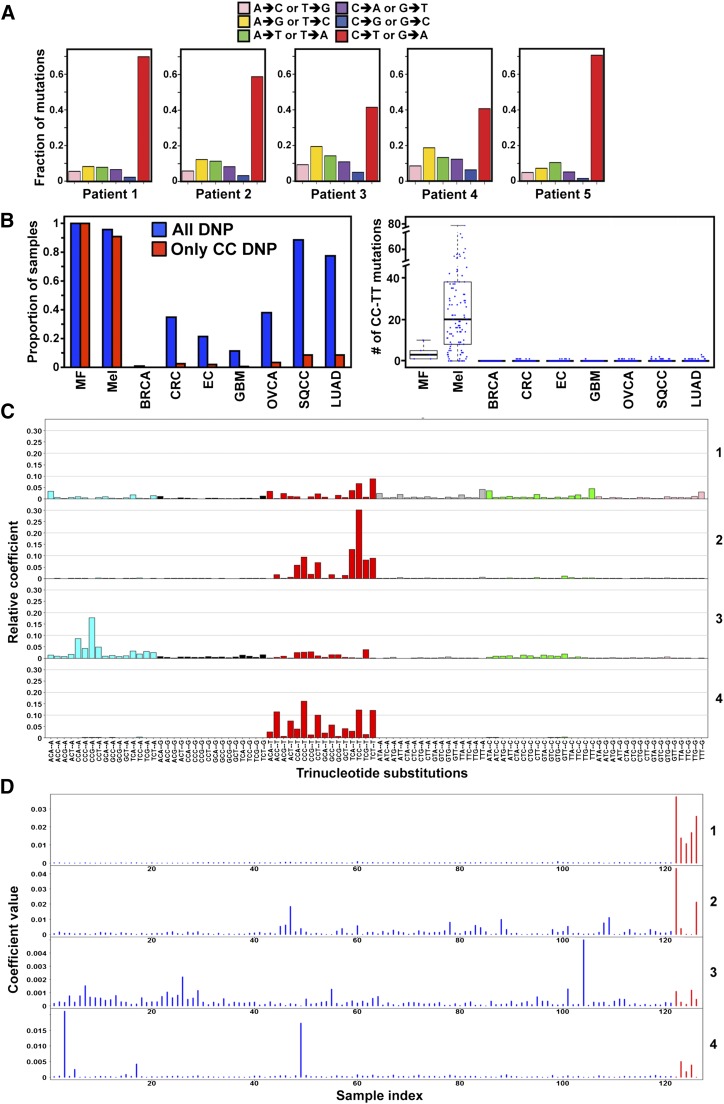
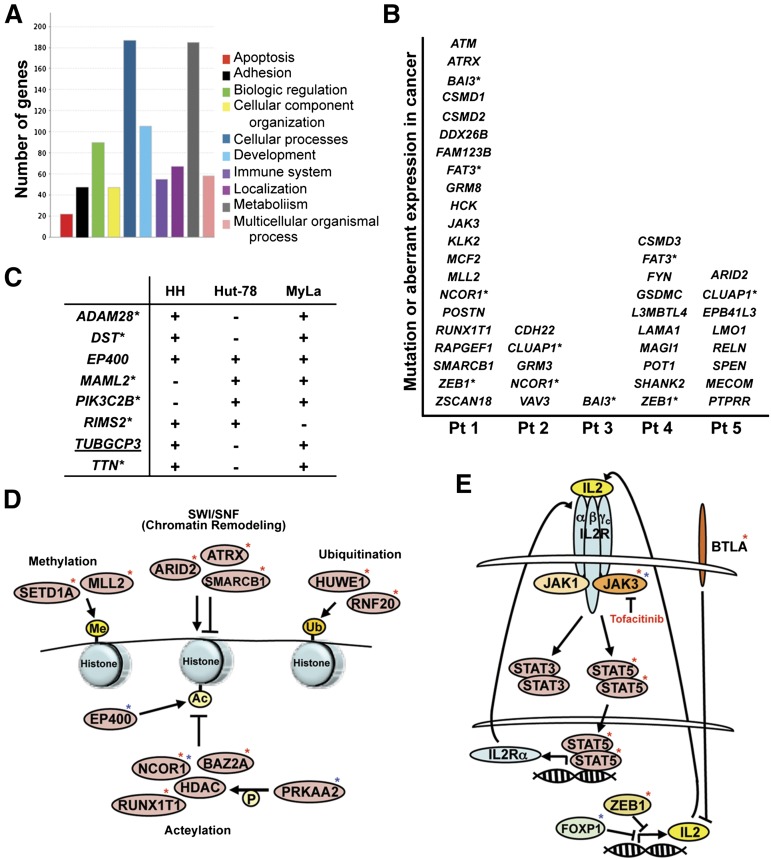
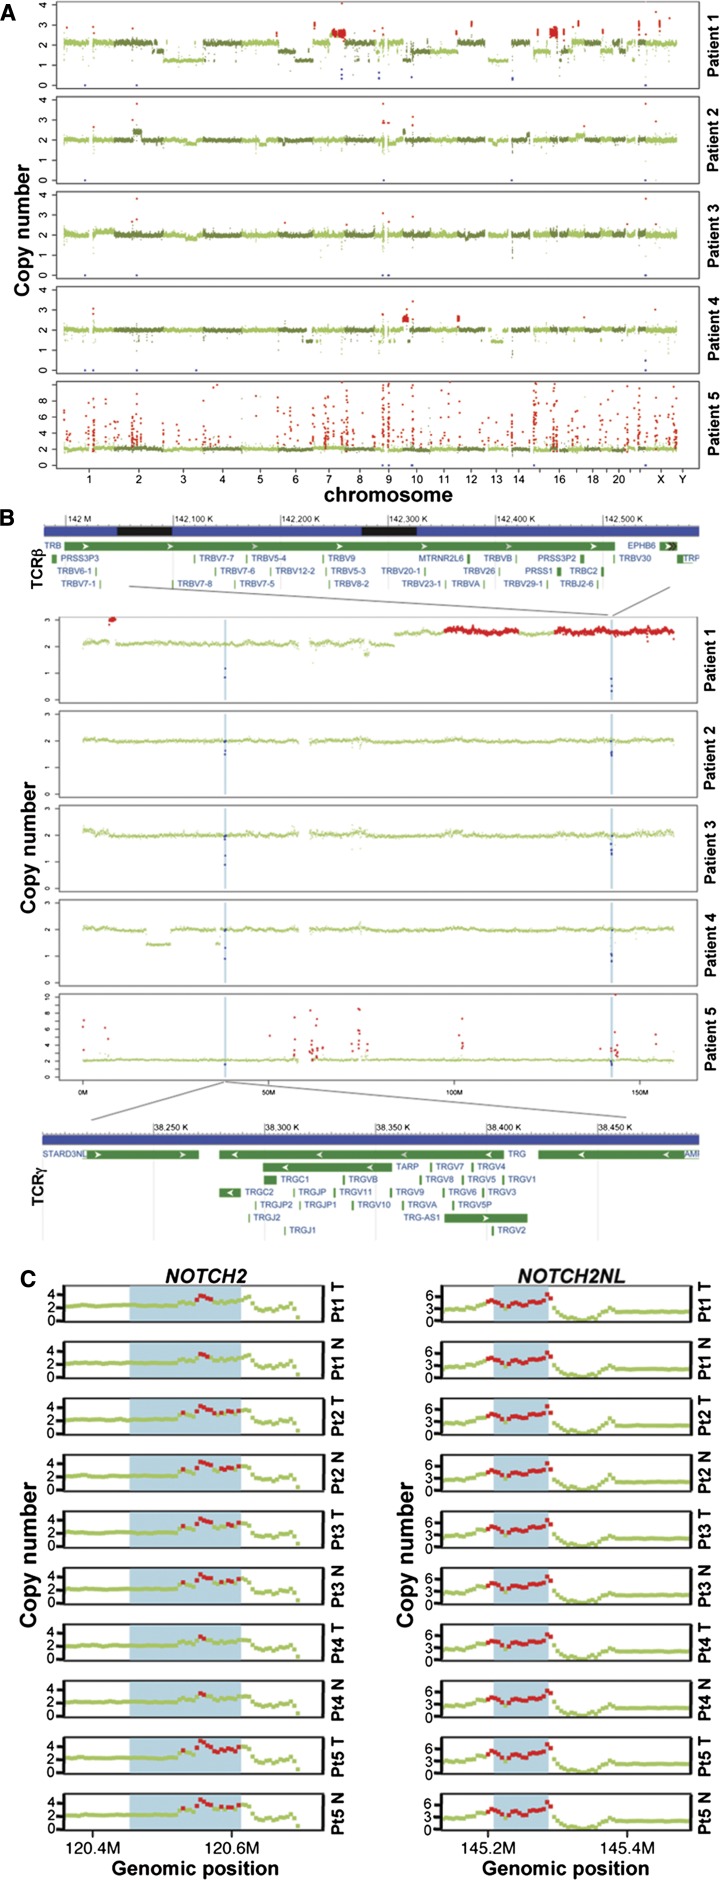
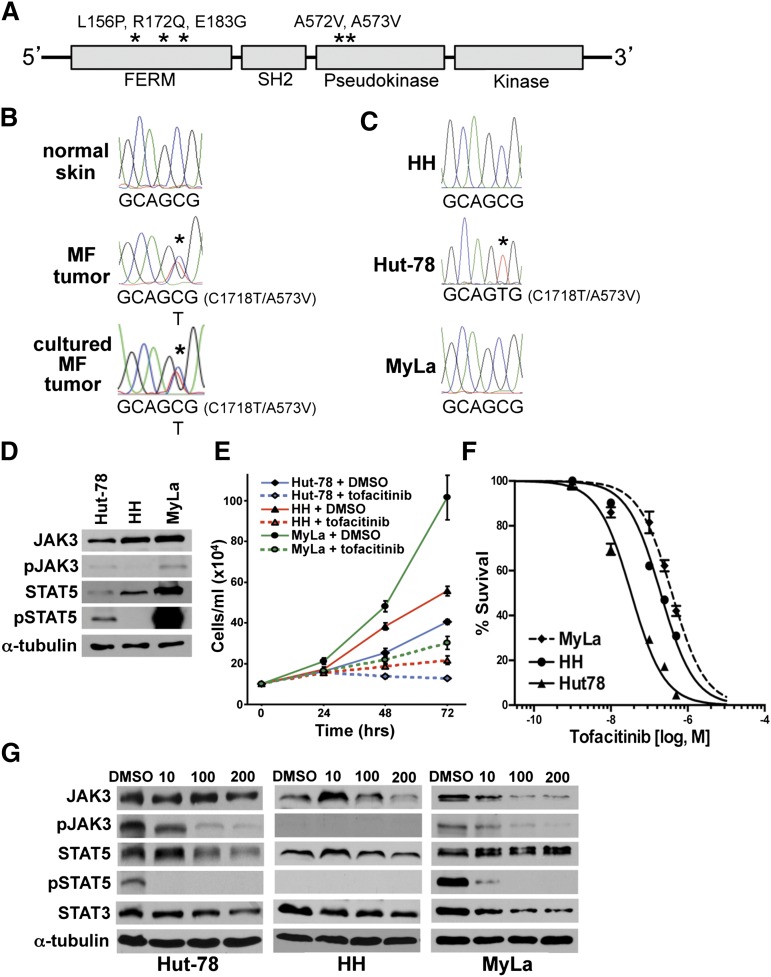
The pathogenesis of mycosis fungoides (MF), the most common cutaneous T-cell lymphoma (CTCL), is unknown. Although genetic alterations have been identified, none are considered consistently causative in MF. To identify potential drivers of MF, we performed whole-genome sequencing of MF tumors and matched normal skin. Targeted ultra-deep sequencing of MF samples and exome sequencing of CTCL cell lines were also performed. Multiple mutations were identified that affected the same pathways, including epigenetic, cell-fate regulation, and cytokine signaling, in MF tumors and CTCL cell lines. Specifically, interleukin-2 signaling pathway mutations, including activating Janus kinase 3 (JAK3) mutations, were detected. Treatment with a JAK3 inhibitor significantly reduced CTCL cell survival. Additionally, the mutation data identified 2 other potential contributing factors to MF, ultraviolet light, and a polymorphism in the tumor suppressor p53 (TP53). Therefore, genetic alterations in specific pathways in MF were identified that may be viable, effective new targets for treatment.


Figures

Figure 1
Figure 1
Mutation profiles of patient tumors subjected to WGS. (A) Each patient is plotted with a unique color. The vertical bars indicate the number of predicted, somatic SNVs in a 5-Mb window. (B) Pie charts of functional categories of the predicted somatic SNVs. For each patient, the left pie chart depicts the proportion of somatic mutations in categories based on their genomic location, including intergenic, intronic, ncRNA, and exonic SNVs. The right chart shows the breakdown of different mutation types in coding regions, including upstream/downstream, UTR, nonsynonymous, synonymous, stop-gain SNVs, and SNVs located in splicing sites. Only SNVs not included in dbSNP (build 131) or the 1000 Genome Project (November 2010) are shown. ncRNA, noncoding RNA; UTR, untranslated region.
Figure 2
Figure 2
Mutations in MF appear to have a UV signature. (A) Frequency of different mutation classes in each MF patient. (B) Samples with any DNP and with mutations that specifically change CC in different cancer types (left). The number of CC:GG to TT:AA mutations in the coding regions of each cancer type (right). BRCA: breast cancer, n = 507; CRC: colon and rectal cancer, n = 224; EC: endometrial carcinoma, n = 248; GBM: glioblastoma, n = 290; LUAD: lung adenocarcinoma, n = 182; Mel: melanoma, n = 121; OVCA: ovarian carcinoma, n = 316; SQCC: squamous cell lung cancer, n = 177. (C) Four mutation signatures of MF and melanoma tumors. Each color denotes 1 of the 6 possible trinucleotide mutations. The y-axis denotes the relative coefficient of each substitution to the corresponding signature. (D) Coefficient of each MF (red) and melanoma (blue) tumor for each signature. The sample index for melanoma is x = 1:121 and MF is x = 122:126. A higher coefficient indicates a higher contribution of the corresponding signature in the sample. Only SNVs not in dbSNP (build 131) or the 1000 Genome Project (November 2010) were included.
Figure 3
Figure 3
Specific mutations and the pathways affected. (A) The number of genes in defined biological pathways with mutations in MF. (B) Genes known to have a role in cancer that were identified as mutated in MF tumor patient (Pt) samples. Genes with an asterisk denote that 2 patients had mutated that gene. (C) Genes known to have a role in cancer that were identified as mutated (+) in 2 or more CTCL cell lines. Underlined genes indicate the mutation is identical between cell lines. Genes with asterisks indicate the mutation is identical in the CCLE. (D) Mutations in genes that function in epigenetic modification and chromatin remodeling were identified in patient samples (red asterisk) and cell lines (blue asterisk). Ac, acetylation; Me, methylation; P, phosphorylation; Ub, ubiquitination. (E) Mutations in genes that function in the IL-2 cytokine pathway were identified in patient samples (red asterisk) and cell lines (blue asterisk).
Figure 4
Figure 4
Copy-number alterations in MF tumor genomes. (A) FREEC detection of SCNAs in each patient. X-axis: genomic positions, ordered by chromosomes. Y-axis, copy numbers in tumor compared with the matched normal sample. A copy number of 2 indicates copy number neutral; red: gains, blue: losses, green: no change. (B) Deletion regions on chromosome 7 that involve T-cell receptor genes (annotations are based on human reference GRCh37/hg19); TRB: T-cell receptor β locus. TRG: T-cell receptor γ locus. (C) Amplification at the NOTCH2 and NOTCH2NL loci in normal (N) and tumor (T) of each patient (Pt). Red dots: copy number ≥3. The blue shade shows the respective gene region: NOTCH2 (chr1:120454176-120612317) and NOTCH2NL (chr1: 145209111-145285912) based on UCSC Genome Browser hg19. A copy number of 2 is neutral.
Figure 5
Figure 5
Activating JAK3 mutation identified in MF tumor and CTCL cell line. (A) JAK3 schematic with functional domains denoted. Activating JAK3 mutations previously reported and identified in this study marked with asterisks. (B) Chromatographs of Sanger sequencing of normal and tumor DNA from patient 1. The C1718T transition is detected in the tumor sample only. (C) Sequencing of CTCL cell lines showing the C1718T transition in Hut-78 cells. (D) western blots of JAK3 and proteins in its downstream pathway in CTCL cell lines; phosphorylated JAK3 (pJAK3) phosphorylated STAT5 (pSTAT5). (E) Viable cell numbers of CTCL cell lines at intervals following addition of 200 nM tofacitinib. (F-G) CTCL cell lines subjected to MTS assay (tofacitinib 1, 10, 100, 250, and 500 nM) (F) and western blot (tofacitinib 10, 100, 200 nM) (G) after 48 hours of treatment.

References

    1. Kim YH, Liu HL, Mraz-Gernhard S, Varghese A, Hoppe RT. Long-term outcome of 525 patients with mycosis fungoides and Sezary syndrome: clinical prognostic factors and risk for disease progression. Arch Dermatol. 2003;139(7):857–866. - PubMed
    1. Jackow CM, Cather JC, Hearne V, Asano AT, Musser JM, Duvic M. Association of erythrodermic cutaneous T-cell lymphoma, superantigen-positive Staphylococcus aureus, and oligoclonal T-cell receptor V beta gene expansion. Blood. 1997;89(1):32–40. - PubMed
    1. Tan RS, Butterworth CM, McLaughlin H, Malka S, Samman PD. Mycosis fungoides—a disease of antigen persistence. Br J Dermatol. 1974;91(6):607–616. - PubMed
    1. Wohl Y, Tur E. Environmental risk factors for mycosis fungoides. Curr Probl Dermatol. 2007;35:52–64. - PubMed
    1. McGirt LY, Adams CM, Baerenwald DA, Zwerner JP, Zic JA, Eischen CM. miR-223 regulates cell growth and targets proto-oncogenes in mycosis fungoides/cutaneous T-cell lymphoma. J Invest Dermatol. 2014;134(4):1101–1107. - PMC - PubMed

Publication types

MeSH terms