. 2015 May 15:7:18.
doi: 10.1186/s13321-015-0067-5. eCollection 2015.

Calculating an optimal box size for ligand docking and virtual screening against experimental and predicted binding pockets

Affiliations

Calculating an optimal box size for ligand docking and virtual screening against experimental and predicted binding pockets

Wei P Feinstein et al. J Cheminform. .

Abstract

Background: Computational approaches have emerged as an instrumental methodology in modern research. For example, virtual screening by molecular docking is routinely used in computer-aided drug discovery. One of the critical parameters for ligand docking is the size of a search space used to identify low-energy binding poses of drug candidates. Currently available docking packages often come with a default protocol for calculating the box size, however, many of these procedures have not been systematically evaluated.

Methods: In this study, we investigate how the docking accuracy of AutoDock Vina is affected by the selection of a search space. We propose a new procedure for calculating the optimal docking box size that maximizes the accuracy of binding pose prediction against a non-redundant and representative dataset of 3,659 protein-ligand complexes selected from the Protein Data Bank. Subsequently, we use the Directory of Useful Decoys, Enhanced to demonstrate that the optimized docking box size also yields an improved ranking in virtual screening. Binding pockets in both datasets are derived from the experimental complex structures and, additionally, predicted by eFindSite.

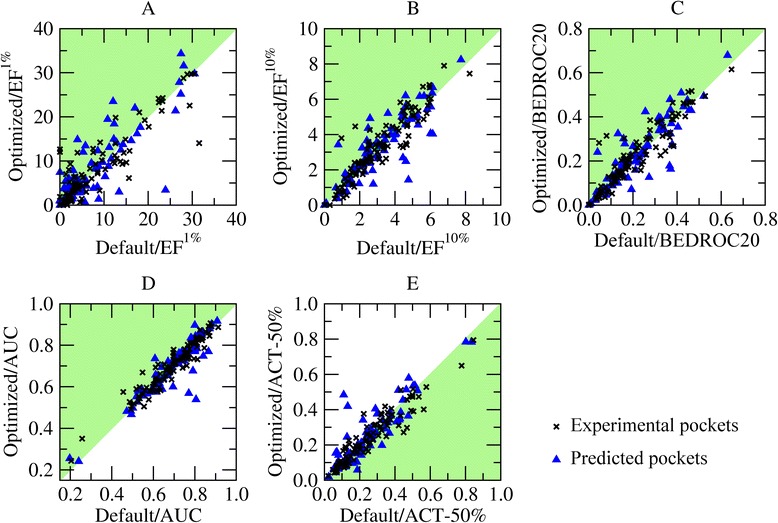
Results: A systematic analysis of ligand binding poses generated by AutoDock Vina shows that the highest accuracy is achieved when the dimensions of the search space are 2.9 times larger than the radius of gyration of a docking compound. Subsequent virtual screening benchmarks demonstrate that this optimized docking box size also improves compound ranking. For instance, using predicted ligand binding sites, the average enrichment factor calculated for the top 1 % (10 %) of the screening library is 8.20 (3.28) for the optimized protocol, compared to 7.67 (3.19) for the default procedure. Depending on the evaluation metric, the optimal docking box size gives better ranking in virtual screening for about two-thirds of target proteins.

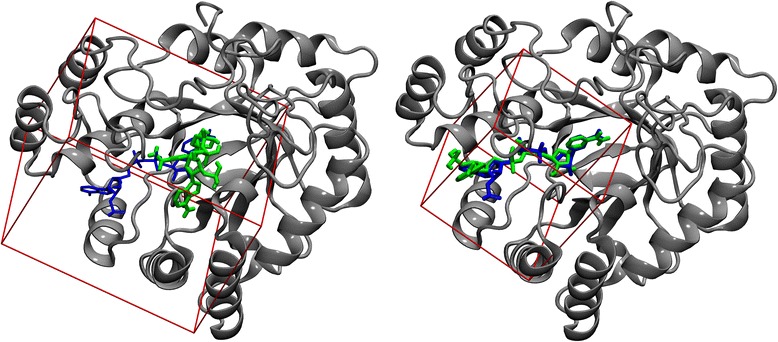
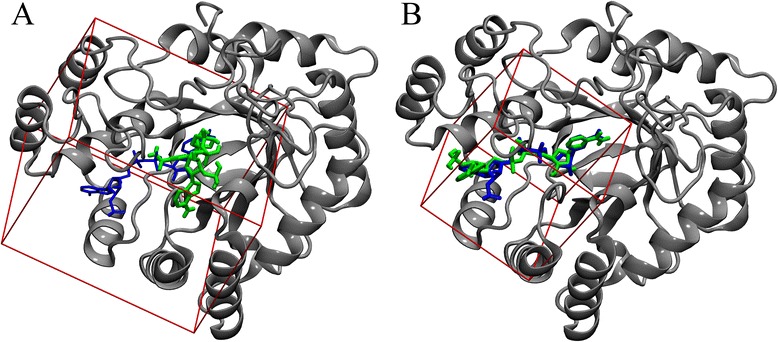
Conclusions: This fully automated procedure can be used to optimize docking protocols in order to improve the ranking accuracy in production virtual screening simulations. Importantly, the optimized search space systematically yields better results than the default method not only for experimental pockets, but also for those predicted from protein structures. A script for calculating the optimal docking box size is freely available at www.brylinski.org/content/docking-box-size. Graphical AbstractWe developed a procedure to optimize the box size in molecular docking calculations. Left panel shows the predicted binding pose of NADP (green sticks) compared to the experimental complex structure of human aldose reductase (blue sticks) using a default protocol. Right panel shows the docking accuracy using an optimized box size.

Keywords: AutoDock Vina; Docking box size; Docking protocols; Ligand binding site prediction; Ligand virtual screening; Molecular docking; Search space.


Figures

Graphical Abstract
Graphical Abstract
We developed a procedure to optimize the box size in molecular docking calculations. Left panel shows the predicted binding pose of NADP (green sticks) compared to the experimental complex structure of human aldose reductase (blue sticks) using a default protocol. Right panel shows the docking accuracy using an optimized box size.
Fig. 1
Fig. 1
Correlation between the radii of gyration calculated using a single and multiple ligand conformations. For each ligand from the PDB-bench dataset, we calculated the radius of gyration (R g) for a single low-energy conformation as well as the average R g±standard deviation for a set of 100 random rotamers. The regression line is shown in black
Fig. 2
Fig. 2
Optimization of the docking box size for Vina using the PDB-bench dataset. Docking accuracy assessed by (a) the RMSD over ligand heavy atoms, (b) the fraction of recovered binding residues, and (c) the fraction of recovered protein-ligand contacts, is plotted as a function of the ratio of the ligand radius of gyration to the box size. The corresponding docking accuracy using the default search space is shown on the right. Squares represent the mean values for each metric and whiskers show the standard deviation. The results obtained for experimental binding sites (black squares) are compared to those predicted by eFindSite (gray squares)
Fig. 3
Fig. 3
Correlation between default and optimized docking box sizes for the PDB-bench dataset. Each gray square corresponds to one PDB-bench ligand with the default and optimized box sizes represented by their volumes. The solid line is the diagonal and the dashed line shows the minimum volume for a default box calculated as 22.5 Å × 22.5 Å × 22.5 Å
Fig. 4
Fig. 4
Virtual screening benchmarks of Vina against the DUD-E dataset. Ranking accuracy using the default and optimized box size is evaluated by the enrichment factor for the top (a) 1 % and (b) 10 % of the ranked library, (c) Boltzmann-Enhanced Discrimination of Receiver Operating Characteristics, (d) the area under the enrichment curve, and (e) the top fraction of the ranked library that contains 50 % of actives. The results obtained for experimental pockets (black crosses) are compared to binding sites predicted by eFindSite (blue triangles). Green areas highlight those target proteins for which the optimized box size yields better results than the default protocol
Fig. 5
Fig. 5
Case study for molecular docking by Vina. Gray ribbons represent human aldose reductase with (a) the default and (b) the optimized docking boxes shown in red. Predicted binding poses for NADP (green sticks) are compared to that in the experimental complex structure (blue sticks)

References

    1. Moult J. A decade of CASP: progress, bottlenecks and prognosis in protein structure prediction. Curr Opin Struct Biol. 2005;15(3):285–9. doi: 10.1016/j.sbi.2005.05.011. - DOI - PubMed
    1. Zhang Y. I-TASSER: fully automated protein structure prediction in CASP8. Proteins. 2009;77(Suppl 9):100–13. doi: 10.1002/prot.22588. - DOI - PMC - PubMed
    1. Brylinski M, Lingam D. eThread: a highly optimized machine learning-based approach to meta-threading and the modeling of protein tertiary structures. PLoS One. 2012;7(11):e50200. doi: 10.1371/journal.pone.0050200. - DOI - PMC - PubMed
    1. Roy A, Kucukural A, Zhang Y. I-TASSER: a unified platform for automated protein structure and function prediction. Nat Protoc. 2010;5(4):725–38. doi: 10.1038/nprot.2010.5. - DOI - PMC - PubMed
    1. Brylinski M. Unleashing the power of meta-threading for evolution/structure-based function inference of proteins. Front Genet. 2013;4:118. doi: 10.3389/fgene.2013.00118. - DOI - PMC - PubMed