. 2015 Sep;21(9):2039-51.
doi: 10.1097/MIB.0000000000000453.

miRNA-26b Overexpression in Ulcerative Colitis-associated Carcinogenesis

Affiliations

miRNA-26b Overexpression in Ulcerative Colitis-associated Carcinogenesis

Natalya Benderska et al. Inflamm Bowel Dis. 2015 Sep.

Abstract

Background: Longstanding ulcerative colitis (UC) bears a high risk for development of UC-associated colorectal carcinoma (UCC). The inflammatory microenvironment influences microRNA expression, which in turn deregulates target gene expression. microRNA-26b (miR-26b) was shown to be instrumental in normal tissue growth and differentiation. Thus, we aimed to investigate the impact of miR-26b in inflammation-associated colorectal carcinogenesis.

Methods: Two different cohorts of patients were investigated. In the retrospective group, a tissue microarray with 38 samples from 17 UC/UCC patients was used for miR-26b in situ hybridization and quantitative reverse transcription polymerase chain reaction analyses. In the prospective group, we investigated miR-26b expression in 25 fresh-frozen colon biopsies and corresponding serum samples of 6 UC and 15 non-UC patients, respectively. In silico analysis, Ago2-RNA immunoprecipitation, luciferase reporter assay, quantitative reverse transcription polymerase chain reaction examination, and miR-26b mimic overexpression were employed for target validation.

Results: miR-26b expression was shown to be upregulated with disease progression in tissues and serum of UC and UCC patients. Using miR-26b and Ki-67 expression levels, an UCC was predicted with high accuracy. We identified 4 novel miR-26b targets (DIP1, MDM2, CREBBP, BRCA1). Among them, the downregulation of the E3 ubiquitin ligase DIP1 was closely related to death-associated protein kinase stabilization along the normal mucosa-UC-UCC sequence. In silico functional pathway analysis revealed that the common cellular pathways affected by miR-26b are highly related to cancerogenesis and the development of gastrointestinal diseases.

Conclusions: We suggest that miR-26b could serve as a biomarker for inflammation-associated processes in the gastrointestinal system. Because miR-26b expression is downregulated in sporadic colon cancer, it could discriminate between UCC and the sporadic cancer type.


Conflict of interest statement

The authors have no conflicts of interest to disclose.

Figures
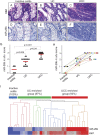
FIGURE 1
FIGURE 1
miR-26b expression in human UC and UC-associated carcinomas (UCC) determined by ISH. A, Hematoxylin and eosin (H&E) staining (top panel) and ISH (bottom panel) for miR-26b expression in inactive colitis (A, D), active UC (B, E), and UCC (C, F) at ×40 magnification. G, ISH scores (0–3) of miR-26b from 38 samples of 17 patients, as described in Materials and Methods, presented as the average scores of 2 independent observers (T.T.R. and A.A.). Samples were grouped according to their pathological stage: inactive colitis (n = 6), active UC (n = 16), and UCC (n = 16). H, Individual ISH scores (0–3) of miR-26b, as described in Materials and Methods. Data are presented as average score. Tissue samples were grouped according to their pathological disease status within a single patient. Nine patients had available samples in an “inactive colitis-UCC” sequence, 4 patients had “UC-UCC” sequence, and 1 patient had “inactive-UC” sequence. Four patients having only UCC samples were indicated as a circle. I, Graphical representation of 2-dimensional hierarchical clustering results on miR-26b ISH data and mRNA qPCR profiles of Ki-67 of inactive colitis (n = 6), active UC (n = 16), and UCC (n = 16) samples. RNA expression scores are depicted according to a color scale: red, positive expression; blue, negative expression; and gray, intermediate expression. Dendrogram of samples discriminates between the 4 groups (indicated in purple, green, blue, and orange).
FIGURE 2
FIGURE 2
miR-26b expression in human UC determined by quantitative PCR. A, Individual relative expression of miR-26b in healthy people with normal uninflamed colon mucosa (n = 15) and patients with active UC (n = 10) in biopsy specimens determined by qRT-PCR. Analyses were performed in triplicates, and the results were normalized using the U6 expression level; P < 0.0001 (unpaired 2-tailed t test). B, Individual relative expression of miR-26b determined by qRT-PCR in healthy people (n = 10) and patients with active UC (n = 6) in blood serum. In 5 healthy samples, miR-26b/U6 was not amplifiable. Analyses were performed in triplicates, and the results were normalized using the U6 expression level, P < 0.0001 (unpaired 2-tailed t test).
FIGURE 3
FIGURE 3
Expression of miR-26b in AOM/DSS-induced murine model of CRC. A, Upper panel: scheme of 4-stage protocol inducing chronic inflammation and colitis-driven tumors in mice. Lower panel: endoscopic images display the development of tumors in the murine colon after AOM/DSS treatment. B, Individual relative expression of miR-26b in murine serum of control (day 1, n = 15) and AOM + DSS–treated mice (day 67, n = 5) measured by qRT-PCR. Analyses were performed in triplicates, and the results were normalized using the U6 expression level. P = 0.0001 compared with untreated samples (Mann–Whitney U test).
FIGURE 4
FIGURE 4
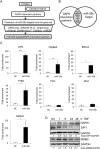
MiR-26b targets associated with DAPK. A, Schematic representation of the strategy used to reveal DAPK-interacting proteins connected through miR-26b. B, Venn diagram illustrating candidates overlapping between miR-26b–specific targets and DAPK-interacting partners. C, Relative enrichment of miR-26b targets identified by Ago2-RIP in HCT116 cells. Expression signals of Ago2-bound RNA were normalized to the IgG-bound RNA from the same cell population, and enrichments of miR-26b–transfected versus scrambled miR–transfected cells (negative control [NC]) were calculated using ΔCt method. Ago2-RIP was repeated twice and qRT-PCR performed 3 times in triplicates. Results are expressed as mean ± SD. *P < 0.05; **P < 0.01; ***P < 0.001 compared with scrambled transfection (unpaired 2-tailed t test). D, Western blot analysis of HCT116 cells treated with TNF (0.66 ng/mL). At the indicated time points, whole-cell lysates were prepared and equal amounts of proteins were resolved by sodium dodecyl sulfate polyacrylamide gel electrophoresis and probed with specific indicated antibodies. Anti-GAPDH antibody was used as a loading control. Experiments were repeated 3 times, and representative images are shown.
FIGURE 5
FIGURE 5
MiR-26b targets DIP1 in vitro and in vivo. A, miR-26b sequences in the 3′-UTR of human DIP1 mRNA as predicted by TargetScan (v.5.1). The miR-26b seed sequence and its predicted binding site in the DIP1 3′-UTR are shown underlined. B, HCT116 cells were cotransfected with the vectors containing the full-length 3′-UTR, mutated 3′-UTR, or an empty pmirGLO vector (250 ng/mL) and an miR-26b mimic (20 nM) or miR scramble (20 nM). Firefly luciferase activity was measured 24 hours later and normalized to Renilla luciferase activity. The experiment was done 3 times in triplicates. Results are expressed as mean ± SD. *P < 0.05 (unpaired 2-tailed t test). C, HCT116 cells were transfected with 20 nM miRNA mimics for 6 hours and then treated with TNF (0.66 ng/mL) for indicated time points. The protein expression was assayed by Western blot using indicated antibodies. Anti-GAPDH antibody was used as a loading control. Band densities were quantified using ImageJ. Experiments were repeated 3 times, and representative images are shown. D, Relative expression of DIP1 mRNA was determined by qRT-PCR from biopsy specimens of healthy cohort (n = 10) and patients with active UC (n = 10). In 5 healthy samples, DIP1 mRNA was not amplifiable. Results were normalized using GAPDH expression level and performed at least 3 times in triplicates.
FIGURE 6
FIGURE 6
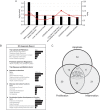
IPA-assisted network analysis of miR-26b target genes/DAPK interaction partners. A, IPA toxicology report. B, IPA: canonical pathways, diseases, and biofunctions. C, Comparative pathway analysis: overlay of potential target genes involved in apoptosis, proliferation, and inflammation.

Comment in

References

    1. Ferlay J, Steliarova-Foucher E, Lortet-Tieulent J, et al. Cancer incidence and mortality patterns in Europe: estimates for 40 countries in 2012. Eur J Cancer. 2013;49:1374–1403. - PubMed
    1. Bernstein CN, Blanchard JF, Kliewer E, et al. Cancer risk in patients with inflammatory bowel disease: a population-based study. Cancer. 2001;91:854–862. - PubMed
    1. Habermann J, Lenander C, Roblick UJ, et al. Ulcerative colitis and colorectal carcinoma: DNA-profile, laminin-5 gamma2 chain and cyclin A expression as early markers for risk assessment. Scand J Gastroenterol. 2001;36:751–758. - PubMed
    1. Terzic J, Grivennikov S, Karin E, et al. Inflammation and colon cancer. Gastroenterology. 2010;138:2101–2114.e2105. - PubMed
    1. Bartel DP. MicroRNAs: genomics, biogenesis, mechanism, and function. Cell. 2004;116:281–297. - PubMed

Publication types

MeSH terms