. 2015 Jun 25;522(7557):450-454.
doi: 10.1038/nature14471. Epub 2015 Jun 15.

Atomic structure of the APC/C and its mechanism of protein ubiquitination

Affiliations

Atomic structure of the APC/C and its mechanism of protein ubiquitination

Leifu Chang et al. Nature. .

Abstract

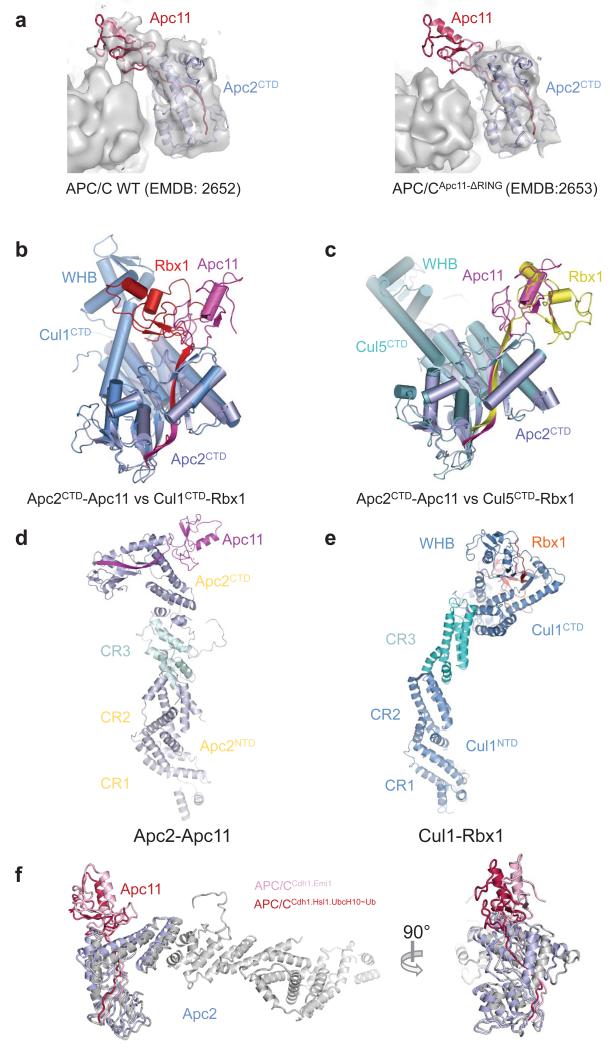
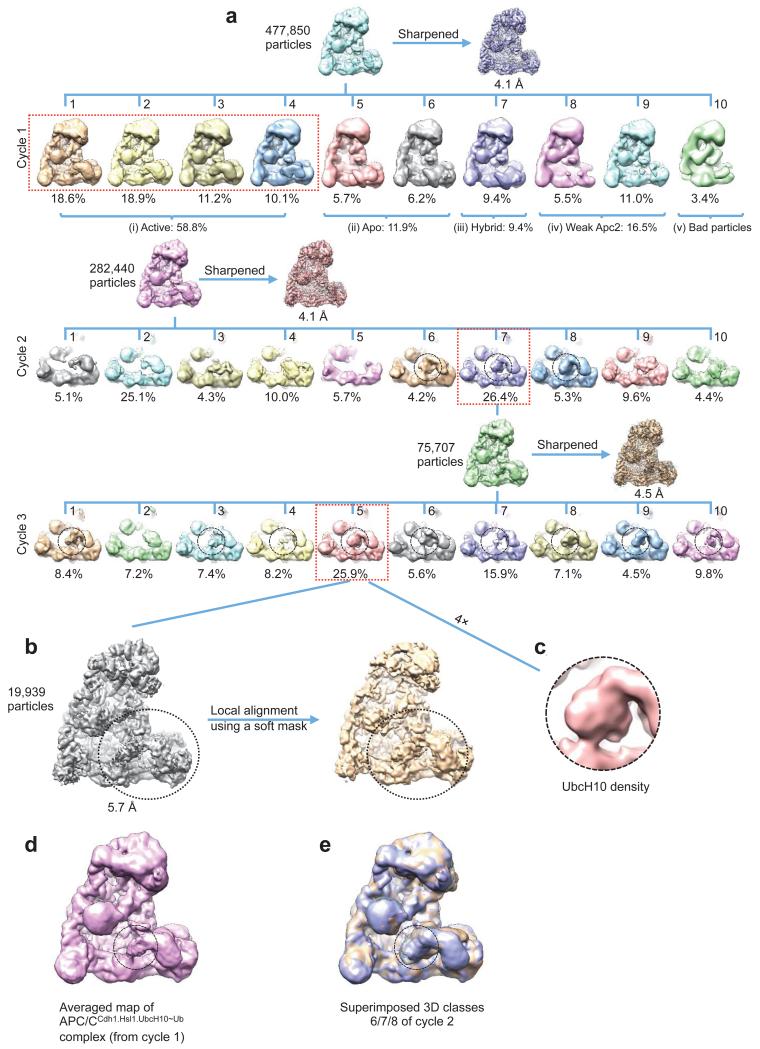
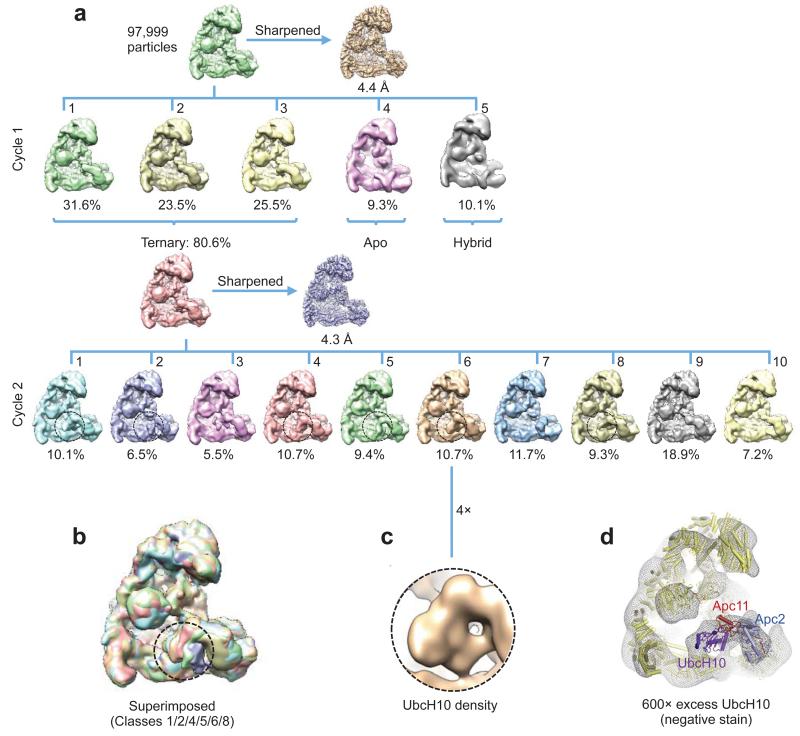
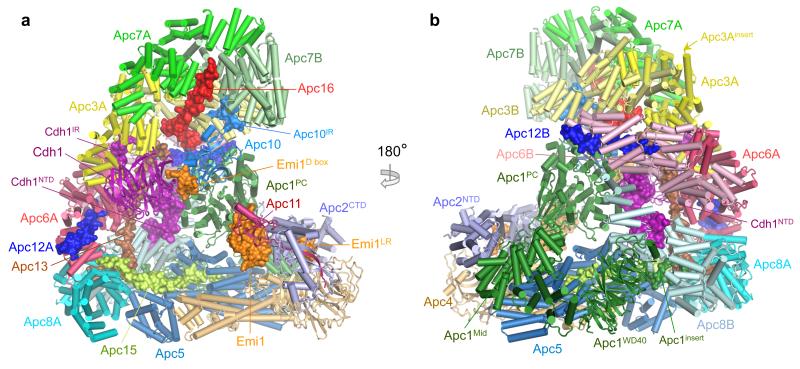
The anaphase-promoting complex (APC/C) is a multimeric RING E3 ubiquitin ligase that controls chromosome segregation and mitotic exit. Its regulation by coactivator subunits, phosphorylation, the mitotic checkpoint complex and interphase early mitotic inhibitor 1 (Emi1) ensures the correct order and timing of distinct cell-cycle transitions. Here we use cryo-electron microscopy to determine atomic structures of APC/C-coactivator complexes with either Emi1 or a UbcH10-ubiquitin conjugate. These structures define the architecture of all APC/C subunits, the position of the catalytic module and explain how Emi1 mediates inhibition of the two E2s UbcH10 and Ube2S. Definition of Cdh1 interactions with the APC/C indicates how they are antagonized by Cdh1 phosphorylation. The structure of the APC/C with UbcH10-ubiquitin reveals insights into the initiating ubiquitination reaction. Our results provide a quantitative framework for the design of future experiments to investigate APC/C functions in vivo.


Figures

Extended Data Figure 1
Extended Data Figure 1. Preparations and EM images of APC/C complexes
(a) Coomassie blue stained SDS gel of APC/CCdh1.Emi1. (b) Coomassie blue stained SDS gel of APC/CCdh1.Hsl1.Apc11-UbcH10. (c) Coomassie blue stained SDS gel and Western blot analysis (anti-His antibody - only ubiquitin in the complex contains His tag) of APC/CCdh1.Hsl1.UbcH10-Ub without or with cross-linking by glutaraldehyde (GA). (d) A typical cryo-EM micrograph of APC/CCdh1.Emi1. Representative of 3328 micrographs. (e) Gallery of 2D averages of APC/CCdh1.Emi1 showing different views. Representative of 100 2D averages. (f) Local resolution map of APC/CCdh1.Emi1 showing resolution range. (g) Details of EM density for segments of α-helix and β-strand of Apc1 and the C box of Cdh1.
Extended Data Figure 2
Extended Data Figure 2. Resolution estimation and example of de novo model building
(a) Gold standard Fourier Shell Correlation (FSC) curve and FSC curve between cryo-EM map and final atomic model of the APC/CCdh1.Emi1. (b) Cross-validation of model refinement by half maps. Shown are FSC curves between the atomic model and the half map (maphalf1) it was refined against and FSC curve between the atomic model and the other half map (maphalf2) that was not used during refinement. (c) Gold standard FSC curve of APC/CCdh1.Hsl1.UbcH10-Ub. (d) Gold standard FSC curves of human APC/CCdh1.Hsl1.Apc11-UbcH10. (e) de novo model building of Apc15 N-terminal loop. The surrounding Apc5 residues are also shown. (f) EM density for the LR tail common to Emi1 and Ube2S is only observed in APC/C complexes with subunits incorporating the LR tail. (i) APC/CCdh1.Emi1. (ii) An APC/C complex with an LR tail-bearing subunit (UbcH10LR of APC/CCdh1.Hsl1.UbcH10-Ub). (iii) No LR tail density in APC/CCdh1.Hsl1.Apc11-UbcH10 fusion and (iv) APC/CCdh1.Hsl1 (Ref. ).
Extended Data Figure 3
Extended Data Figure 3. Apc1 structure and the TPR lobe interacts with multiple subunits
(a) Cartoon of Apc1 colour-ramped from blue to red for N- to C-terminus. Insertions that interact with Apc2, Apc8 and Apc10 are labelled. Apc1Mid adopts a novel architecture. (b) TPR lobe with TPR subunits shown as surface representations, with the small TPR-accessory subunits (Apc12, Apc13, Apc15 and Apc16), a segment of Apc5, an insert of Apc1, IR tails of Cdh1 and Apc10, and Cdh1 C box that interact with the TPR lobe are shown as cartoons. The N-termini of Apc12, Apc13 and Apc15 are buried. The eight structurally homologous and symmetry-equivalent sites on the TPR lobe that bind Apc13, Apc16 and Apc5 are indicated and shown in detail in (c). View is similar to Fig 1a. (c) The eight TPR subunits interact with Apc13, Apc16 and Apc5 mainly through contacts to four conserved aromatic residues present on most TPR subunits (Y308, Y309, W302, Y322 of Apc6 [panels 5 and 6]). (d) Sequence of the ordered region of Cdh1NTD bound to Apc1 and Apc8 (ordered regions shown as lines and α-helices). Critical Apc1 and Apc8 contact residues are indicated with green and blue arrows. Phosphorylation sites indicated with red arrows.
Extended Data Figure 4
Extended Data Figure 4. APC/C ubiquitination assays
(a) Mutation of Arg493 of the IR tail reduces APC/CCdh1 activity. (b) Mutations at the RING domain interface of UbcH10 and UbcH10LR disrupt ubiquitination activity. (c) Ubiquitination assay shows that both UbcH10(C114K) and UbcH10LR(C114K) compete with wild type UbcH10. UbcH10LR(C114K) is a more potent inhibitor. (d) The APC/C-UbcH10-mediated substrate ubiquitination activities of UbcH10 and UbcH10LR are indistinguishable. (e) The ubiquitin (I36A) and ubiquitin (I44A) mutants were defective for APC/C-UbcH10-mediated substrate ubiquitination. (f) UbcH10 charging by the ubiquitin (I36A) and ubiquitin (I44A) mutants was unchanged relative to wild type ubiquitin.
Extended Data Figure 5
Extended Data Figure 5. The position of Apc11RING in the APC/C is more similar to Rbx1RING of activated cullin-Rbx1 structures
(a) Identification of Apc11 in apo APC/C. Left panel: EM density map for apo APC/C with the coordinates of Apc2CTD-Apc11 fitted (from APC/CCdh1.Emi1 structure). Right panel. EM density for APC/CApc11-ΔRING. The difference density corresponds to Apc11RING. EM density maps from . (b) Superimposed Apc2CTD onto Cul1CTD (PDB: 1LDK) . (c) Superimposed Apc2CTD onto Cul5CTD (PDB: 3DQV) . In the inactive conformation of Cul1-Rbx1, Rbx1RING packs against WHB. In APC/CCdh1.Emi1 the location of Apc11RING remains in contact with Apc2CTD but has rotated ~180° relative to inactive CRL structures being similar to the swung out conformation of Rbx1RING of neddylated and activated Cul5-Rbx1 . (d and e) The relative orientation of Apc2NTD and Apc2CTD is also dramatically different from Cul1 (Ref. ). This is due to a 70° rotation within cullin repeat 3 (between helices A-B and C-D-E), and a ~20° rotation around the 4HB - cullin repeat 3 interface. Similar less pronounced structural variations are observed within the CRL family. (d) Apc2-Apc11 (this study). (e) Cul1-Rbx1 (PDB: 1LDK) . (f) The position of the Apc2CTD-Apc11 module differs slightly about the Apc2NTD-Apc2CTD interface between APC/CCdh1.Emi1 and APC/CCdh1.Hsl1.UbcH10-Ub.
Extended Data Figure 6
Extended Data Figure 6. Three dimensional classification of APC/CCdh1.Hsl1.UbcH10-Ub
(a) The 3D classification (Cycle 1) started with 477,850 motion corrected particles, which were divided into ten classes. The resultant classes were grouped into five categories: (i) 58.8% in the active ternary state with coactivator and substrate (Hsl1); (ii) 11.9% in the apo inactive state; (iii) 9.4% in a class with Cdh1 bound but with the catalytic module in the apo inactive conformation (hybrid state); (iv) 16.5% with weak Apc2 density and (v) 3.4% were a poor reconstruction due to bad particles. Examination of the hybrid state (iii) showed that density for Apc1WD40 was absent, explaining the lack of Cdh1-induced conformational change of the catalytic module. Particles in the ternary state (reconstructed to an overall resolution of 4.1 Å) were subjected to further 3D classification (Cycle 2). A major class (class 7, 26.4% of particles) showed improved density for UbcH10 (circled) and Cycle 3 classification was performed on particles in this class. The major class of Cycle 3 (class 5, 25.9% particles) showed further improved UbcH10 density. Further 3D classification of this class did not improve the UbcH10 density. (b) Particles in the best class (Cycle 3, class 5, 19,939 particles) were refined in RELION and resulted in a map at 5.7 Å resolution (Extended Data Fig. 2c). The UbcH10 density was improved by local alignment using a soft mask (indicated by circles) as described in Methods. (c) Enlarged view of UbcH10 density. (d) Enlarged view of the averaged APC/CCdh1.Hsl1.UbcH10-Ub reconstruction from cycle 1 of the 3D classification (59% of particles). UbcH10 density is circled. (e) Superimposition of classes 6, 7 and 8 of cycle 2 of the 3D classification (from (a)), showing the structural variability of the three 3D classes that indicate UbcH10 density. UbcH10 density is circled.
Extended Data Figure 7
Extended Data Figure 7. Three dimensional classification of APC/CCdh1.Hsl1.Apc11-UbcH10
(a) The 3D classification started with 97,999 motion corrected particles, which were divided into five classes. The resultant classes were grouped into three categories: (i) 80.6% in the active ternary state with coactivator and substrate (Hsl1); (ii) 9.3% in the apo state and (iii) 10.1% in a hybrid state. Particles in the active ternary state (reconstructed to an overall resolution of 4.3 Å) were subjected to Cycle 2 classification with ten classes. UbcH10 density in the resultant classes is indicated with circles. (b) Classes with UbcH10 density in Cycle 2 classification are superimposed, showing variability of UbcH10. (c) Enlarged view of UbcH10 density. (d) A negative stain EM reconstruction of an APC/CCdh1.Hsl1 complex at ~25 Å resolution with a 1500-fold excess of UbcH10. The molecular surface is shown as a mesh representation and the coordinates of the APC/CCdh1.Hsl1.UbcH10-Ub were docked into the EM reconstruction. The UbcH10 coordinates fit new EM density proximal to Apc11.
Figure 1
Figure 1. EM reconstructions of the APC/CCdh1.Emi1 complex
(a,b) Two views of the atomic structure of APC/CCdh1.Emi1. Large subunits are shown in cartoon, whereas the four small subunits, Emi1, Cdh1NTD, Cdh1IR and Apc10IR are shown as surface representations. Emi1 interacts with the substrate-recognition and catalytic modules.
Figure 2
Figure 2. The C box of Cdh1 and IR tails of Cdh1 and Apc10 interact with structurally related sites on Apc8 and Apc3
(a) Cdh1NTD binds to Apc8 and Apc1. Segments 1 and 3 of Cdh1NTD including the C box interact with Apc8, whereas segments 2 and 4 interact with Apc1PC. Segments 1-4 are labelled as S1-4. Phosphorylation sites S40, S151 and S163 as red spheres. (b) Details of the C box-interactions. The R47 and I49 interaction sites are structurally related to the IR tail-binding sites for Cdh1 and Apc10 in Apc3 shown in (c, d). S. cerevisiae CDC23 (Apc8) temperature-sensitive mutations map to the C box-binding site (Cα of mutant residues shown as spheres in (b)). (e) Mutation of C box-residues Arg47 and Arg52 eliminates APC/CCdh1 activity, as do mutation of Apc8 residues that interact with either Arg47 or Arg52. (f) At the Cdh1NTD – Apc1PC interface multiple residues cooperate to mediate APC/C – Cdh1 interactions. (g) S40, S151 and S163 mediate the negative regulation of Cdh1 by CDK phosphorylation.
Figure 3
Figure 3. Interactions of Emi1 with Apc2CTD-Apc11RING and D box receptor of Cdh1 and Apc10
(a) and (b) views of the EM density and underlying secondary structure. Emi1 elements are shown: D box (Emi1D-box); Emi1Linker and Emi1ZBR interconnects Apc1PC with Apc2CTD and Apc11RING. Both Emi1Linker and Emi1ZBR block the UbcH10-binding site on Apc11, but not the Ube2S-specific site . The C-terminal LRRL tail (Emi1LR) of Emi1 binds to Apc2CTD.
Figure 4
Figure 4. Structure of the APC/CCdh1.Hsl1.UbcH10-Ub complex reveals the location of UbcH10
(a) and (b) views of the EM density at the catalytic centre with UbcH10-ubiquitin. No density for the ubiquitin moiety was recovered. R27 and R77 of Apc11, required for UbcH10 interactions are indicated. (c) The UbcH10- and Emi1-binding sites of Apc11RING overlap. The Apc11RING orientation differs slightly in the two complexes.
Figure 5
Figure 5. The relative position of the catalytic and substrate-recognition modules defines the target lysine
(a) View of APC/CCdh1.Hsl1.UbcH10-Ub with close-up view of the catalytic and substrate-recognition modules. A UbcH10-ubiquitin conjugate is modelled in the closed conformation . The Ube2S-specific site of Apc11RING (for distal Ub positioning) is indicated. KEN box and ABBA motif modelled on . The distance from the D and KEN boxes to the catalytic centre of UbcH10 (measured as Cα-CO distance: P10 of D box and ‘N’ of KEN box to Gly76 of ubiquitin) is indicated. A ten-residue linker is modelled connected to P10 of the D box with Lys at K10. Spheres denote Cα-atoms of D box-P10 and linker-K10. (b) The reactivity of defined peptides with progressively longer spacers separating the D box and accepter lysine residue (sequences shown in (c)). Only peptides with a lysine ten or more residues C-terminal to the D box are substrates. *: Ube2S-specific band. (c) Peptide sequences used in ubiquitination assays. D box in yellow, target lysines in blue.

References

    1. Meyer HJ, Rape M. Processive ubiquitin chain formation by the anaphase-promoting complex. Seminars in cell & developmental biology. 2011;22:544–550. - PMC - PubMed
    1. Pines J. Cubism and the cell cycle: the many faces of the APC/C. Nat Rev Mol Cell Biol. 2011;12:427–438. - PubMed
    1. Primorac I, Musacchio A. Panta rhei: the APC/C at steady state. The Journal of cell biology. 2013;201:177–189. - PMC - PubMed
    1. Chang L, Zhang Z, Yang J, McLaughlin SH, Barford D. Molecular architecture and mechanism of the anaphase-promoting complex. Nature. 2014;513:388–393. - PMC - PubMed
    1. Kimata Y, Baxter JE, Fry AM, Yamano H. A role for the Fizzy/Cdc20 family of proteins in activation of the APC/C distinct from substrate recruitment. Molecular cell. 2008;32:576–583. - PubMed

Publication types

MeSH terms

Substances

Associated data