. 2015 Jun 25;522(7557):439-43.
doi: 10.1038/nature14561. Epub 2015 Jun 17.

Competitive binding of antagonistic peptides fine-tunes stomatal patterning

Affiliations

Competitive binding of antagonistic peptides fine-tunes stomatal patterning

Jin Suk Lee et al. Nature. .

Abstract

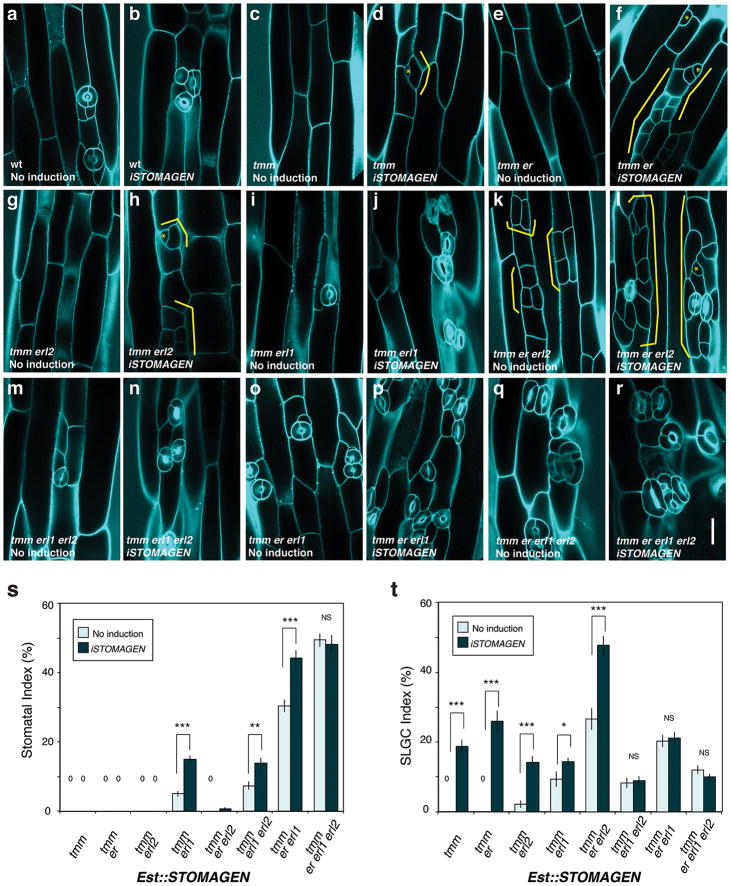
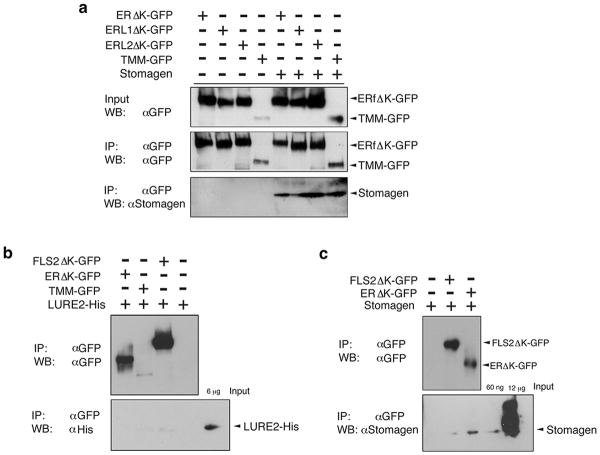
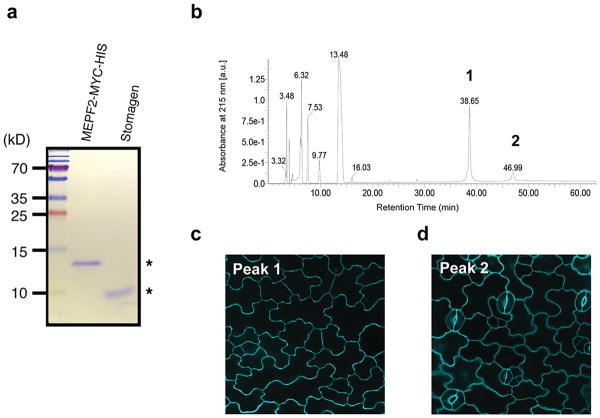
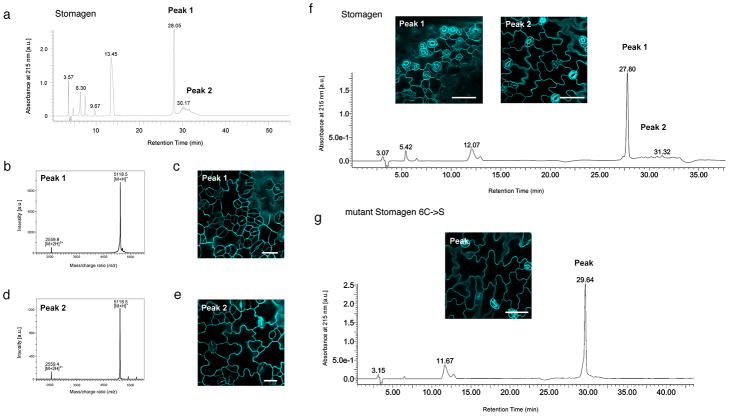
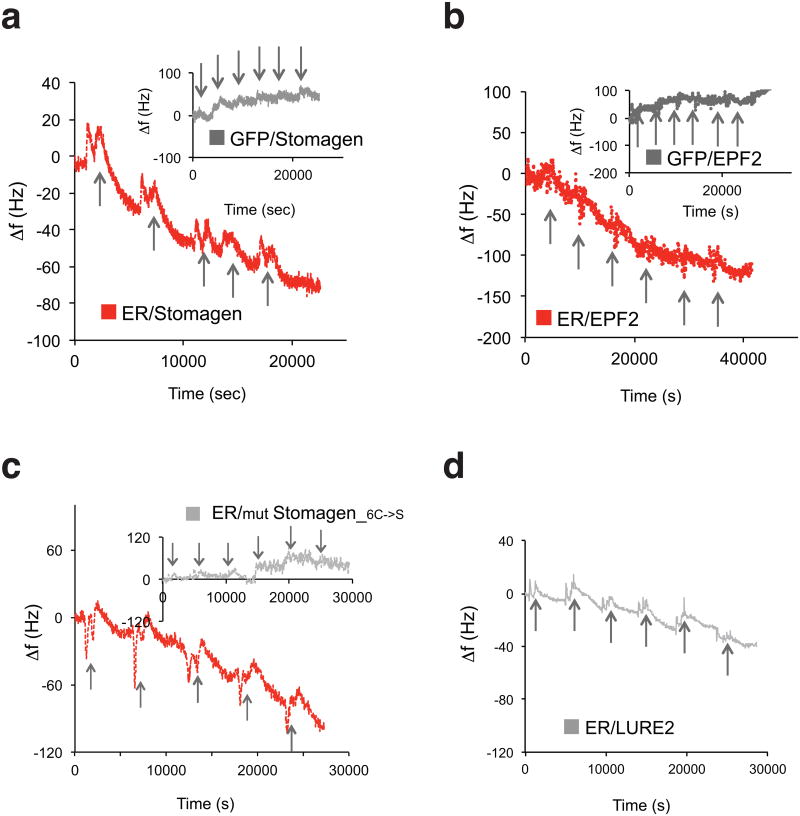
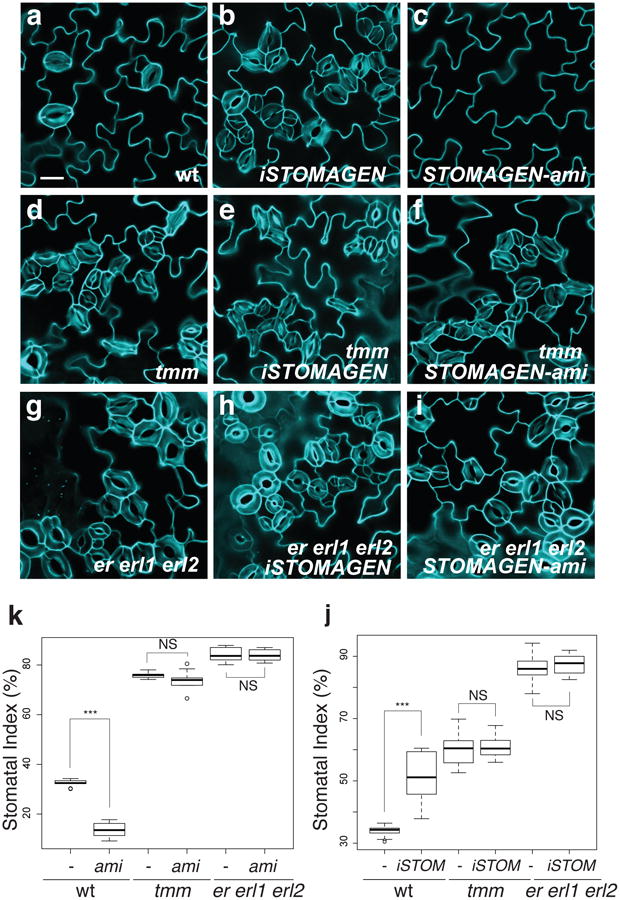
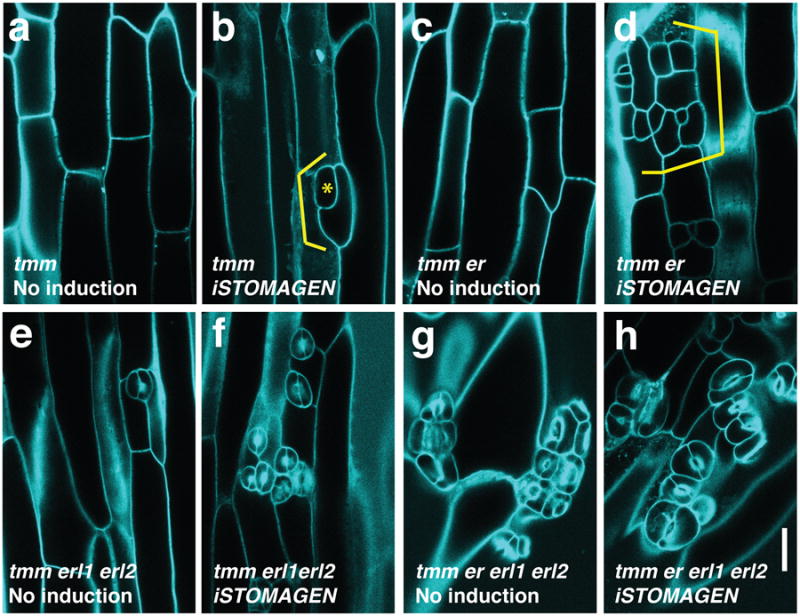
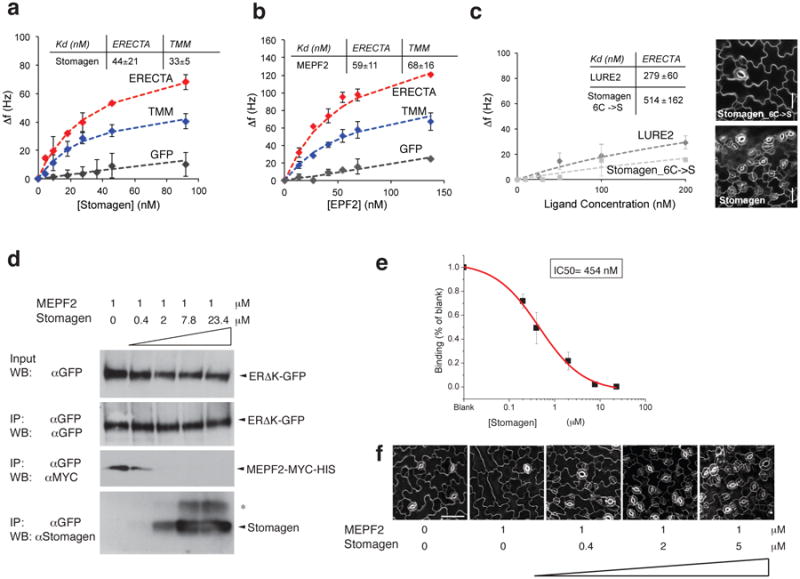
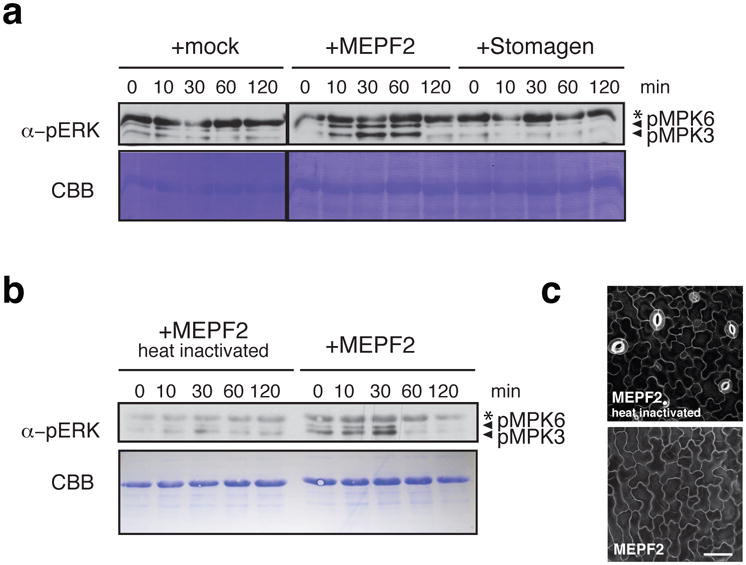
During development, cells interpret complex and often conflicting signals to make optimal decisions. Plant stomata, the cellular interface between a plant and the atmosphere, develop according to positional cues, which include a family of secreted peptides called epidermal patterning factors (EPFs). How these signalling peptides orchestrate pattern formation at a molecular level remains unclear. Here we report in Arabidopsis that Stomagen (also called EPF-LIKE9) peptide, which promotes stomatal development, requires ERECTA (ER)-family receptor kinases and interferes with the inhibition of stomatal development by the EPIDERMAL PATTERNING FACTOR 2 (EPF2)-ER module. Both EPF2 and Stomagen directly bind to ER and its co-receptor TOO MANY MOUTHS. Stomagen peptide competitively replaced EPF2 binding to ER. Furthermore, application of EPF2, but not Stomagen, elicited rapid phosphorylation of downstream signalling components in vivo. Our findings demonstrate how a plant receptor agonist and antagonist define inhibitory and inductive cues to fine-tune tissue patterning on the plant epidermis.


Figures

Extended Data Fig. 1
Extended Data Fig. 1. Stomatal clustering phenotype of induced STOMAGEN overexpression in multiple independent transgenic lines
Shown are confocal microscopy images of abaxial cotyledon epidermis from 10-day-old light-grown seedlings of four independent transgenic lines carrying an estradiol-inducible STOMAGEN overexpression constructs (iSTOMAGEN). Left panels, no induction (control); Right panels, estradiol induction; Each row shows representative images from individual lines. Brackets, stomatal clusters. Images are taken under the same magnification. Scale bar, 40 μm. n=3 for each panel.
Extended Data Fig. 2
Extended Data Fig. 2. RT-PCR analysis of STOMAGEN transcripts in transgenic lines used in this study
(a) Expression of estradiol-inducible STOMAGEN transgene (iSTOMAGEN) in transgenic lines expressing estradiol-inducible STOMAGEN overexpression (Est∷STOMAGEN) lines from wild-type (wt), tmm, and er erl1 erl2 triple mutant background with or without estradiol induction. (b) Expression of the endogenous STOMAGEN transcripts in each genotype carrying STOMAGEN-ami construct. tmm or er erl1 erl2 mutation does not seem to affect STOMAGEN transcript levels. (c) Expression of EPF1, EPF2, total STOMAGEN, and STOMAGEN transgene (iSTOMAGEN) transcripts in transgenic Est∷STOMAGEN lines (in 2 different T1 populations [s1 and s2] and a representative T3 line [s3]) with or without estradiol induction. iSTOMAGEN-OX causes modest increase in EPF1 and EPF2 transcripts, which accords with increased stomatal differentiation by iSTOMAGEN. (d) EPF1, EPF2, and STOMAGEN transcript accumulation in wild-type (wt) and single- and higher-order loss-of-function mutants of epf1, epf2, and stomagen (STOMAGEN-ami). For epf1 STOMAGEN-ami and epf2 STOMAGEN-ami lines, two different F3 populations derived from the same genetic crosses were used to test the reproducibility. STOMAGEN expression is not influenced by epf1 and epf2 mutations, consistent with the proto-mesophyll expression of STOMAGEN. On the other hand, EPF2 expression is reduced by STOMAGEN-ami, consistent with reduced stomatal cell lineages by STOMAGEN cosuppression. As reported, epf1 has a T-DNA insertion within the 5′UTR, which results in accumulation of aberrant transcripts. For all experiments, elF4A was used as a control. For primer sequences see Extended Data Table 1.
Extended Data Fig. 3
Extended Data Fig. 3. STOMAGEN overexpression promotes stomatal differentiation in genetic backgrounds missing/blocking EPF2-ER and EPF1-ERL1 signaling components
(a-j) Representative confocal images of cotyledon abaxial epidermis from 10-day-old light-grown transgenic seedlings of the following genotypes, each carrying Est∷STOMAGEN construct: epf2 (a, b); Dominant-negative ER (ERΔK) in er (c, d); epf1 (e, f); Dominant-negative ERL1 (ERLΔK) in erl1 (g, h); er erl1 erl2 (i, j). For each genotype, a control uninduced phenotypes (a, c, e, g, i) and induced STOMAGEN overexpression (iSTOMAGEN) (b, d, f, h, j) are shown. Blocking ER or lacking EPF2 produces small stomatal-lineage cells due to excessive entry divisions (a and c; brackets). iSTOMAGEN confers stomatal clusters and small stomatal-lineage cells are no longer present (b and d). Blocking ERL1 or lacking EPF1 causes a stomatal pairing due to a violation of one-cell-spacing rule (e and g; dots). iSTOMAGEN enhances stomatal cluster phenotype in these genotypes (f and h). iSTOMAGEN does not enhance stomatal clustering defects in er erl1 erl2 (i and j). Images were taken under the same magnification. Scale bars = 30 μm. n=29 (a); n=24 (b); n=16 (c); n=17 (d); n=22 (e); n=23 (f); n=17 (g); n=20 (h); n=24 (i); n=24 (j). (k-m) Stomatal Density (SD: number of stomata per mm2) (k); Stomatal Index (SI: % of number of stomata per stomata+ non-stomatal epidermal cells) (l); and Stomatal Cluster Distribution (in %)(m) from 10-day-old abaxial cotyledons of transgenic lines of each genotype carrying Est∷STOMAGEN construct. -, no induction; +, induced by 10 μM estradiol. Stomagen overexpression significantly increases SD in all genotypes except for er erl1 erl2 and tmm. Error bars, S.E.M. ***, p< 0.001; **, p<0.01; NS, not significant; Welch 2-sample T test. Number of seedlings subjected to analysis, n=14-16. Total numbers of stomata counted: wt, no induction, 1277, induction, 2639; epf1 no induction, 1390, induction 3485; ERL1ΔK erl1, no induction 1573, induction, 3991; epf2, no induction, 2502, induction, 3317; ERΔKer, no induction, 2899, induction, 4397; tmm, no induction, 2948, induction, 3212; er erl1 erl2, no induction, 4454, induction, 4464. All genotypes carry Est∷STOMAGEN. wt, no induction, n=16, induction, n=14; epf1 no induction, n=16, induction n=17; ERL1ΔK erl1, no induction n=15, induction, n=15; epf2, no induction, n=15, induction, n=15; ERΔK er, no induction, n=15, induction, n=15; tmm, no induction, n=15, induction, n=15; er erl1 erl2, no induction, n=15, induction, n=15.
Extended Data Fig. 4
Extended Data Fig. 4. STOMAGEN co-suppression results in reduced stomatal development in genetic backgrounds missing or blocked in EPF2-ER and EPF1-ERL1 signaling pathways
(a-j) Representative confocal images of cotyledon abaxial epidermis from 10-day-old light-grown transgenic seedlings of the following genotypes, wild type (a); STOMAGEN-ami (b); epf2 (c); epf2 STOMAGEN-ami (d); Dominant-negative ER (ERΔK) in er (e); ERΔK er STOMAGEN-ami (f); epf1 (g); epf1 STOMAGEN-ami (h); Dominant-negative ERL1 (ERLΔK) in erl1 (i); ERLΔK erl1 STOMAGEN-ami (j). STOMAGEN-ami dramatically reduces stomatal differentiation in wild type (a, b). Blocking ER or lacking EPF2 produces small stomatal-lineage cells due to excessive entry divisions (c and e; yellow brackets). STOMAGEN-ami rather exaggerates the small stomatal-lineage cells of epf2 (d; yellow brackets). STOMAGEN-ami ERΔK er shows excessive asymmetric entry as well as amplifying divisions (f; yellow and pink brackets, respectively). Blocking ERL1 or lacking EPF1 causes a stomatal pairing due to a violation of one-cell-spacing rule (g and i; dots). STOMAGEN-ami suppresses these mild stomatal pairing phenotypes and reduces stomatal differentiation (h, j). Images were taken under the same magnification. Scale bars = 30 μm. n=13 (a); n=26 (b); n=15 (c); n=23 (d); n=11 (e); n=17 (f); n=12 (g); n=22 (h); n=18 (i); n=13 (j).(k-n) Stomatal Density (k) Stomatal Index (l), Stomatal Cluster Distribution (in %: m), and non-stomatal epidermal cell density (n) from 10-day-old abaxial cotyledons of each genotype with or without carrying STOMAGEN-ami construct. Error bars, S.E.M. ***, p< 0.001; *, p≤0.05, NS, not significant; Welch 2-sample T test. n=9-16. Total numbers of stomata counted: wt, 719; STOMAGEN-ami, 204; epf1, 1004, epf1 STOMAGEN-ami, 383; ERL1ΔK erl1, 1558; ERL1ΔK erl1 STOMAGEN-ami, 504; epf2, 1505; epf2 STOMAGEN-ami, 1165; ERΔK er, 1361; ERΔK er STOMAGEN-ami, 782; tmm, 2495; tmm STOMAGEN-ami, 2688; er erl1 erl2, 1853; er erl1 erl2 STOMAGEN-ami, 2028. Total numbers of non-stomatal epidermal cells counted: wt, 1494; STOMAGEN-ami, 1299; epf1, 1584, epf1 STOMAGEN-ami, 2711; ERL1ΔK erl1, 871; ERL1ΔK erl1 STOMAGEN-ami, 1348; epf2, 3980; epf2 STOMAGEN-ami, 8808; ERΔK er, 5739; ERΔK er STOMAGEN-ami, 6939; tmm, 790; tmm STOMAGEN-ami, 962; er erl1 erl2, 479; er erl1 erl2 STOMAGEN-ami, 391. wt, n=8; STOMAGEN-ami, n=8; epf1, n=9, epf1 STOMAGEN-ami, n=17; ERL1ΔK erl1, n=13; ERL1ΔK erl1 STOMAGEN-ami, n=9; epf2, n=11; epf2 STOMAGEN-ami, n=15; ERΔK er, n=9; ERΔK er STOMAGEN-ami, n=11; tmm, n=8; tmm STOMAGEN-ami, n=8; er erl1 erl2, n=8; er erl1 erl2 STOMAGEN-ami, n=8.
Extended Data Fig. 5
Extended Data Fig. 5. STOMAGEN overexpression on stomatal development in tmm hypocotyl epidermis with combinatorial loss-of-function in ER-family genes: A complete set
(a-r) Representative confocal microscopy images of hypocotyl epidermis from 10-day-old light-grown transgenic seedlings of the following genotypes, each carrying Est∷STOMAGEN: wild-type (wt) (a, b); tmm (c, d); tmm er (e, f); tmm erl2 (g, h); tmm erl1 (i, j); tmm er erl2 (k, l); tmm erl1 erl2 (m, n); tmm er erl1 (o, p); and tmm er erl1 erl2 (q, r). A control, uninduced phenotype (a, c, e, g, i, k, m, o, q); iSTOMAGEN (b, d, f, h, j, l, n, p, r). iSTOMAGEN results in arrested stomatal precursor cells (asterisk) and stomatal-lineage ground cells (SLGCs: bracket) in tmm hypocotyls (d). iSTOMAGEN triggers entry divisions in tmm er and tmm erl2 (f, h: bracket), and exaggerate the SLGC clusters in tmm er erl2 (k and l: brackets). Images were taken under the same magnification. Scale bar = 30 μm. n=19 (a); n=19 (b); n=20 (c); n=20 (d); n=19 (e); n=22 (f); n=20 (g); n=17 (h); n=18 (i); n=19 (j); n=19 (k), n=21 (l); n=17 (m); n=20 (n); n=19 (o); n=21 (p); n=20 (q); n=20 (r). (s, t) Stomatal Index (SI) and SLGC Index (SLGCI). (s). *** p<0.0001, ** p<0.01, * p<0.5 (Wilcoxon rank sum test). NS=Not significant. 0=No stomata or SLGC observed; n=15. Total number of stomata and SLGCs counted; tmm non-induced, 0 and 0; induced, 0 and 211; tmm er non-induced, 0 and 0; induced, 0 and 308; tmm erl2 non-induced, 0 and 32; induced, 0 and 171; tmm erl1 non-induced, 58 and 116; induced, 142 and 138;tmm er erl2 non-induced, 0 and 270; induced, 10 and 676; tmm er erl1 non-induced, 422 and 283; induced, 817 and 422; tmm erl1 erl2 non-induced, 72 and 83; induced, 163 and 97; tmm er erl1 erl2 non-induced, 1229 and 295; induced, 1068 and 222. n=15 for all genotypes (s, t).
Extended Data Fig. 6
Extended Data Fig. 6. Association of Stomagen with ER-family receptors and TMM
Shown are Co-IP assays of ligand-receptor pairs expressed in N. benthamiana leaves. The ectodomains and membrane-spanning domains of ER, ERL1, and ERL2 fused with GFP were separately expressed in N. benthamiana, and microsomal fractions were incubated with 1 μM Stomagen peptides followed by immunoprecipitation using anti-GFP (αGFP) antibody. Inputs and immunoprecipitates were immunoblotted using anti-GFP (αGFP) or anti-Stomagen (αStomagen) antibodies. Experiments were repeated three times (3 biological replicates). (b) Co-IP of LURE2 peptide fused with hexa-histidine tag (LURE2-His) with N. benthamiana microsomal fractions expressing the ectodomains and membrane-spanning domains of ER and FLS2 fused with GFP, a full-length TMM fused with GFP, or a control, uninoculated leaf sample. Immunopreciptation was performed using αGFP and immunoblotted using αGFP (for detection of receptors) or αHis (for detection of LURE2-His) antibodies. Experiments were repeated twice (two biological replicates). (c) Co-IP of Stomagen peptide with N. benthamiana microsomal fractions expressing the ectodomains and manbrane-spanning domains of ER and FLS2 fused with GFP or a control, uninoculated leaf sample. Immunopreciptation was performed using αGFP and immunoblotted using αGFP (for detection of receptors) or αStomagen antibodies. Experiments were repeated four times (four biological replicates).
Extended Data Fig. 7
Extended Data Fig. 7. Purified MEPF2 and Stomagen recombinant peptides and separation of bioactive MEPF2 by reverse-phase chromatography
(a) SDS-PAGE gel of purified and refolded MEPF2-MYC-HIS and Stomagen recombinant peptides (asterisks). Left: Molecular mass markers. (b) HPLC chromatogram of purified, refolded MEPF2. Peaks 1 and 2 in UV chromatogram were collected and subjected to bioassays. (c) Confocal image of cotyledon epidermis from wild-type seedling grown a solution with Peak 1 for five days. No stoma is visible indicating the peak 1 contains bioactive MEPF2. Scale bar, 20 μm. n=19.(d) Confocal image of cotyledon epidermis from wild-type seedling grown in a solution with Peak 2 for five days, with normal stomatal differentiation, indicating that the peptide is not bioactive. Scale bar, 20 μm. n=9.
Extended Data Fig. 8
Extended Data Fig. 8. Separation of properly-folded, bioactive Stomagen and mutant Stomagen peptides by reverse-phase chromatography followed by mass-spectrometry and bioassays
(a) HPLC chromatogram of purified, refolded Stomagen. Peaks 1 and 2 in UV chromatogram were collected and subjected to MALDI-TOF mass spectrometry (b and d) as well as for bioassays (c and e). (b) MALDI-TOF spectrum of Peak 1 from (a). A single-charged peptide corresponding to synthetic Stomagen peptide was observed at m/z = 5,118.5 ([M+H]+) and a double-charged at m/z = 2,559.8 ([M+2H]2+). (c) Confocal image of cotyledon epidermis from wild-type seedling grown a solution with Peak 1. Severe stomatal clustering and overproduction of stomata are observed. Scale bar, 20 μm. n=8. (d) MALDI-TOF spectrum of Peak 2 from (a). (e) Confocal image of cotyledon epidermis from wild-type seedling grown in a solution with Peak 2 from (a), with no stomatal clustering, indicating that the fraction is not bioactive. Scale bar, 20 μm. n=6. (f) HPLC chromatogram and bioassays of an independent batch of Stomagen peptides used for QCM analysis in direct comparison with non-folding mutant Stomagen peptides in Fig. 3c. Peaks 1 and 2 in UV chromatogram were collected and subjected for bioassays. Insets: Confocal microscopy images of cotyledon epidermis from wild-type seedling grown a solution with Peak 1 (bioactive) and Peak 2 (non-active) for five days. Scale bars, 50 μm. n=8 (Peak 1); n=6 (Peak 2). (g) HPLC chromatogram of purified, mutant Stomagen peptide in which all cysteine residues were substituted to serine residues (Stomagen_6C→S). The mutant Stomagen peptide yielded a single peak, which was subjected for bioassays followed by confocal microscopy (Inset). No stomatal clustering was observed, indicating that non-folding Stomagen peptide is not bioactive, confirming the previous results. Scale bar, 50 μm. n=8 for each peptide treatment.
Extended Data Fig. 9
Extended Data Fig. 9. Raw QCM recording data
Shown are raw recording data of frequency shifts for representative QCM analysis using biosensor chips immobilized with ERΔK-GFP and GFP (a, b, inset) after sequential injection of active Stomagen (a and c), MEPF2 (b), non-folding, inactive mutant Stomagen (c, inset), or LURE2 (d) in increasing concentrations. Bioactive Stomagen and inactive Stomagen experiments in (e) were performed side-by-side. Arrows: time of additional peptide application. Numbers of experiments performed for each analysis: Stomagen/ER, n=4; Stomagen/TMM, n=2; Stomagen/GFP, n=3; MEPF2/ER, n=2; MEPF2/TMM, n=3; MEPF2/GFP, n=2; Stomagen_C6->S/ER, n=3; and LURE2/ER: n=2.
Fig. 1
Fig. 1. Complete loss of ER-family genes confers insensitivity to STOMAGEN overexpression and co-suppression
(a-i) Representative confocal images of cotyledon abaxial epidermis from 10-day-old light grown seedlings of wild type (a-c), tmm (d-f), and er erl1 erl2 (g-i), with induced Stomagen overexpression (iSTOMAGEN,)(b, e, h) or STOMAGEN-ami construct (c, f, i). Uninduced controls show no effects (see Extended Data Figs. 2-4). Images were taken under the same magnification. Scale bar = 30 μm. n=13 (a); n=18 (b); n=26 (c); n=16 (d); n=24 (e); n=26 (f); n=16 (g); n=24 (h); n=12 (i). (j) Stomatal index. -, control; ami, Stomagen-ami. *** p<0.005 (Wilcoxon rank sum test). NS=Not significant (p= 0.653 for tmm; p=0.539 for er erl1 erl2). n=8 for each genotype. (k) Stomatal Index. -, uninduced; iSTOM, induced. *** p<0.005 (Wilcoxon rank sum test). NS=Not significant (p= 0.114 for tmm; p=0.688 for er erl1 erl2). No induction, n=16; iSTOM, n=14; tmm no induction, tmm iSTOM, er erl1 erl2, er erl1 erl2 iSTOM, n=15 for each genotype. For the total numbers of stomata counted, see legends for Extended Data Figs. 3 and 4.
Fig. 2
Fig. 2. STOMAGEN overexpression on stomatal development in tmm hypocotyl epidermis with combinatorial loss-of-function in ER-family genes
(a-h) Representative confocal microscopy images of hypocotyl epidermis from 10-day-old light-grown transgenic Est∷STOMAGEN seedlings of tmm (a, b); tmm er (c, d); tmm erl1 erl2 (e, f); and tmm er erl1 erl2 (g, h). A control, uninduced phenotype (a, c, e, g); iSTOMAGEN (b, d, f, h). iSTOMAGEN results in arrested stomatal precursor cells (asterisk) and stomatal-lineage ground cells (SLGCs: bracket) in tmm hypocotyls (b). Additional er mutation exaggerated this effect (d), while additional erl1 erl2 mutations increased stomata (f). Images were taken under the same magnification. Scale bar = 30 μm. n=20 (a); n=20 (b); n=19 (c); n=22 (d); n=17 (e); n=20 (f); n=20 (g), n=20 (h). For a complete set of higher-order mutant phenotypes and quantitative data, see Extended Data Fig. 5.
Fig. 3
Fig. 3. Direct and competitive binding of Stomagen and EPF2 peptides to ER
(a-c) QCM analysis for direct binding. (a, b) The averages of experimental frequency shift values recorded from two to four independent experiments for Stomagen (a) or MEPF2 (b) onto biosensor chips functionalized with ERΔK-GFP (red), TMM-GFP (blue), and GFP alone (gray) and fitted to the Langmuir adsorption model using least square regression. Error bars, SD. Stomagen/ER, n=4; Stomagen/TMM, n=2; Stomagen/GFP, n=3; MEPF2/ER, n=2; MEPF2/TMM, n=3; MEPF2/GFP, n=2. (c) The average experimental frequency shift values recorded for LURE2 (dark gray) and mutant Stomagen (light gray) on ERΔK-GFP. To calculate the Kd values, the ligand concentrations were increased to 1μM to obtain fitted curves. See Extended 9 for raw recording data. Stomagen_C6->S/ER, n=3; LURE2/ER: n=2. Right Insets: Wild-type cotyledon epidermis treated with 2.5 μM mutant or bioactive Stomagen. Scale bars, 30 μm. n=8 for each treatment. For (a-c), each QCM experiment (referred to as ‘n=1′) generates multi-point (10-20 point) data with average and SD values. (d) Competitive binding. Microsomal fractions expressing ERΔK-GFP were incubated with 1 μM of bioactive MEPF2 with increasing concentrations of bioactive Stomagen and subjected to IP. The MEPF2-MYC-HIS blot was re-probed with anti-Stomagen antibody. *, Most likely isomer. (e) Quantitative analysis of competition from four biological replicates. Error bars, S.E.M. The IC50 value is substantially higher than the Kd values for Stomagen-ER or Stomagen, presumably owing to the immunoblot-based quantification. (f) Wild-type cotyledon epidermis treated with MEPF2 alone or simultaneously co-treated with MEPF2 and increasing concentrations of Stomagen for five days. n=3 for each treatment. Images were taken under the same magnification. Scale bar, 50 μM.
Fig. 4
Fig. 4. EPF2, but not Stomagen, triggers downstream MAPK activation in Arabidopsis seedlings
(a, b) Differential MAPK activation in Arabidopsis wild-type seedlings treated with buffer only (a, Mock), MEPF2 (a, b), Stomagen (a), and heat-denatured MEPF2 (b) for respective time intervals (min). The blots were probed with anti-phosphoERK antibody (αERK) to detect phosphorylated MPK6 (pMPK6) and pMPK3 upon peptide treatment. *non-specific band. CBB, total proteins stained. Four and two biological replicates were performed for (a) and (b), respectively. (c) Confocal microscopy of Arabidopsis wild-type cotyledon abaxial epidermis treated with heat-denatured MEPF2 (top) and control, non-denatured MEPF2 (bottom). Scale bar, 40 μm. n=3 for each treatment.

Comment in

References

    1. Dorey K, Amaya E. FGF signalling: diverse roles during early vertebrate embryogenesis. Development. 2010;137:3731–3742. - PMC - PubMed
    1. Fukuda H, Higashiyama T. Diverse functions of plant peptides: entering a new phase. Plant & cell physiology. 2011;52:1–4. - PubMed
    1. Hara K, Kajita R, Torii KU, Bergmann DC, Kakimoto T. The secretory peptide gene EPF1 enforces the stomatal one-cell-spacing rule. Genes & development. 2007;21:1720–1725. - PMC - PubMed
    1. Hara K, et al. Epidermal cell density is auto-regulated via a secretory peptide, EPIDERMAL PATTERNING FACTOR2 in Arabidopsis leaves. Plant & cell physiology. 2009;50:1019–1031. - PubMed
    1. Hunt L, Gray JE. The signaling peptide EPF2 controls asymmetric cell divisions during stomatal development. Curr Biol. 2009;19:864–869. - PubMed

Publication types

MeSH terms

Substances