. 2015 Jun 16;42(6):1033-47.
doi: 10.1016/j.immuni.2015.05.024.

Complement Regulates Nutrient Influx and Metabolic Reprogramming during Th1 Cell Responses

Affiliations

Complement Regulates Nutrient Influx and Metabolic Reprogramming during Th1 Cell Responses

Martin Kolev et al. Immunity. .

Abstract

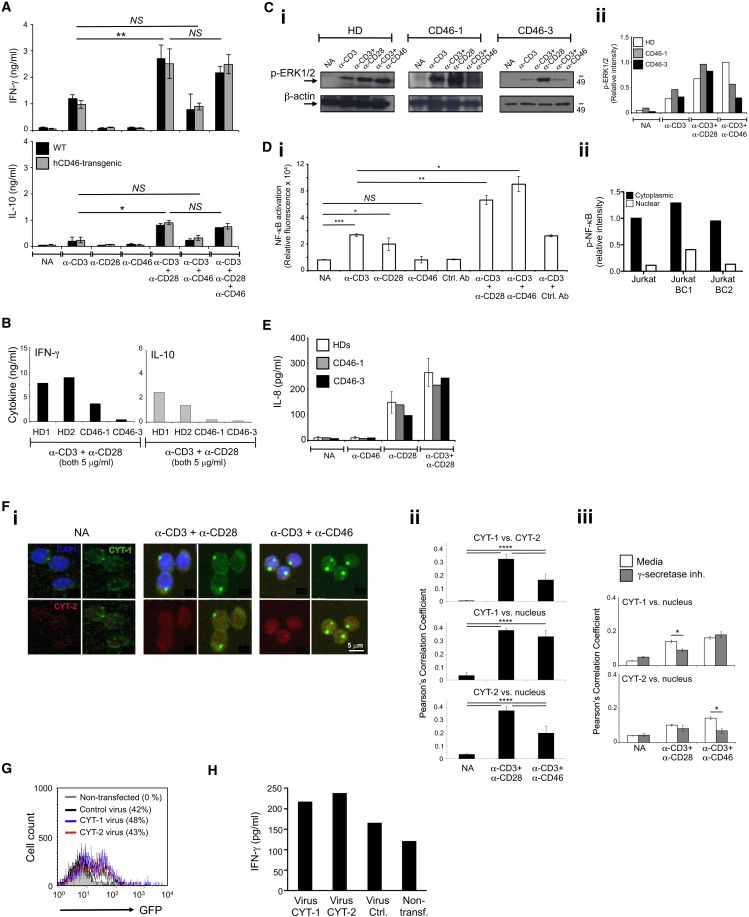
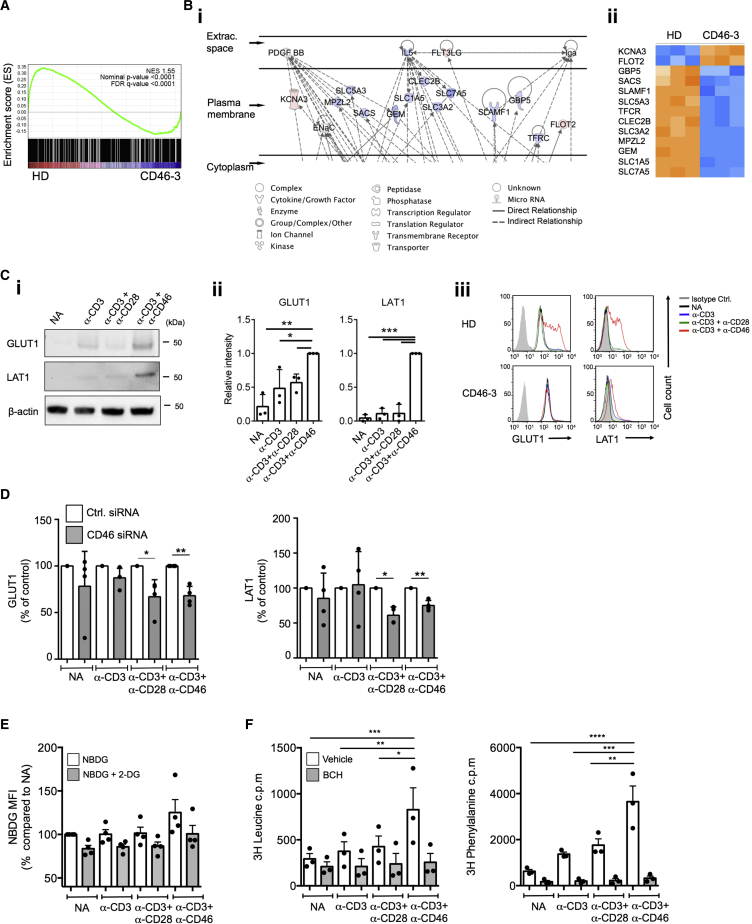
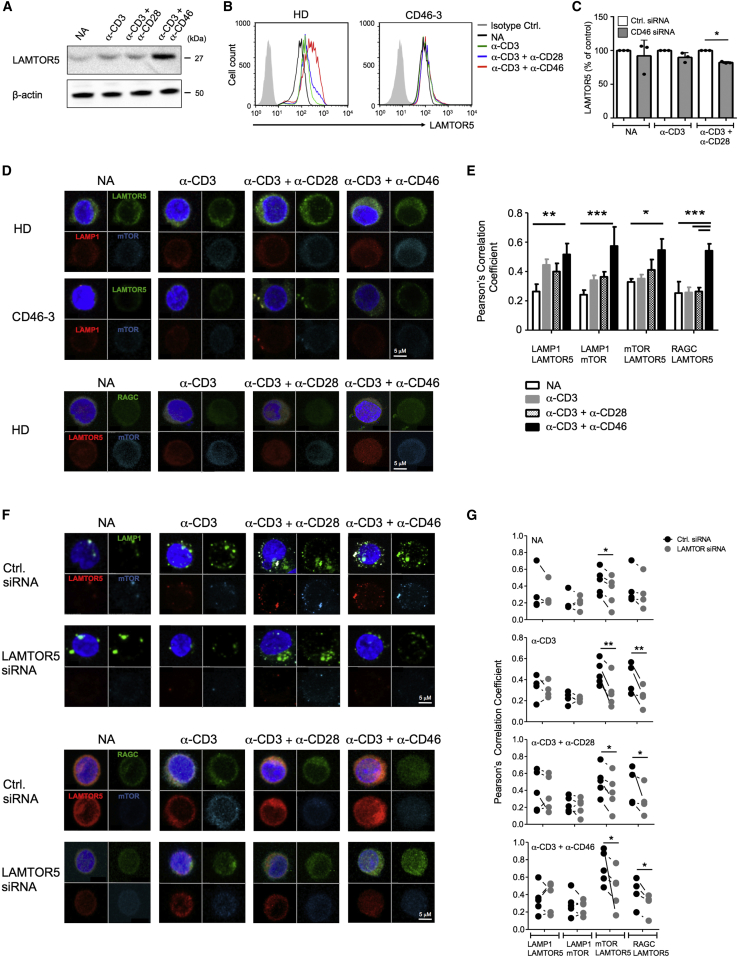
Expansion and acquisition of Th1 cell effector function requires metabolic reprogramming; however, the signals instructing these adaptations remain poorly defined. Here we found that in activated human T cells, autocrine stimulation of the complement receptor CD46, and specifically its intracellular domain CYT-1, was required for induction of the amino acid (AA) transporter LAT1 and enhanced expression of the glucose transporter GLUT1. Furthermore, CD46 activation simultaneously drove expression of LAMTOR5, which mediated assembly of the AA-sensing Ragulator-Rag-mTORC1 complex and increased glycolysis and oxidative phosphorylation (OXPHOS), required for cytokine production. T cells from CD46-deficient patients, characterized by defective Th1 cell induction, failed to upregulate the molecular components of this metabolic program as well as glycolysis and OXPHOS, but IFN-γ production could be reinstated by retrovirus-mediated CD46-CYT-1 expression. These data establish a critical link between the complement system and immunometabolic adaptations driving human CD4(+) T cell effector function.


Figures

None
Graphical abstract
Figure 1
Figure 1
Autocrine CD46-CYT-1 Activation Drives Glycolysis and Oxidative Phosphorylation in CD4+ T Cells (A) TCR and CD28-induced Th1 cell cytokine production correlates with CD46 ligand C3b generation as assessed 1 hr post activation. (B) Cytokines produced by (Bi) CD4+ T cells from age- and sex-matched healthy donors (HD1 to HD6) and patients CD46-1 (open circle), CD46-2 (open square), and CD46-3 (open triangle) or by (Bii) T cells from HDs treated with CD46 siRNA (n = 3 with duplicate samples [mean]). (C) Basal glycolysis (ECAR) and oxidative phosphorylation (OXPHOS, OCR) rates in resting and activated CD4+ T cells (Ci) from CD46-deficient patients (n = 3) and HDs (n = 6) or from (Cii) HD T cells after CD46-specific siRNA treatment. (D) Respiratory capacity and glycolysis in T cells from a HD and from patient CD46-2, basally and following mitochondrial perturbation. (E) CD46 expression in Jurkat T cells transfected with GFP-tagged CD46-CYT1 (Jurkat-BC1) or CD46-CYT2 (Jurkat-BC2) isoforms. (Ei) FACS-assessed surface expression of GFP-tagged CD46 and (Eii) endogenous (red) and recombinantly overexpressed CD46 (green) by confocal microscopy (n = 3). (F) Basal glycolysis and OXPHOS levels in Jurkat, Jurkat-BC1, and Jurkat-BC2 cells (n = 3). (G) CD46-BC1 isoform overexpression restores IFN-γ upon TCR activation in Jurkat cells (n = 3, IFN-γ measured 3 days post activation). Magnification (Eii) × 100. p < 0.05; ∗∗p < 0.01. Error bars represent mean ± SEM. See also Figure S1.
Figure 2
Figure 2
CD46 Costimulation Is Human Specific and Operates Differently from CD28 (A) CD4+ T cells from hCD46-transgenic or wild-type (WT) mice were stimulated with anti-mouse CD3 and CD28 and anti-human CD46 and cytokines measured 72 hr post activation (n = 3). (B) Increased TCR and CD28 activation cannot rescue defective Th1 cell induction in CD46-deficient T cells. Cells from HD1 and HD2 and patients CD46-1 and CD46-3 were activated as indicated and cytokines measured at 36 hr. (C) TCR and CD28-driven ERK1/2 phosphorylation occurs optimally in CD46-deficient T cells as assessed by (Ci) western blot and (Cii) densitometric analyses 30 min post activation. (D) CD46 induced canonical NF-κB activation utilizing (Di) T cells transfected with a NF-kB luciferase reporter plasmid and NF-κB activation measured at 1 hr post activation and measuring (Dii) NF-κB activation in Jurkat, Jurkat-BC1, and Jurkat-BC2 cells (n = 4). (E) CD28 induces normal IL-8 secretion in T cells from patients at 36 hr post activation. (F) CD46 CYT-1 and CYT-2 translocate to the nucleus upon cleavage by γ-secretase as assessed by (Fi) confocal microscopy using CYT-1 and CYT-2-specific antibodies with analyses of colocalization events in (Fii) the absence or (Fiii) presence of γ-secretase inhibition (n = 3). (G and H) Transfection of CD46 intracellular domains rescues IFN-γ production in T cells from patient CD46-3. (G and H) Transfection efficiency (G) of T cells isolated from patient CD46-3 transfected with retroviruses expressing either CYT-1 or CYT-2 (or the GFP reporter gene) and (H) IFN-γ production by CD4+ T cells from patient CD46-3 after retroviral transfection at 24 hr post CD3+CD28 activation. p < 0.05; ∗∗p < 0.01; ∗∗∗; p < 0.005; ∗∗∗∗p < 0.001; NS, statistically not significant. Error bars represent mean ± SEM. See also Figure S2.
Figure 3
Figure 3
CD46 Mediates Glucose and AA Channel Expression and Nutrient Influx in CD4+ T Cells (A and B) Gene expression array and Ingenuity Pathway Analysis (IAP) comparison of CD46-sufficient and -deficient CD4+ T cells activated for 2 hr with anti-CD3+CD46 mAb with (A) gene set enrichment analysis (GSEA) and (B) extract of IPA output showing (Bi) membrane-associated genes involved in AA metabolism (full figure in Figure S2B) and (Bii) a heatmap of those genes. (C) GLUT1 and LAT1 expression on T cells from HDs 36 hr post activation assessed by (Ci) western blotting with (Cii) the corresponding statistical analyses via densitometric measurement, and (Ciii) from patient CD46-3 measured by FACS (n = 3). (D) CD46 silencing prevents normal GLUT1 and LAT1 expression (n = 4; 72 hr post activation). (E and F) Glucose and AA uptake upon CD46 activation with (E) glucose uptake assessed with or without addition of competing unlabeled 2-DG and (F) AA uptake measured with or without addition of a LAT1 inhibitor (BCH) (n = 3). p < 0.05; ∗∗p < 0.01; ∗∗∗p < 0.005; ∗∗∗∗p < 0.001. Error bars represent mean ± SEM. See also Figure S3.
Figure 4
Figure 4
CD46 Regulates mTORC1 Activity in CD4+ T Cells (A) CD46 activation sustains p70S6K phosphorylation as assessed by (Ai) western blotting with (Aii) the corresponding statistical analyses via densitometric measurement of band intensities (n = 4–5). (B) Effect of rapamycin on p70S6K phosphorylation (p-p70S6K) at 36 hr with (Bi) a representative FACS analysis of n = 3, and (Bii) depicting their statistical analysis. (C) Effect of Rapamycin on GLUT1 and LAT1 expression. T cells were activated as under (B) and expression of GLUT1 (upper panel) and LAT1 (lower panel) measured (n = 4). (D) mTOR (p-mTOR) and p70S6K phosphorylation in T cells from HD1-4 and patient CD46-3 36 hr post activation. (E) p-mTOR and p-p70S6K levels in Jurkat, Jurkat-BC1, and Jurkat-BC2 cells (n = 3). p < 0.05, ∗∗p < 0.01; ∗∗∗p < 0.005. Error bars represent mean ± SEM. See also Figure S4.
Figure 5
Figure 5
LAMTOR5 Is Required for mTORC1 Complex Assembly in Human CD4+ T Cells (A–C) LAMTOR5 expression in T cells from (A) a healthy donor (HD) assessed by western blotting, (B) in patient CD46-3 and a HD by FACS analysis, and in (C) HD T cells treated with CD46-specific siRNA at 72 hr post activation. (D) CD46 activation increases LAMTOR5-dependent assembly of the lysosome-based machinery enabling amino acid sensing via mTORC1 as assessed at 36 hr post activation by confocal microscopy. For the HDs, one representative example is shown for n = 7. Staining of RAGC could not be performed on cells from patient CD46-3. (E) Statistical analysis for the colocalization events in HD T cells of the proteins assessed under (D) (n = 7). (F) Reduction of LAMTOR5 expression prevents normal mTORC1 assembly measured at 36 hr post activation by (F) confocal microscopy, and (G) colocalization of proteins measured with the Pearson’s Correlation Coefficient method. Results shown in (F) and (G) are representative n = 5. Magnification (C and E) × 100. p < 0.05; ∗∗p < 0.01; ∗∗∗p < 0.005. Error bars represent mean ± SEM. See also Figure S5.
Figure 6
Figure 6
CD46-Driven Glucose and Amino Acid Influx and mTORC1-Activity Are Critical to Human Th1 Cell Induction (A and B) Th1 cell induction (upper panels) and IL-10 switching (lower panels) assessed at 36 hr post activation in the presence of 2-deoxyglucose (2-DG) and BCH. (C) Effect of mTORC1 inhibition on Th1 cell induction at 36 hr post activation. (D) Impact of LAMTOR5-silencing on Th1 cell induction. CD4+ T cells transfected with siRNAs as shown were activated as depicted for 36 hr and analyzed for IFN-γ and IL-10 production. Data shown in (A)–(D) are n = 3. NA, non-activated. p < 0.05; ∗∗p < 0.01; ∗∗∗p < 0.005; ∗∗∗∗p < 0.001. Error bars represent mean ± SEM.
Figure 7
Figure 7
Switches in CD46 Isoform-Expression Correlate with Expected Metabolic Changes during the Th1 Cell Life Cycle (A) CD46 isoform mRNA levels in (Ai) non-activated (NA) and activated T cells (36 hr, left panel) and in sorted IFN-γ+, IFN-γ+IL-10+, and IL-10+ Th1 cell subpopulations (activated for 36 hr, right panel), and (Aii) ratio of CYT-1 to CYT-2 tail mRNA expression. (B–D) Nutrient channel expression, mTORC1 activity and glycolysis and OXPHOS levels in IFN-γ+, IFN-γ+IL-10+, and IL-10+ Th1 cell subpopulations. Data in (A)–(D) are derived from n = 3. p < 0.05; ∗∗p < 0.01. See also Figure S6.

Comment in

References

    1. Astier A., Trescol-Biémont M.C., Azocar O., Lamouille B., Rabourdin-Combe C. Cutting edge: CD46, a new costimulatory molecule for T cells, that induces p120CBL and LAT phosphorylation. J. Immunol. 2000;164:6091–6095. - PubMed
    1. Astier A.L., Meiffren G., Freeman S., Hafler D.A. Alterations in CD46-mediated Tr1 regulatory T cells in patients with multiple sclerosis. J. Clin. Invest. 2006;116:3252–3257. - PMC - PubMed
    1. Bachar E., Ariav Y., Ketzinel-Gilad M., Cerasi E., Kaiser N., Leibowitz G. Glucose amplifies fatty acid-induced endoplasmic reticulum stress in pancreatic beta-cells via activation of mTORC1. PLoS ONE. 2009;4:e4954. - PMC - PubMed
    1. Bar-Peled L., Sabatini D.M. Regulation of mTORC1 by amino acids. Trends Cell Biol. 2014;24:400–406. - PMC - PubMed
    1. Bar-Peled L., Schweitzer L.D., Zoncu R., Sabatini D.M. Ragulator is a GEF for the rag GTPases that signal amino acid levels to mTORC1. Cell. 2012;150:1196–1208. - PMC - PubMed

Publication types

MeSH terms

Associated data