Review
. 2015 Jul;88(1051):20150172.
doi: 10.1259/bjr.20150172. Epub 2015 May 26.

Exploiting biological and physical determinants of radiotherapy toxicity to individualize treatment

Affiliations
Review

Exploiting biological and physical determinants of radiotherapy toxicity to individualize treatment

J E Scaife et al. Br J Radiol. 2015 Jul.

Abstract

The recent advances in radiation delivery can improve tumour control probability (TCP) and reduce treatment-related toxicity. The use of intensity-modulated radiotherapy (IMRT) in particular can reduce normal tissue toxicity, an objective in its own right, and can allow safe dose escalation in selected cases. Ideally, IMRT should be combined with image guidance to verify the position of the target, since patients, target and organs at risk can move day to day. Daily image guidance scans can be used to identify the position of normal tissue structures and potentially to compute the daily delivered dose. Fundamentally, it is still the tolerance of the normal tissues that limits radiotherapy (RT) dose and therefore tumour control. However, the dose-response relationships for both tumour and normal tissues are relatively steep, meaning that small dose differences can translate into clinically relevant improvements. Differences exist between individuals in the severity of toxicity experienced for a given dose of RT. Some of this difference may be the result of differences between the planned dose and the accumulated dose (DA). However, some may be owing to intrinsic differences in radiosensitivity of the normal tissues between individuals. This field has been developing rapidly, with the demonstration of definite associations between genetic polymorphisms and variation in toxicity recently described. It might be possible to identify more resistant patients who would be suitable for dose escalation, as well as more sensitive patients for whom toxicity could be reduced or avoided. Daily differences in delivered dose have been investigated within the VoxTox research programme, using the rectum as an example organ at risk. In patients with prostate cancer receiving curative RT, considerable daily variation in rectal position and dose can be demonstrated, although the median position matches the planning scan well. Overall, in 10 patients, the mean difference between planned and accumulated rectal equivalent uniform doses was -2.7 Gy (5%), and a dose reduction was seen in 7 of the 10 cases. If dose escalation was performed to take rectal dose back to the planned level, this should increase the mean TCP (as biochemical progression-free survival) by 5%. Combining radiogenomics with individual estimates of DA might identify almost half of patients undergoing radical RT who might benefit from either dose escalation, suggesting improved tumour cure or reduced toxicity or both.


Figures

Figure 1.
Figure 1.
Sigmoid dose–response curves for tumour and normal tissue. A risk of significant normal tissue damage of 5% may be accepted in order to achieve a tumour control probability (TCP) of 50%, as illustrated here. For some tissues, such as the spinal cord, a 5% risk of late damage would be unacceptably high. The TCP curve can be shifted to the left by sensitising the tumour, for example with chemotherapy, although some agents may also have an effect on the normal tissue curve too. The normal tissue complication probability (NTCP) curve can be shifted to the right, for example using intensity-modulated radiotherapy and image guidance to spare more normal tissue from high doses. Ideally, strategies can be combined in order to shift the tumour control curve left and the normal tissue curve right. This will achieve a large rise in TCP with a fall in NTCP.
Figure 2.
Figure 2.
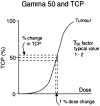
Diagram to illustrate the concept of the parameter γ-50, that is, the percentage increase in tumour control (or alternatively in normal tissue complication probability) for a 1% increase in dose at the 50% effect level. TCP, tumour control probability.
Figure 3.
Figure 3.
Classic sigmoid and bell-shaped dose–response curves for clinical normal tissue toxicity, redrawn from Holthusen. In this case, the end point was telangiectasia of the skin, and dose is measured in Röntgen (r): 100 r approximately equals 1 Gy. The sigmoid curve (left) represents a cumulative frequency distribution, whereas the bell-shaped curve (right), which has been created by transforming it, represents a differential frequency distribution. Note that this is not a true gaussian distribution because it has a finite range and is skewed. This is almost certainly a true representation of the biology, where at least extreme resistance to radiation is not plausible.
Figure 4.
Figure 4.
Stylized frequency distribution of normal cellular and tissue response shown on a relative scale. At the left, the sensitive end of the spectrum, some patients are known to have extreme sensitivity in both cells and tissues, including those homozygous for ataxia telangiectasia mutations. At least some of these patients (e.g. the patient whose cells were designated 180BR,) are also sensitive to chemotherapy agents with a mode of action involving DNA damage. Here, the normal range has been represented by an approximate gaussian distribution. Although this is not perfectly correct biologically, it can provide estimates for the standard deviation of the distribution. Questions remain about how far the tail extends to the sensitive (left) side of the curve; to the right, it is also likely that the distribution is truncated (Figure 3). The near gaussian shape is consistent with clinical data and also with cellular sensitivity data., It can reasonably be assumed that the range extends either side of the modal value for 2.5–4 standard deviations (adapted from Burnett et al).
Figure 5.
Figure 5.
Frequency distribution of normalized peak erythema of the skin (acute reaction), with a near gaussian shape (redrawn from). Superimposed is the estimate of the variation in dose required to move an “average” patient from the mean of the distribution to the sensitive or resistant ends (Turesson). The variation of ±20% can be used to estimate the potential for dose escalation in resistant patients. It can also give an indication of the dose reduction required, or its equivalent achieved with, for example, hyperfractionation, to avoid toxicity in more sensitive patients. A similar dose equivalent range (±23%) has been observed in large studies of fibroblast cellular sensitivity in cells taken from normal patients having radiotherapy.,
Figure 6.
Figure 6.
Axial slices at the same level from two patients to illustrate differences in mean position at treatment compared with that at planning. (a) Loaded rectum on kilo voltage (kV) scan from patient whose rectal position during treatment was 9.6 mm more posterior than at planning. (b) Empty rectum on Day 1 mega voltage (MV) scan from same patient as (a). (c) Empty rectum on kV scan from patient with rectal position during treatment was 3.2 mm more anterior than at planning. (d) Loaded rectum on Day 35 MV scan from same patient as (c). Reproduced from Scaife et al with permission from the British Institute of Radiology.
Figure 7.
Figure 7.
Dose–surface maps (DSMs) for Patient A, with the highest accumulated equivalent uniform dose (EUD) compared with planned (+5.3 Gy) of the 10 patients and for Patient B with the lowest accumulated EUD compared with planned (−10.2 Gy). The rectum was considered a cylinder, and daily delivered dose was sampled at a set of equally spaced points on each MV slice. The cylinder was then “cut” at the point where a vertical line from the centroid of each outline crossed the posterior edge and unfolded. The DSMs were summed over all the fractions, based on the superior–inferior positions of each image corrected for the shifts applied at treatment. Results are shown as accumulated DSMs; planned DSMs are shown for comparison. The difference DSM represents the difference for each pixel between accumulated and planned dose. Since the length of the MV CT image set was less than that of the rectum, the difference DSM is shorter (shown in grey). Although Patient A had a median DA of 1.7 Gy higher than planned, areas of the superior rectum received doses of up to 2.8 Gy less than planned. Patient B had a median DA of −0.8 Gy compared with that planned; in this case, inferior and superior rectum received up to 13.9 Gy more than planned. A, anterior; L, left; P, posterior; R, right. Reproduced from Scaife et al122 with permission from the British Institute of Radiology.

References

    1. Bentzen SM, Heeren G, Cottier B, Slotman B, Glimelius B, Lievens Y, et al. . Towards evidence-based guidelines for radiotherapy infrastructure and staffing needs in Europe: the ESTRO QUARTS project. Radiother Oncol 2005; 75: 355–65. doi: 10.1016/j.radonc.2004.12.007 - DOI - PubMed
    1. IAEA Human Health Series No. 14. Planning National radiotherapy services: a practical tool. International Atomic Energy Agency, Vienna, 2010.
    1. Ahmad AS, Ormiston-Smith N, Sasieni PD. Trends in the lifetime risk of developing cancer in Great Britain: comparison of risk for those born from 1930 to 1960. Br J Cancer 2015; 112: 943–7. doi: 10.1038/bjc.2014.606 - DOI - PMC - PubMed
    1. Overgaard J. Radiotherapy. Gazing at the crystal ball of European radiotherapy. Nat Rev Clin Oncol 2015; 12: 5–6. doi: 10.1038/nrclinonc.2014.205 - DOI - PubMed
    1. Kings Fund, London. 2011. [Updated 28 January 2015; cited 5 June 2015]. Available from: http://www.kingsfund.org.uk/sites/files/kf/How-to-improve-cancer-surviva...

Publication types

MeSH terms