. 2015 Aug;138(Pt 8):2263-77.
doi: 10.1093/brain/awv152. Epub 2015 Jun 17.

Quantitative assessments of traumatic axonal injury in human brain: concordance of microdialysis and advanced MRI

Affiliations

Quantitative assessments of traumatic axonal injury in human brain: concordance of microdialysis and advanced MRI

Sandra Magnoni et al. Brain. 2015 Aug.

Abstract

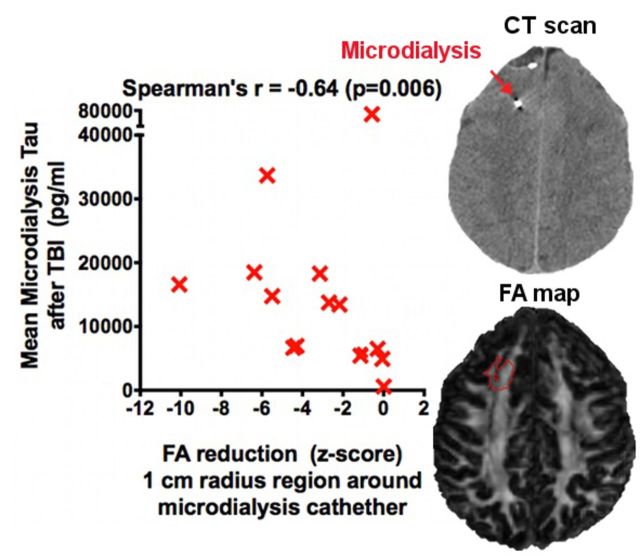
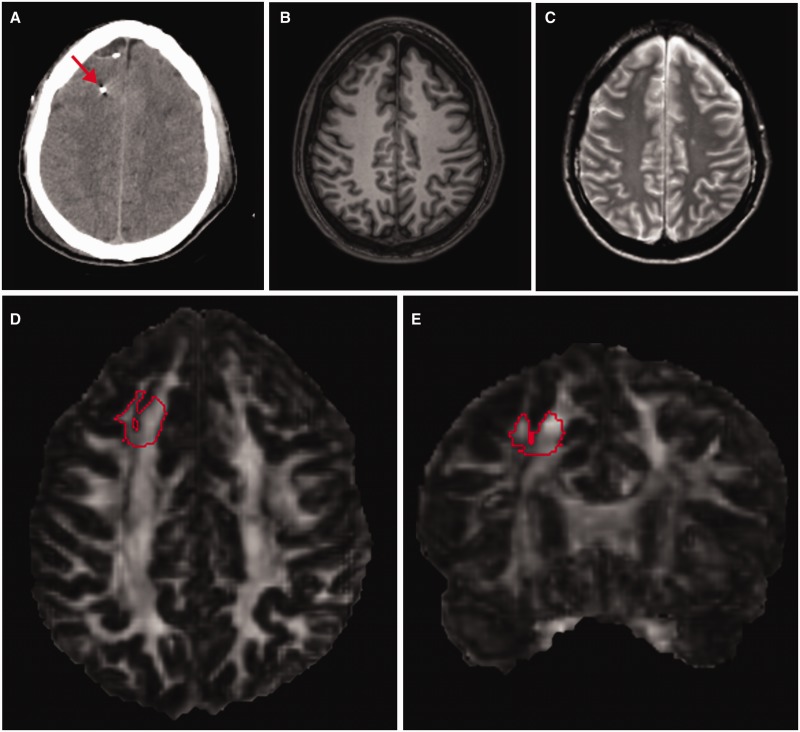
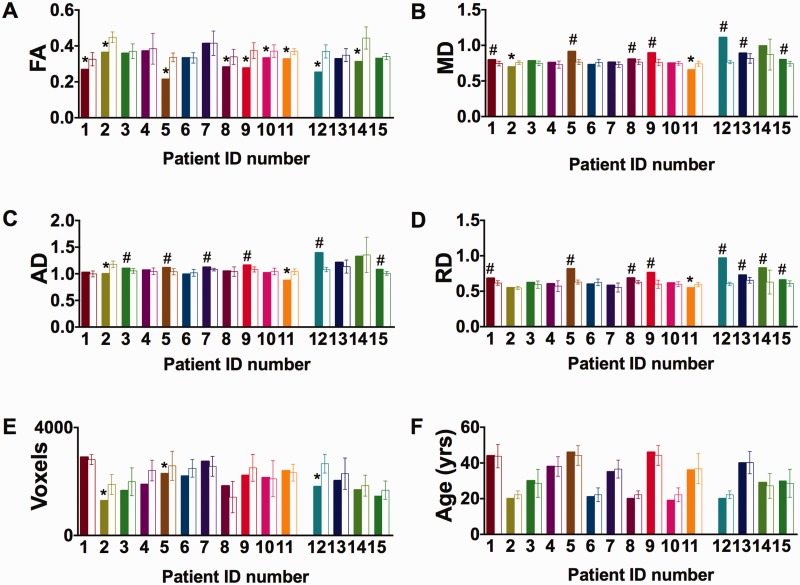
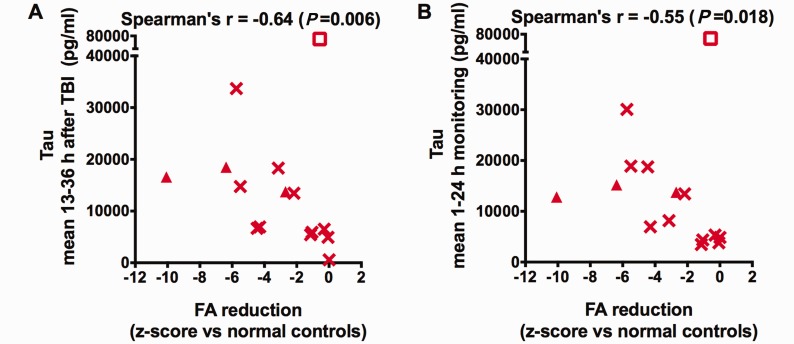
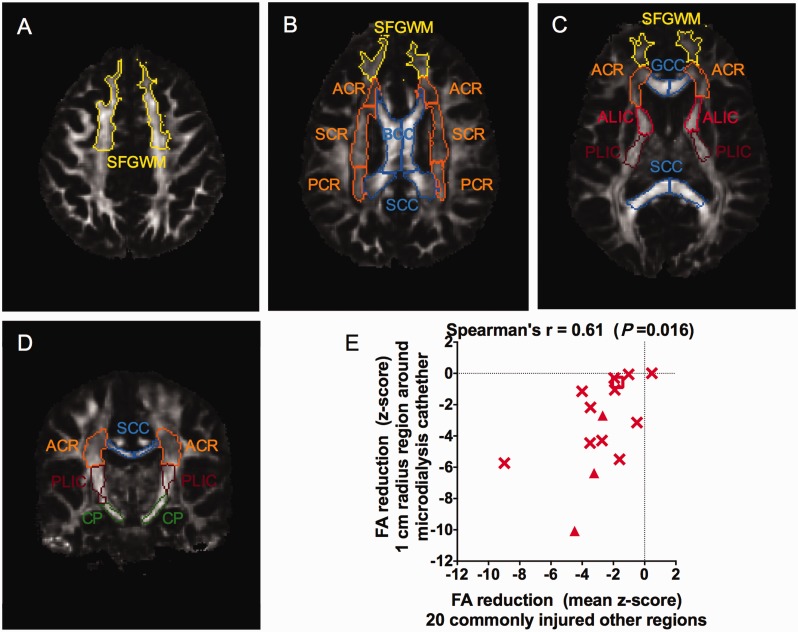
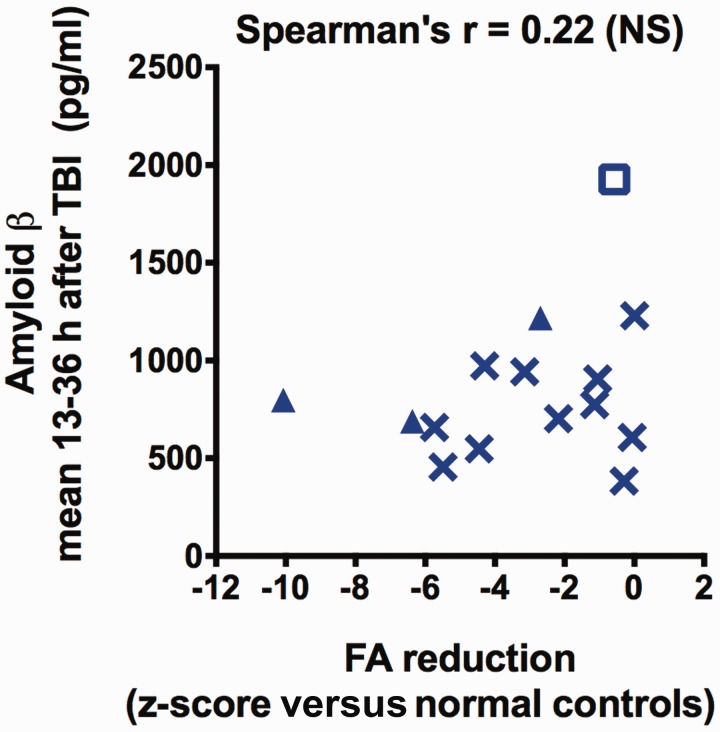
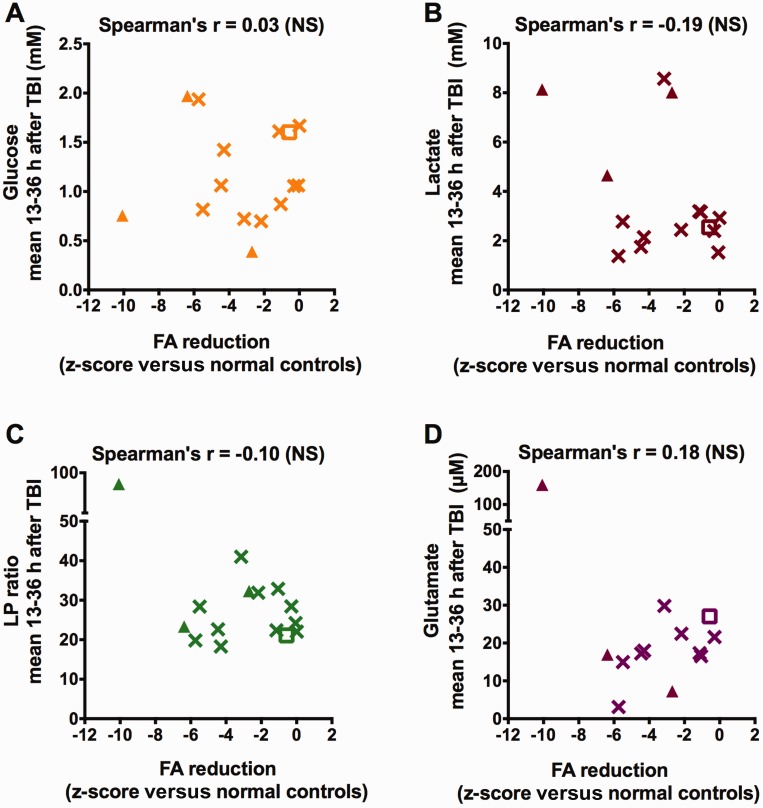
Axonal injury is a major contributor to adverse outcomes following brain trauma. However, the extent of axonal injury cannot currently be assessed reliably in living humans. Here, we used two experimental methods with distinct noise sources and limitations in the same cohort of 15 patients with severe traumatic brain injury to assess axonal injury. One hundred kilodalton cut-off microdialysis catheters were implanted at a median time of 17 h (13-29 h) after injury in normal appearing (on computed tomography scan) frontal white matter in all patients, and samples were collected for at least 72 h. Multiple analytes, such as the metabolic markers glucose, lactate, pyruvate, glutamate and tau and amyloid-β proteins, were measured every 1-2 h in the microdialysis samples. Diffusion tensor magnetic resonance imaging scans at 3 T were performed 2-9 weeks after injury in 11 patients. Stability of diffusion tensor imaging findings was verified by repeat scans 1-3 years later in seven patients. An additional four patients were scanned only at 1-3 years after injury. Imaging abnormalities were assessed based on comparisons with five healthy control subjects for each patient, matched by age and sex (32 controls in total). No safety concerns arose during either microdialysis or scanning. We found that acute microdialysis measurements of the axonal cytoskeletal protein tau in the brain extracellular space correlated well with diffusion tensor magnetic resonance imaging-based measurements of reduced brain white matter integrity in the 1-cm radius white matter-masked region near the microdialysis catheter insertion sites. Specifically, we found a significant inverse correlation between microdialysis measured levels of tau 13-36 h after injury and anisotropy reductions in comparison with healthy controls (Spearman's r = -0.64, P = 0.006). Anisotropy reductions near microdialysis catheter insertion sites were highly correlated with reductions in multiple additional white matter regions. We interpret this result to mean that both microdialysis and diffusion tensor magnetic resonance imaging accurately reflect the same pathophysiological process: traumatic axonal injury. This cross-validation increases confidence in both methods for the clinical assessment of axonal injury. However, neither microdialysis nor diffusion tensor magnetic resonance imaging have been validated versus post-mortem histology in humans. Furthermore, future work will be required to determine the prognostic significance of these assessments of traumatic axonal injury when combined with other clinical and radiological measures.

Keywords: diffusion tensor imaging; microdialysis; tau; traumatic axonal injury; traumatic brain injury.


Figures

None
The extent of axonal injury after brain trauma cannot yet be assessed reliably in living subjects. Magnoni et al. report that microdialysis measurements of the cytoskeletal protein tau correlate well with locally reduced anisotropy revealed by diffusion tensor imaging. This cross-validation increases confidence in both methods to assess axonal injury.
Figure 1
Figure 1
Example of DTI analysis in a region of interest around the location where the microdialysis catheter had been. (A) Axial view of the co-registered CT scan of the brain from a representative patient, showing the microdialysis gold-tipped catheter (arrow) placed in right frontal white matter. (B and C) Axial view of the co-registered T1- and T2-weighted MRI scans of the same patient, showing that brain tissue appears normal on conventional MRI around the region where the microdialysis catheter had been. Axial (D) and coronal (E) view of the co-registered fractional anisotropy map of the same patient performed 18 days after the injury and 11 days after the microdialysis catheter had been removed. The 3D region of interest (in red) used for DTI analysis was manually traced on the fractional anisotropy map around the coordinates in standardized space where the microdialysis catheter had been. The region of interest was then thresholded to include only white matter.
Figure 2
Figure 2
Abnormalities in DTI metrics in regions of interest around the locations where microdialysis catheters had been. (A) Differences in fractional anisotropy (FA) in patients (number 1 to 15) versus five age- and sex-matched, healthy controls for each patient (open bars). (B–D) Differences in mean diffusivity (MD), axial (AD), radial diffusivity (RD) in the same patients and controls. Fractional anisotropy reductions were the most consistently observed DTI abnormalities. Fractional anisotropy was reduced in 9 of 15 subjects. Mean diffusivity was increased in seven patients and decreased in two. Axial diffusivity was increased in six patients and decreased in two. Radial diffusivity was increased in eight patients and decreased in one. Interestingly, in the single patient with reduced radial diffusivity (Patient 11), axial diffusivity was reduced to an even greater extent and fractional anisotropy was also reduced. (E and F) Region of interest size (number of voxels) and age for the patients and controls. The regions of interest size tended to be smaller in patients versus controls, but in only three subjects was this reduction >2 SD below the controls. Age was not different in patients compared to controls. Differences are defined as variations of at least 2 SD above or below the means for healthy controls (five healthy control subjects for each patient). The last four patients on the right side (Patients 12–15) are those in whom DTI was performed in the chronic phase. Symbols indicate significant reductions (asterisk) or increases (hash). Error bars represent mean ± 2 SD for the healthy controls.
Figure 3
Figure 3
Correlation between fractional anisotropy reductions and microdialysis measured levels of tau. Fractional anisotropy (FA) was measured in patients (n = 15) and healthy volunteers, and the z-score of patients relative to controls was computed, which indicates the extent to which fractional anisotropy was below (negative score) or above (positive score) the mean. There were significant negative correlations (Spearman’s one-tailed correlation tests) between fractional anisotropy z-scores and (A) increased tau levels 13–36 h after initial injury as well as (B) increased tau levels over the first 24 h of microdialysis monitoring. The z-scores of fractional anisotropy were negative, indicating that anisotropy was globally reduced in patients compared to controls. Triangular symbols indicate patients with conventional MRI abnormalities in the region of microdialysis catheter insertion, compared to patients with normal-appearing regions of interest on conventional MRI (other symbols). The empty rectangular symbol corresponds to a possible outlier (Patient 3).
Figure 4
Figure 4
Correlation between reduced fractional anisotropy in other commonly injured brain white matter regions and reduced fractional anisotropy in the 1-cm radius white matter regions around microdialysis catheter placement sites. Axial (A–C) and coronal (D) slices from DTI fractional anisotropy maps in a normal control indicating locations of regions of interest analysed using DTIStudio. (E) Correlation between mean fractional anisotropy reductions in other commonly injured regions versus fractional anisotropy reduction in the 1-cm radius region of interest around location where the microdialysis catheters had been. Data expressed as z-scores, defined as number of standard deviations away from the mean of five identically imaged normal control subjects age-matched to each patient. Triangles indicate three patients with conventional MRI abnormalities in the region of microdialysis catheter insertion (as in Fig. 3). Square indicates possible outlier in the tau versus fractional anisotropy measurement (as in Fig. 3). SFGWM = superior frontal gyrus white matter; ACR = anterior corona radiata; SCR = superior corona radiata; PCR = posterior corona radiata; BCC = body of the corpus callosum; SCC = splenium of the corpus callosum; GCC = genu of the corpus callosum; ALIC = anterior limb of the internal capsule; PLIC = posterior limb of the internal capsule; CP = cerebral peduncle.
Figure 5
Figure 5
No correlation between fractional anisotropy reductions and microdialysis measured levels of amyloid-β. There was no correlation between fractional anisotropy (FA) z-scores and interstitial levels of amyloid-β 13–36 h after initial injury (Spearman’s one-tailed correlation test, n = 15). Z-scores are calculated as indicated in Fig. 3. Triangles indicate patients with conventional MRI abnormalities in the region of microdialysis catheter insertion and empty rectangular symbol corresponds to the outlier as in Fig. 3.
Figure 6
Figure 6
No correlation between fractional anisotropy reductions and microdialysis measured brain metabolic markers. There was no correlation between fractional anisotropy (FA) z-scores and interstitial levels of glucose (A), lactate (B), lactate to pyruvate ratio (C), and glutamate (D) 13–36 h after initial injury (Spearman’s one-tailed correlation tests, n = 15). Z-scores are calculated as indicated in Fig. 3. Triangles indicate patients with conventional MRI abnormalities in the region of microdialysis catheter insertion and open squares correspond to the outlier as in Fig. 3.

References

    1. Adams JH, Doyle D, Ford I, Gennarelli TA, Graham DI, McLellan DR. Diffuse axonal injury in head injury: definition, diagnosis and grading. Histopathology 1989; 15: 49–59. - PubMed
    1. Adams JH, Graham DI, Murray LS, Scott G. Diffuse axonal injury due to nonmissile head injury in humans: an analysis of 45 cases. Ann Neurol 1982; 12: 557–63. - PubMed
    1. Adams JH, Jennett B, Murray LS, Teasdale GM, Gennarelli TA, Graham DI. Neuropathological findings in disabled survivors of a head injury. J Neurotrauma 2011; 28: 701–9. - PubMed
    1. Arfanakis K, Haughton VM, Carew JD, Rogers BP, Dempsey RJ, Meyerand ME. Diffusion tensor MR imaging in diffuse axonal injury. AJNR Am J Neuroradiol 2002; 23: 794–802. - PMC - PubMed
    1. Assaf Y, Pasternak O. Diffusion tensor imaging (DTI)-based white matter mapping in brain research: a review. J Mol Neurosci 2008; 34: 51–61. - PubMed

Publication types