. 2015 Jun 17;7(292):292ra100.
doi: 10.1126/scitranslmed.3010611.

Detection of human brain cancer infiltration ex vivo and in vivo using quantitative optical coherence tomography

Affiliations

Detection of human brain cancer infiltration ex vivo and in vivo using quantitative optical coherence tomography

Carmen Kut et al. Sci Transl Med. .

Abstract

More complete brain cancer resection can prolong survival and delay recurrence. However, it is challenging to distinguish cancer from noncancer tissues intraoperatively, especially at the transitional, infiltrative zones. This is especially critical in eloquent regions (for example, speech and motor areas). This study tested the feasibility of label-free, quantitative optical coherence tomography (OCT) for differentiating cancer from noncancer in human brain tissues. Fresh ex vivo human brain tissues were obtained from 32 patients with grade II to IV brain cancer and 5 patients with noncancer brain pathologies. On the basis of volumetric OCT imaging data, pathologically confirmed brain cancer tissues (both high- and low-grade) had significantly lower optical attenuation values at both cancer core and infiltrated zones when compared with noncancer white matter, and OCT achieved high sensitivity and specificity at an attenuation threshold of 5.5 mm(-1) for brain cancer patients. We also used this attenuation threshold to confirm the intraoperative feasibility of performing in vivo OCT-guided surgery using a murine model harboring human brain cancer. Our OCT system was capable of processing and displaying a color-coded optical property map in real time at a rate of 110 to 215 frames per second, or 1.2 to 2.4 s for an 8- to 16-mm(3) tissue volume, thus providing direct visual cues for cancer versus noncancer areas. Our study demonstrates the translational and practical potential of OCT in differentiating cancer from noncancer tissue. Its intraoperative use may facilitate safe and extensive resection of infiltrative brain cancers and consequently lead to improved outcomes when compared with current clinical standards.


Figures

Figure 1
Figure 1. Study design to differentiate cancer versus non-cancer with OCT
We recruited 37 patients for this study, generating over 4670 data points. (B) Brain cancer samples were obtained from cancer core (red arrow), infiltrated zone (orange arrow), and resection margin (green arrow) during surgery. (C) Tissues were marked with yellow dye (at the 1st scan line) for imaging registration. Cross-sectional OCT imaging of the tissue was then performed along dotted lines. The depth-dependent OCT signal profiles were acquired over different, relatively homogenous regions and analyzed to obtain the optical attenuation values for differentiating cancer versus non-cancer samples. Results showed that OCT signal profiles (curves) and the tissue attenuation values (slope of the curve) differed among cancer core (red), infiltrated zone (orange) and non-cancer resection margin (green). After OCT imaging, tissues were prepared for histology and evaluated by a neuro-pathologist. (D) Based on the OCT data, optimal attenuation thresholds and receiver operating characteristics (ROC) curves were determined using brain tissues in the training dataset. Using these parameters, a validation dataset was recruited to establish the OCT sensitivity and specificity in identifying cancer versus non-cancer using a double-blinded procedure. (E) To facilitate potential intraoperative use, a 3D volumetric reconstruction of the OCT images was generated with an overlaid color-coded attenuation map of the ex vivo human brain tissue.
Figure 2
Figure 2. Establishing the optical attenuation threshold for high-grade and low-grade brain cancers in patients
The histogram distribution (A), the diagnostic sensitivity/specificity (B), and the optimal attenuation threshold (C) are shown for both cancer core and infiltrated zone in tissue blocks freshly resected from 9 high-grade, 2 low-grade and 5 control patients within the training dataset. At the 5.5 mm-1 optical attenuation threshold, maximum sensitivity was achieved while maintaining at least 80% specificity for differentiating cancer versus non-cancer tissues in cancer core and infiltrated zone.
Figure 3
Figure 3. Sensitivity and specificity in cancer core and infiltrated zones and histology correlating with OCT attenuation maps
(A) Receiver operating characteristic (ROC) curves with true-positive (sensitivity) and false-positive (1 - specificity) rates were computed for cancer core and infiltrated zone in tissues obtained from 16 patients within the training dataset. (B) En face attenuation results of a high-grade brain cancer tissue block (2 mm × 2 mm × 1.8 mm) are shown with corresponding histology. Areas of high cancer density have low optical attenuation (red). Areas of medium cancer density have medium optical attenuation (yellow). Areas with low cancer density (diffusely infiltrated area) have high optical attenuation (green). The corresponding histology, obtained en face (same orientation as the attenuation map), was provided for comparison. Scale bars, 100 μm.
Figure 4
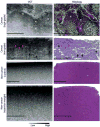
Figure 4. OCT revealed microscopic features that can help distinguish brain cancer versus non-cancer tissue in patients
Cross-sectional OCT images visualized tumor-specific characteristics, such as necrosis (N) and hypercellularity (H), in high-grade brain cancer. Similarly, OCT revealed microcyst formation (black arrows) and hypercellularity (red arrows) in low-grade brain cancer. In contrast, non-cancer white matter tissues—obtained from resected tissues from a seizure patient (control) and from the resection margin of a brain cancer patient—appeared homogeneous with high attenuation on OCT images. Scale bars, 500 μm.
Figure 5
Figure 5. In vivoIn vivo brain cancer imaging in a mouse with patient-derived high-grade brain cancer (GBM272)
(A and B) Brain tissues were imaged in vivo in mice (n = 5) undergoing brain cancer resection. After imaging, the mice were sacrificed and their brains were processed for histology. Here, we show the representative results of a mouse brain at the cancer site before surgery (A) and at the resection cavity after surgery (B). (C) Corresponding histology for the resection cavity after surgery was also shown. (D and E) With the same mouse, control images were imaged at a seemingly healthy area on the contralateral, left side of the brain (D), with its corresponding histology (E). The red circle indicates cancer, gray circle indicated resection cavity, and square was the OCT FOV. 2D optical property maps were displayed using an attenuation threshold of 5.5 mm−1. C, cancer; W, noncancer white matter; M, noncancer meninges. Aliasing artifacts at the image boundaries, which were produced when dorsal structures from outside the OCT depth were folded back into the image, were cropped out of image. 3D volumetric reconstructions were overlaid with optical property maps on the top surface. Optical attenuation properties were averaged for each sub volume of 0.326 mm × 0.008 mm × 1.8 mm within the tissue block, with a step size of 0.033 mm in the x direction. Each histological image (C and E) represented a cross-sectional view of the tissue block: the image corresponds to a single perpendicular slice through the attenuationmap, along the dotted lines in (B) and (D), respectively. Residual cancer cells were marked with black arrows and correspond to yellow/red regions on the attenuation maps (at the level of the dotted line). Scale bars, 0.2 mm.

References

    1. Lacroix M, Abi-Said D, Fourney DR, Gokaslan ZL, Shi W, DeMonte F, Lang FF, McCutcheon IE, Hassenbusch SJ, Holland E, Hess K, Michael C, Miller D, Sawaya R. A multivariate analysis of 416 patients with glioblastoma multiforme: prognosis, extent of resection, and survival. J Neurosurg. 2001;95:190–198. - PubMed
    1. Sanai N, Polley MY, McDermott MW, Parsa AT, Berger MS. An extent of resection threshold for newly diagnosed glioblastomas. J Neurosurg. 2011;115:3–8. - PubMed
    1. Keles GE, Lamborn KR, Berger MS. Low-grade hemispheric gliomas in adults: a critical review of extent of resection as a factor influencing outcome. J Neurosurg. 2001;95:735–745. - PubMed
    1. McGirt MJ, Chaichana KL, Gathinji M, Attenello FJ, Than K, Olivi A, Weingart JD, Brem H, Quinones-Hinojosa AR. Independent association of extent of resection with survival in patients with malignant brain astrocytoma. J Neurosurg. 2009;110:156–162. - PubMed
    1. McGirt MJ, Mukherjee D, Chaichana KL, Than KD, Weingart JD, Quinones-Hinojosa A. Association of surgically acquired motor and language deficits on overall survival after resection of glioblastoma multiforme. Neurosurgery. 2009;65:463–469. discussion 469-470. - PubMed

Publication types