. 2015 Aug;114(2):825-34.
doi: 10.1152/jn.00259.2015. Epub 2015 Jun 17.

Fidelity of frequency and phase entrainment of circuit-level spike activity during DBS

Affiliations

Fidelity of frequency and phase entrainment of circuit-level spike activity during DBS

Filippo Agnesi et al. J Neurophysiol. 2015 Aug.

Abstract

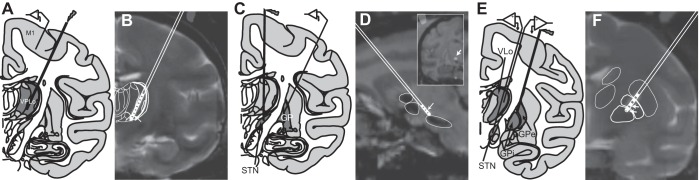
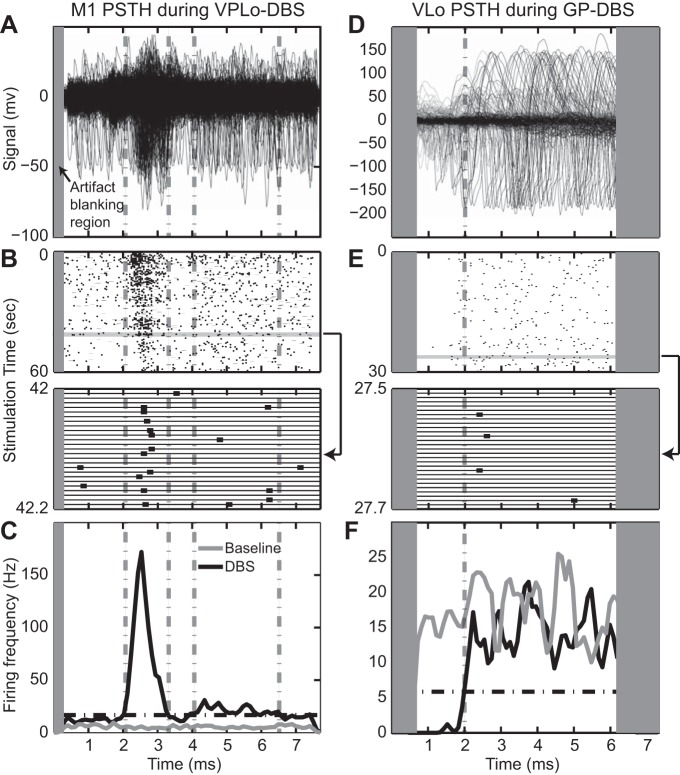
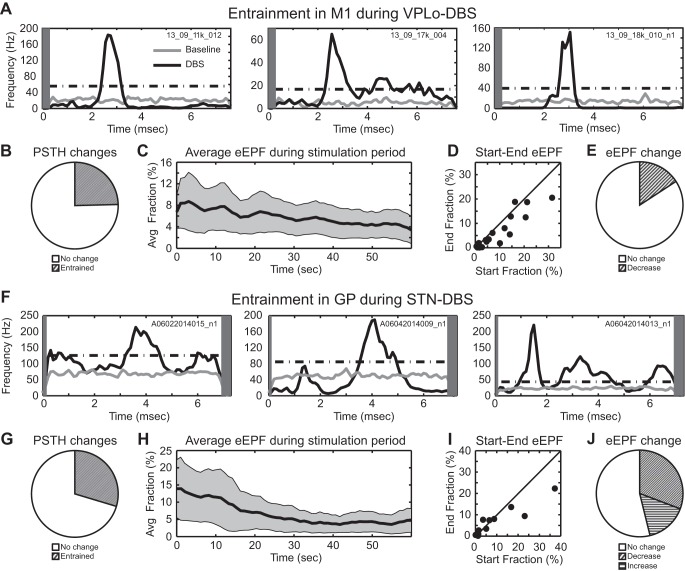
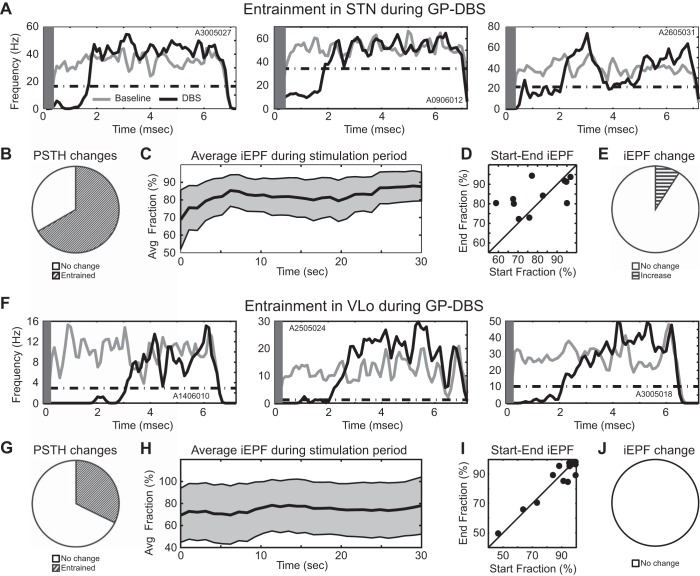
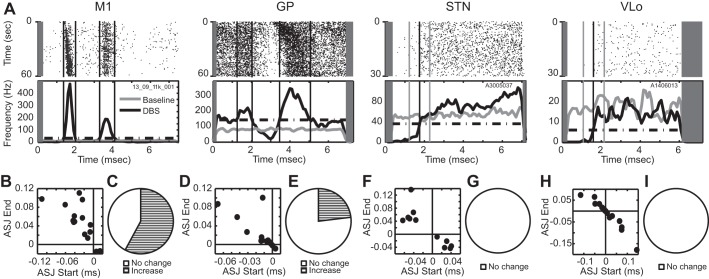
High-frequency stimulation is known to entrain spike activity downstream and upstream of several clinical deep brain stimulation (DBS) targets, including the cerebellar-receiving area of thalamus (VPLo), subthalamic nucleus (STN), and globus pallidus (GP). Less understood are the fidelity of entrainment to each stimulus pulse, whether entrainment patterns are stationary over time, and how responses differ among DBS targets. In this study, three rhesus macaques were implanted with a single DBS lead in VPLo, STN, or GP. Single-unit spike activity was recorded in the resting state in motor cortex during VPLo DBS, in GP during STN DBS, and in STN and pallidal-receiving area of motor thalamus (VLo) during GP DBS. VPLo DBS induced time-locked spike activity in 25% (n = 15/61) of motor cortex cells, with entrained cells following 7.5 ± 7.4% of delivered pulses. STN DBS entrained spike activity in 26% (n = 8/27) of GP cells, which yielded time-locked spike activity for 8.7 ± 8.4% of stimulus pulses. GP DBS entrained 67% (n = 14/21) of STN cells and 32% (n = 19/59) of VLo cells, which showed a higher fraction of pulses effectively inhibiting spike activity (82.0 ± 9.6% and 86.1 ± 16.6%, respectively). Latency of phase-locked spike activity increased over time in motor cortex (58%, VPLo DBS) and to a lesser extent in GP (25%, STN DBS). In contrast, the initial inhibitory phase observed in VLo and STN during GP DBS remained stable following stimulation onset. Together, these data suggest that circuit-level entrainment is low-pass filtered during high-frequency stimulation, most notably for glutamatergic pathways. Moreover, phase entrainment is not stationary or consistent at the circuit level for all DBS targets.

Keywords: deep brain stimulation; entrainment; globus pallidus; mechanisms; motor cortex; peri-stimulus time histogram; subthalamic nucleus; thalamus.


Figures

Fig. 1.
Fig. 1.
Experimental design used to investigate the fidelity of deep brain stimulation (DBS) entrainment. A: microelectrode recordings were performed in the motor cortex, while DBS was delivered in the cerebellar-receiving area of the thalamus (VPLo). B: overlap of preoperative MRI and postoperative CT (obtained using the stereotactic navigation software Monkey Cicerone) showing location of the DBS lead in monkey K. C: microelectrode recordings were performed in the globus pallidus (GP), while DBS was delivered in the subthalamic nucleus (STN). D: overlap of MRI/CT showing location of the DBS electrode in monkey F. Note the sagittal trajectory of the DBS lead implant in monkey F. Inset: MRI with CT overlay in the coronal plane at the level of the active electrode contact. E: microelectrode recordings were performed in the pallidal-receiving area of the thalamus (VLo) and in the STN during pallidal DBS. GPi, inhibitory GP; GPe, excitatory GP. F: MRI/CT overlap showing DBS lead positioning in monkey R.
Fig. 2.
Fig. 2.
Examples of phase-locked spike activity to high-frequency stimulation. Overlap of stimulus-triggered spike activity in an M1 cell during VPLo DBS (A) and VLo cell during GP DBS (D). Time zero on the x-axis coincides with delivery of each stimulus pulse. Gray rectangle represents the region of the interpulse interval blanked by the stimulation artifact template subtraction algorithm. B and E: corresponding raster for the entire interpulse interval (top) and for a 0.2-s subsection. Bottom: 2 cells are present in the recording; only the larger responded to DBS and was used to generate the spike rasters and peri-stimulus time histogram (PSTH) plots. C and F: PSTH of the entire recording, showing significance level (black dot-dash line) and phases of significant excitation or inhibition (gray dot-dash lines). Note that the PSTH bin width was 0.1 ms, and the spike frequency in the example PSTHs reflects this bin width.
Fig. 3.
Fig. 3.
Excitatory entrainment during VPLo DBS and STN DBS. Example PSTHs of M1 cells during VPLo DBS (A) and GP cells during STN DBS (F). Gray rectangle represents the region of the interpulse interval that was blanked during stimulus artifact template subtraction. Fraction of M1 cells (B) and GP cells (E) showing significant entrainment to DBS. Average excitatory effective pulse fraction (eEPF) in M1 (C) and GP (H) as a function of time (mean ± 2 SE). D and I: comparison of the eEPF measured in the initial and in the final 30 s of each 1-min stimulation trial. E and J: fraction of excitatory interpulse interval phases whose eEPF significantly changed during DBS.
Fig. 4.
Fig. 4.
Inhibitory entrainment during GP DBS. Example PSTHs of STN cells (A) and VLo cells (F) during GP DBS. Gray rectangle represents the region of the interpulse interval that was blanked during stimulus artifact template subtraction. Fraction of STN cells (B) and VLo cells (E) showing significant entrainment to DBS. Average inhibitory EPF (iEPF) in STN (C) and VLo (H) as a function of time (mean ± 2 SE). D and I: comparison of the iEPF measured in the initial and in the final 15 s of each 30-s stimulation trial. E and J: fraction of inhibitory interpulse interval phases whose iEPF significantly changed during DBS.
Fig. 5.
Fig. 5.
Temporal fidelity of phase entrainment to DBS. A: examples of entrainment in the 4 recorded nuclei with raster plots (top) and corresponding PSTHs (bottom). Gray rectangle represents the region of the interpulse period blanked during template subtraction. Average signed jitter (ASJ) at the beginning and end of stimulation for all significant excitatory phases in M1 (VPLo DBS) (B), GP (STN DBS) (D), STN (GP DBS) (F), and VLo (GP DBS) (H). Fraction of excitatory phases in M1 (C), GP (E), STN (G), and VLo (I), in which the phase-locked spike delay statistically changed over the stimulation period.

References

    1. Abbott LF, Varela JA, Sen K, Nelson SB. Synaptic depression and cortical gain control. Science 275: 220–224, 1997. - PubMed
    1. Agnesi F, Connolly AT, Baker KB, Vitek JL, Johnson MD. Deep brain stimulation imposes complex informational lesions. PLoS One 8: e74462, 2013. - PMC - PubMed
    1. Anderson M, Postupna N, Ruffo M. Effects of high-frequency stimulation in the internal globus pallidus on the activity of thalamic neurons in the awake monkey. J Neurophysiol 89: 1150–1160, 2003. - PubMed
    1. Anderson TR, Hu B, Iremonger K, Kiss ZH. Selective attenuation of afferent synaptic transmission as a mechanism of thalamic deep brain stimulation-induced tremor arrest. J Neurosci 26: 841–850, 2006. - PMC - PubMed
    1. Bellinger SC, Miyazawa G, Steinmetz PN. Submyelin potassium accumulation may functionally block subsets of local axons during deep brain stimulation: a modeling study. J Neural Eng 5: 263–274, 2008. - PubMed

Publication types