. 2015 Sep;114(3):1438-54.
doi: 10.1152/jn.00276.2015. Epub 2015 Jun 17.

Eye-hand coordination during a double-step task: evidence for a common stochastic accumulator

Affiliations

Eye-hand coordination during a double-step task: evidence for a common stochastic accumulator

Atul Gopal et al. J Neurophysiol. 2015 Sep.

Abstract

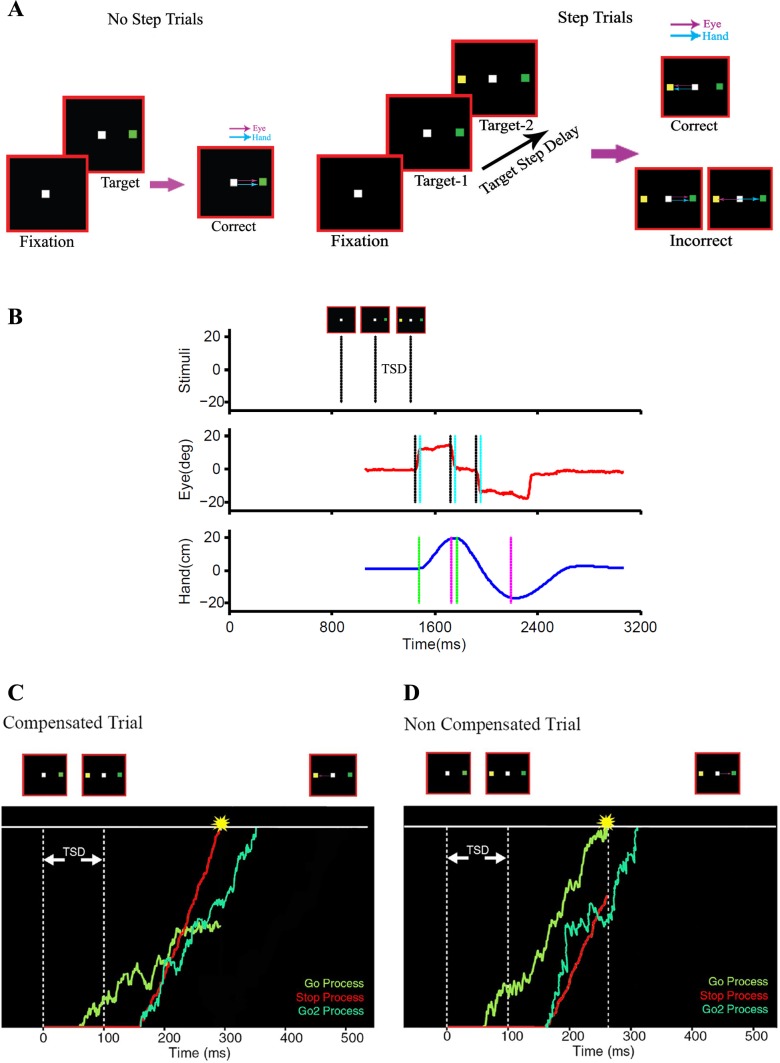
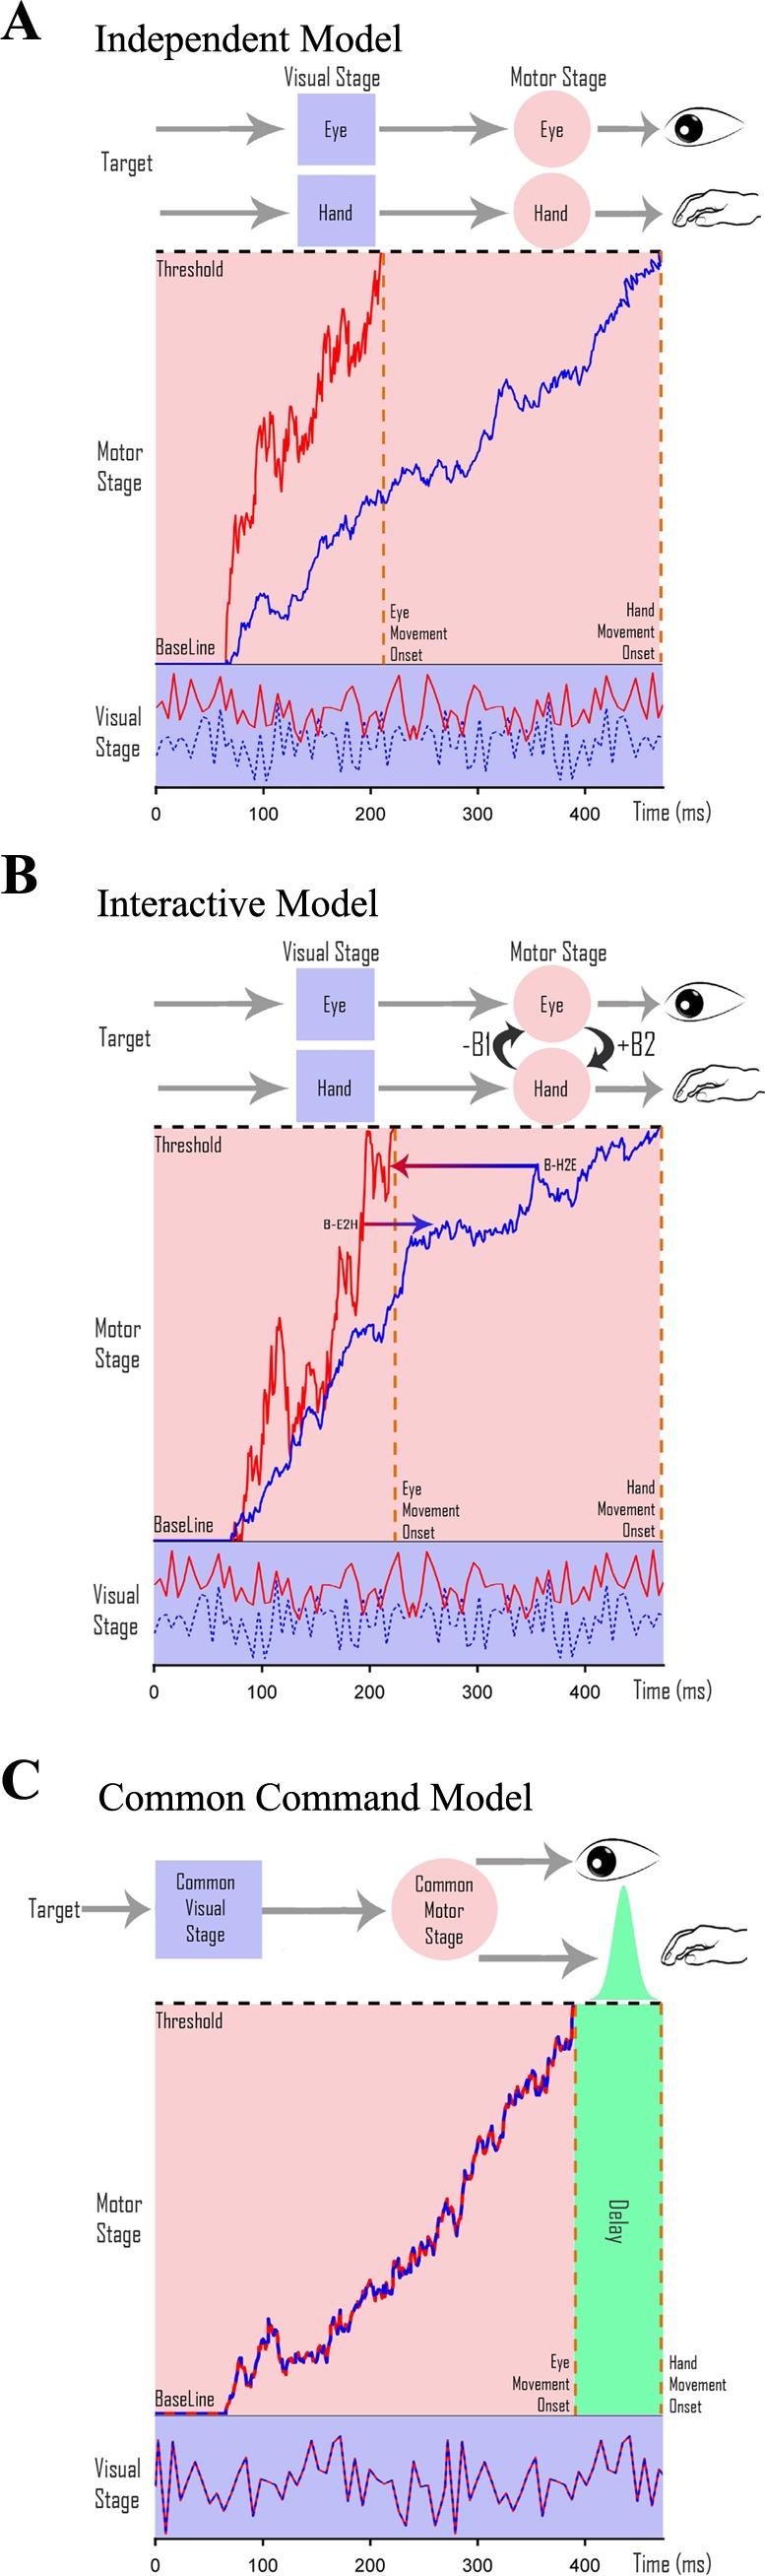
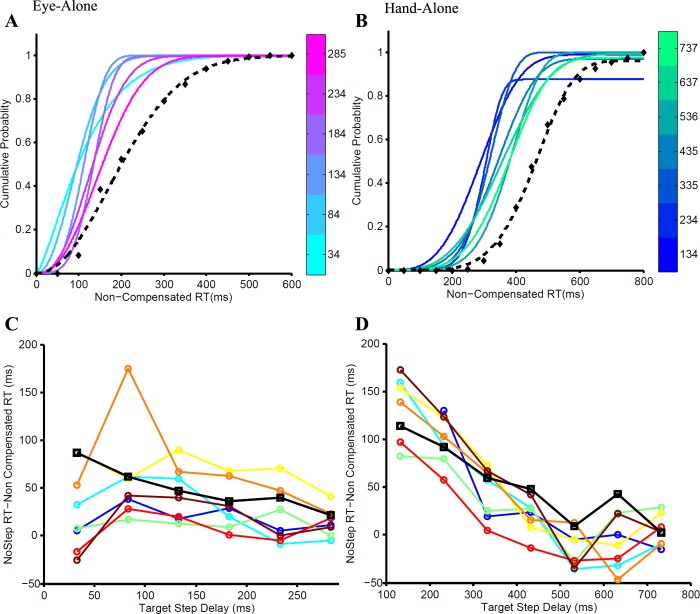
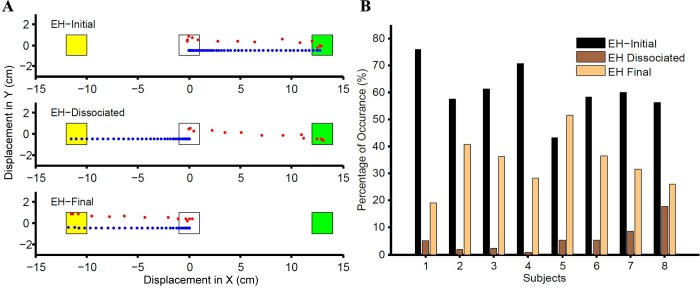
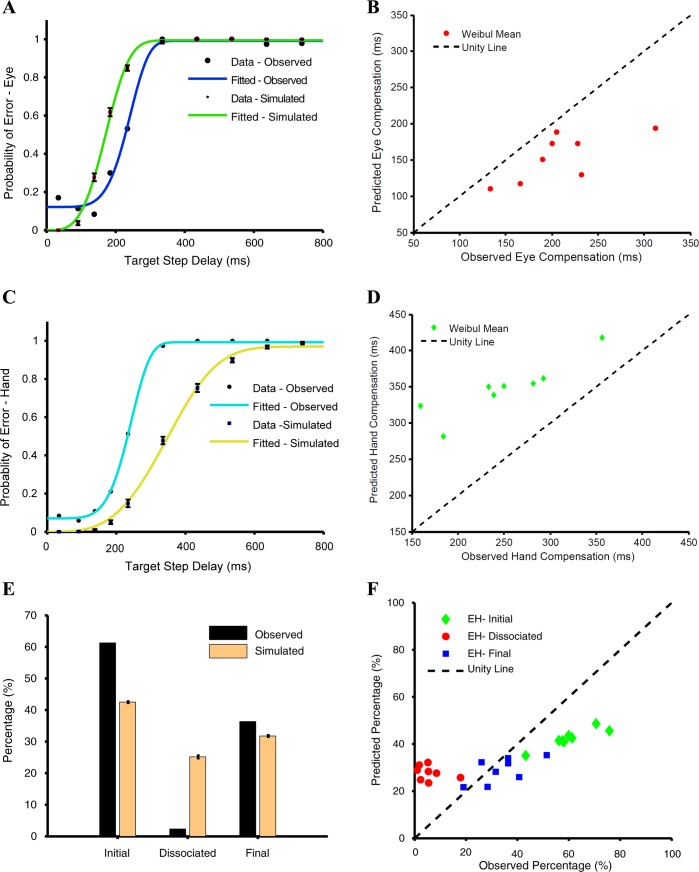
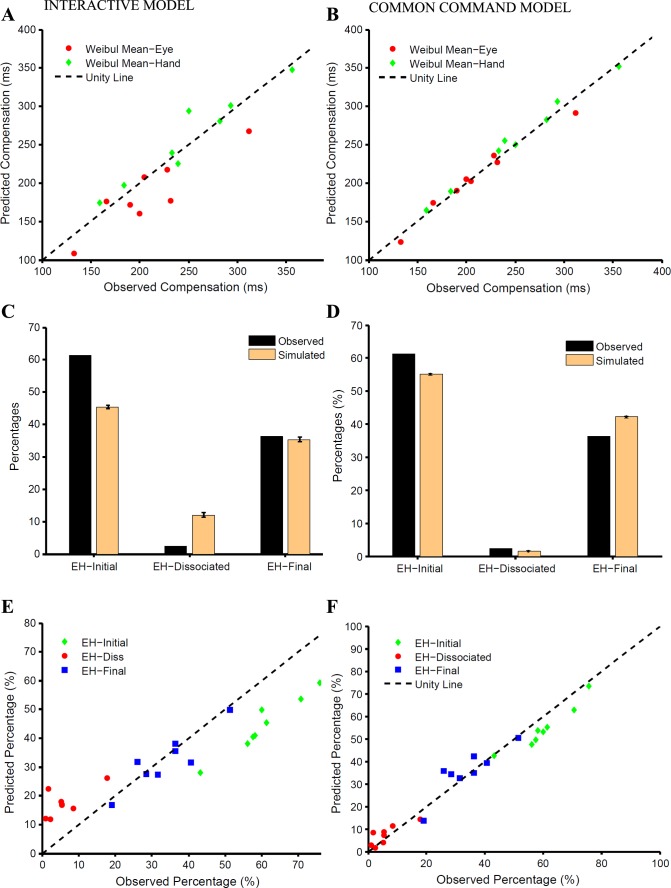
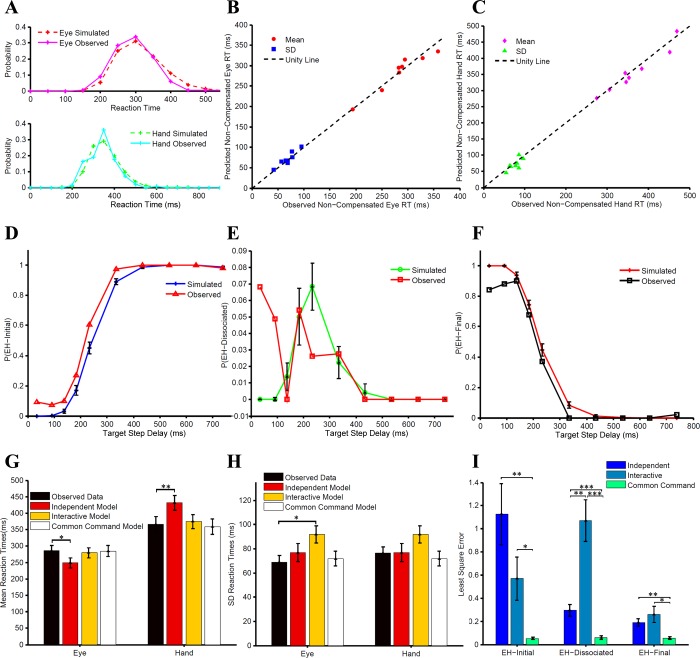
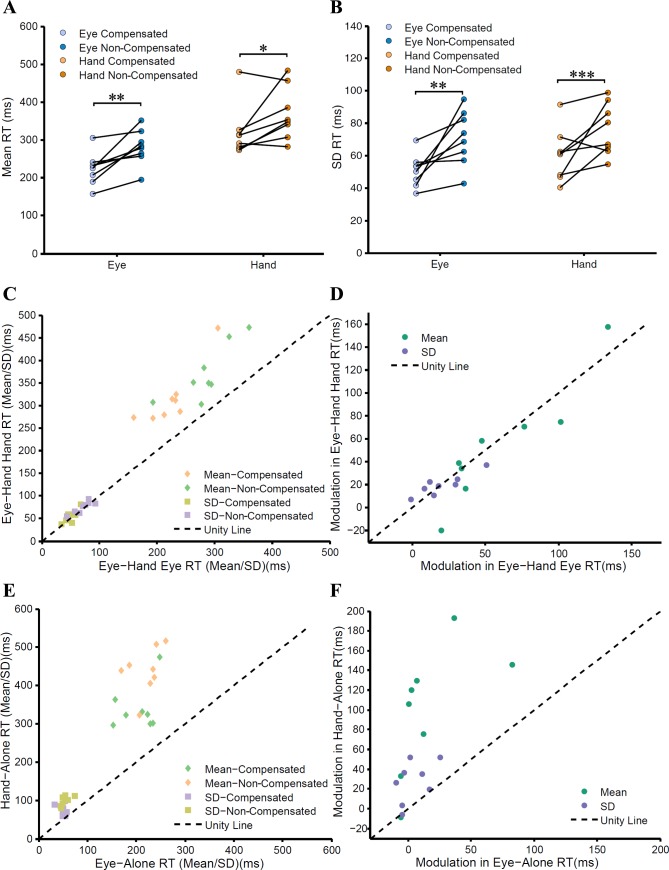
Many studies of reaching and pointing have shown significant spatial and temporal correlations between eye and hand movements. Nevertheless, it remains unclear whether these correlations are incidental, arising from common inputs (independent model); whether these correlations represent an interaction between otherwise independent eye and hand systems (interactive model); or whether these correlations arise from a single dedicated eye-hand system (common command model). Subjects were instructed to redirect gaze and pointing movements in a double-step task in an attempt to decouple eye-hand movements and causally distinguish between the three architectures. We used a drift-diffusion framework in the context of a race model, which has been previously used to explain redirect behavior for eye and hand movements separately, to predict the pattern of eye-hand decoupling. We found that the common command architecture could best explain the observed frequency of different eye and hand response patterns to the target step. A common stochastic accumulator for eye-hand coordination also predicts comparable variances, despite significant difference in the means of the eye and hand reaction time (RT) distributions, which we tested. Consistent with this prediction, we observed that the variances of the eye and hand RTs were similar, despite much larger hand RTs (∼90 ms). Moreover, changes in mean eye RTs, which also increased eye RT variance, produced a similar increase in mean and variance of the associated hand RT. Taken together, these data suggest that a dedicated circuit underlies coordinated eye-hand planning.

Keywords: drift diffusion; eye-hand coordination; race model; reaction time.


Figures

Fig. 1.
Fig. 1.
The task. A: in a no-step trial, subjects were instructed to make a saccade, pointing movement, or both to targets that could appear 12° on either side of fixation in an eye-alone, hand-alone, and eye-hand condition, respectively. In a step trial, a second yellow target appeared in the opposite hemifield after a target step delay (TSD). Examples of the different responses are shown for both no-step and step trials. B: temporal sequence of events in a typical noncompensated step trial: the sequence of stimuli (top) and the successive eye (middle) and hand positions (bottom) are shown. The eye and hand initially respond to the green target and are then redirected to the second yellow target, which is shown in the form of displacement (top). The start and end of the saccade (middle) are marked by black and cyan lines, respectively, and those of the hand movement (bottom) are indicated by green and magenta lines, respectively. C and D: schematics of the race model architecture are shown in which a GO process (green) after the initial target onset and a STOP process (red) after the second target onset rise to a common threshold following a constant visual delay. The two processes are modeled as stochastic accumulators. The outcome of the race determines the behavioral outcome in a step trial. A GO2 process (light green) is also initiated along with the STOP process and redirects the response to the second target. C: a compensated step trial in which the STOP process wins the race, thereby inhibiting the response to the initial target. The GO2 process produces a correct response directed to the second target. D: a noncompensated trial in which the GO process wins the race, resulting in an overt response to the initial target.
Fig. 2.
Fig. 2.
Architecture of eye-hand coordination. A–C: schematics of the 3 different architectures that generate coordinated eye-hand movements. [Adapted from Gopal et al. (2015).] A possible architecture is schematized with a separate visual stage (purple squares), where the targets get encoded, and a motor planning stage (pink circles). Thick red (eye) and dashed blue (hand) traces represent separate stochastic signals that are integrated over time to reach a threshold indicated by the dashed black line. Each movement is executed as soon as the respective accumulator reaches threshold. A: an independent model in which eye and hand effectors have completely distinct and separate visual and motor planning stages but are passively coordinated by the common target. B: an interactive model comprising independent eye and hand networks that interact (black arrows) at the level of motor preparation. C: a common command model, which is thought to have a common visual and motor planning stage. The dashed red-blue trace represents the common stochastic sensory signal that is integrated over time to reach threshold. Saccades are executed as soon as the common signal reaches threshold, whereas hand movements are executed after a temporal delay with Gaussian jitter (green).
Fig. 3.
Fig. 3.
Validating the race model framework. The fanning effect is the progressive shift of the cumulative distributions of noncompensated reaction times (RTs) at each TSD (graded colors) toward the cumulative no-step RT distribution (dashed black line). A: fanning effect for the eye-alone condition in which TSDs ranging from 34 to 285 ms in steps of 50 ms are shown as graded colors from cyan to magenta. B: fanning effect for the hand-alone condition in which TSDs ranging from 134 to 737 ms in steps of 100 ms are shown as graded colors from blue to green. The fanning effect is quantified as the difference between the median no-step RT and the median of the noncompensated trials at each TSD. This difference decreases with increasing TSD, as shown across subjects (separate colors) for the eye-alone (C) and hand-alone (D) conditions.
Fig. 4.
Fig. 4.
Extending the race model frame work for eye-hand coordination. A: representative trials for 3 different observed behavioral responses. The central fixation spot, initial target (green), and final target (yellow) are shown, along with the eye (red) and hand (blue) trajectories. In an EH-initial trial (top), both eye and hand are directed to the initial target. In an EH-dissociated trial (middle), the eye is directed to the initial target while the hand is directed to the final target. In an EH-final trial (bottom), both eye and hand are directed to the final target. B: the frequency with which the 3 different trial types (EH-initial, black; EH-dissociated, dark brown; EH-final, light brown) occur in the observed data across population is shown separately for each subject.
Fig. 5.
Fig. 5.
Validating the independent model. A: comparison between the predicted (green) and observed (blue) compensation function fitted using a cumulative Weibull function for the eye. The data points (large symbols) constituting the fit are also plotted. The predicted (small) data points along with their 95% confidence interval (bars) are shown for reference. B: scatter plot of the Weibull means calculated separately from the observed and predicted compensation functions of the eye. Data points are below the unity line (dashed black), suggesting underestimation by the model. C: comparison between the predicted (light green) and observed (cyan) compensation functions fitted using a cumulative Weibull function for the hand. The data points (black circles) observed are also plotted. The predicted (black squares) data points along with their 95% confidence interval (bars) are also shown for reference. D: scatter plot of the Weibull means calculated separately from the observed and predicted compensation functions of the hand. Data points are above the unity line (dashed black), suggesting overestimation by the model. E: predicted (orange) and observed (black) frequencies of EH-initial, EH-dissociated, and EH-final trials for a typical subject. F: scatter plot showing relationship between the predicted and observed frequencies of EH-initial (green), EH-dissociated (red), and EH-final (blue) trials across subjects. The unity line (dashed black) is shown for reference.
Fig. 6.
Fig. 6.
Comparison between the interactive and common command models. A and B: scatter plots of Weibull means calculated separately from the observed and predicted compensation functions of the eye (red) and hand (green) for the interactive (A) and common command (B) models. C and D: predicted (orange) and observed (black) frequencies of EH-initial, EH-dissociated, and EH-final trials for a typical subject for the interactive (C) and common command (D) models. E and F: scatter plot showing relationship between the predicted and observed frequencies of EH-initial (green), EH-dissociated (red), and EH-final (blue) trials across subjects for the interactive (E) and common command (F) models. The unity line (dashed black) is shown for reference.
Fig. 7.
Fig. 7.
Testing the common command model. A: comparison between the predicted (dashed red) and observed (magenta) RT distributions of noncompensated trials for the eye in a typical subject (top) and similar comparison between the predicted (dashed green) and observed (cyan) RT for the hand (bottom). B: scatter plot of the means (red circles) and SDs (blue squares) between observed and predicted RT distributions of noncompensated trials for the eye across subjects. The data points are close to the unity line (dashed black), suggesting the validity of the model. C: scatter plot of the means (pink diamonds) and SDs (green triangles) between observed and predicted RT distributions of noncompensated trials for the hand across subjects. The data points are close to the unity line (dashed black), suggesting the validity of the model. D: probability of EH-initial trials as a function of TSD that is observed (red) and predicted (blue) by the model. E: probability of EH-dissociated trials as a function of TSD that is observed (red) from the data and predicted (green) by the model. F: probability of EH-final trials as a function of TSD that is observed (black) from the data and predicted (red) by the model. G and H: comparisons of the observed and predicted means (G) and SDs (H) of the noncompensated RT distributions of eye and hand predicted by the 3 models. I: comparison of the least square error between the predicted and the observed relationship of frequency of trial types with TSDs. *P <0.05; **P < 0.01; ***P < 0.001.
Fig. 8.
Fig. 8.
Testing the predictions of the common command model. A and B: means (A) and SDs (B) of the RT distributions of the eye (blue) and hand (orange) during compensated (light colors) and noncompensated trials (dark colors). Data from the same subjects are denoted by connecting black lines. C: scatter plot showing relationship between the means (diamonds) and SDs (squares) of the eye and hand RTs during compensated and noncompensated trials for the eye-hand condition. The unity line (black dashed line) shows that the means of the hand RTs are greater than those of the eye RTs, whereas the SDs are comparable. D: change in mean (green) and SD (violet) of the RT distributions between compensated and noncompensated conditions in the eye plotted against changes in the corresponding mean and SD of hand RT distributions across the same conditions. The data points follow the unity line, indicating that the extent of change in eye and hand effectors is comparable and well correlated for the eye-hand condition. E: in contrast, during the alone condition, the means (diamonds) and SDs (squares) of the hand RTs are greater than those of the eye RTs, and their corresponding changes are not comparable (F). *P <0.05; **P < 0.01; ***P < 0.001.

Similar articles

Cited by

References

    1. Aslin RN, Shea SL. The amplitude and angle of saccades to double-step target displacements. Vision Res 27: 1925–1942, 1987. - PubMed
    1. Becker W, Jürgens R. An analysis of the saccadic system by means of double step stimuli. Vision Res 19: 967–983, 1979. - PubMed
    1. Bekkering H, Adam JJ, Kingma H, Huson A, Whiting H. Reaction time latencies of eye and hand movements in single-and dual-task conditions. Exp Brain Res 97: 471–476, 1994. - PubMed
    1. Biguer B, Jeannerod M, Prablanc C. The coordination of eye, head, and arm movements during reaching at a single visual target. Exp Brain Res 46: 301–304, 1982. - PubMed
    1. Bizzi E, Kalil RE, Tagliasco V. Eye-head coordination in monkeys: evidence for centrally patterned organization. Science 173: 452–454, 1971. - PubMed

Publication types

LinkOut - more resources