. 2015 Aug;114(2):1196-210.
doi: 10.1152/jn.00745.2014. Epub 2015 Jun 17.

Postactivation depression of the Ia EPSP in motoneurons is reduced in both the G127X SOD1 model of amyotrophic lateral sclerosis and in aged mice

Affiliations

Postactivation depression of the Ia EPSP in motoneurons is reduced in both the G127X SOD1 model of amyotrophic lateral sclerosis and in aged mice

A Hedegaard et al. J Neurophysiol. 2015 Aug.

Abstract

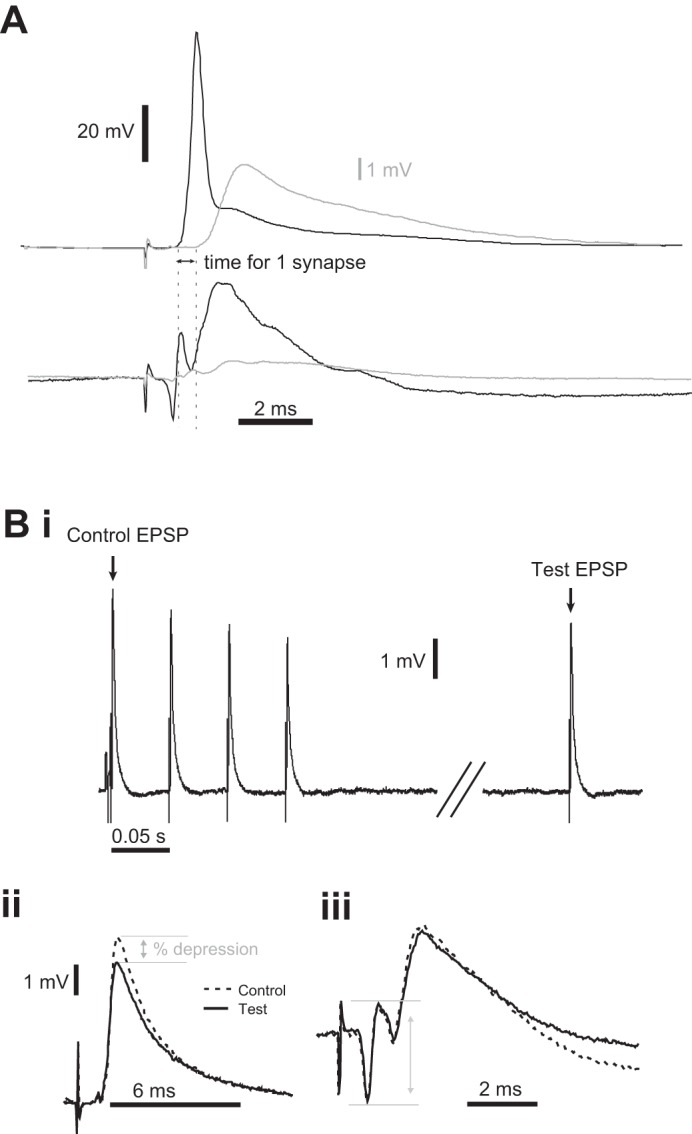
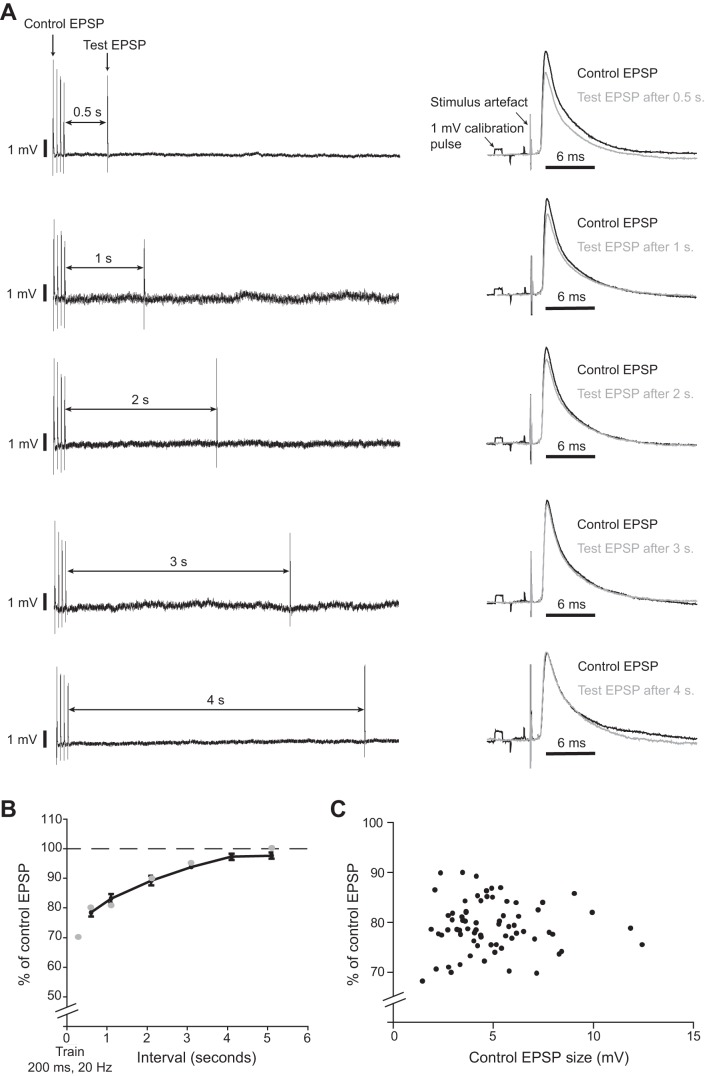
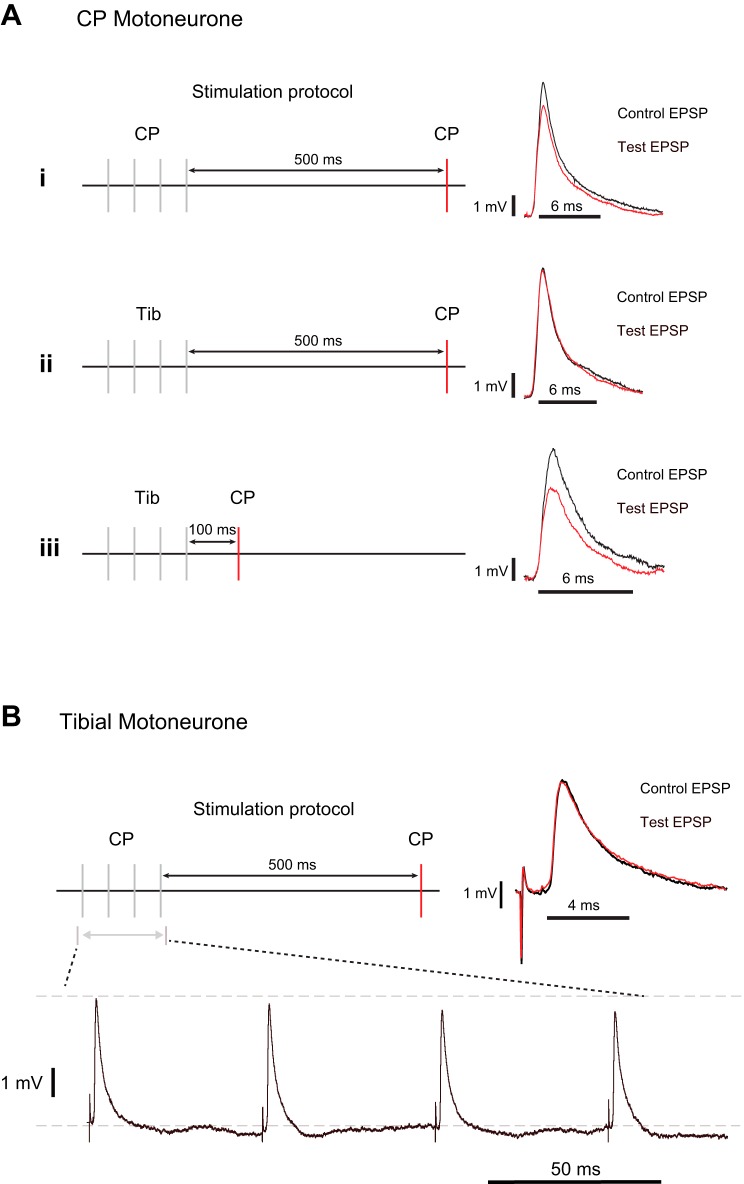
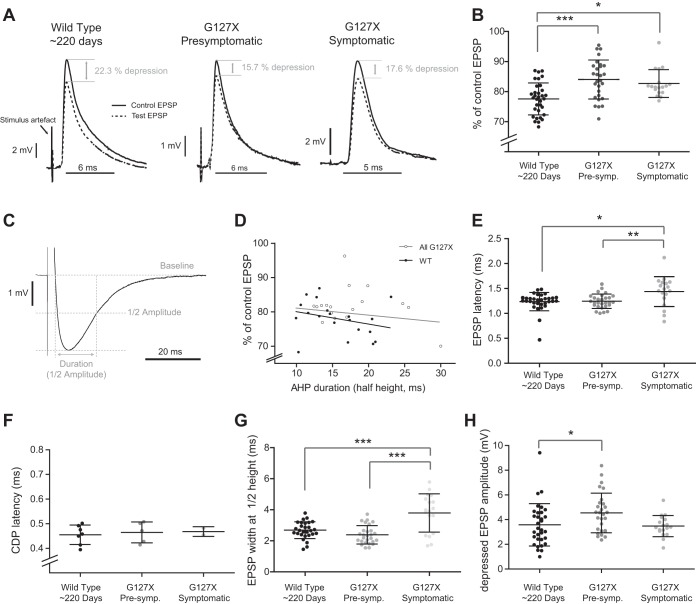
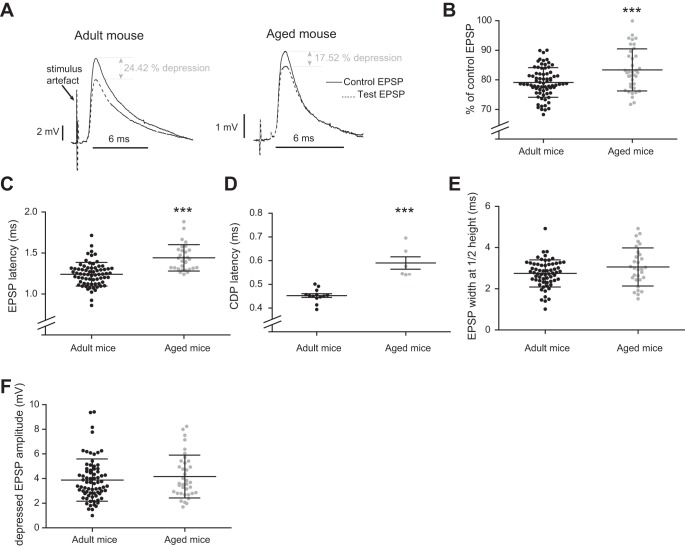
Postactivation depression (PActD) of Ia afferent excitatory postsynaptic potentials (EPSPs) in spinal motoneurons results in a long-lasting depression of the stretch reflex. This phenomenon (PActD) is of clinical interest as it has been shown to be reduced in a number of spastic disorders. Using in vivo intracellular recordings of Ia EPSPs in adult mice, we demonstrate that PActD in adult (100-220 days old) C57BL/6J mice is both qualitatively and quantitatively similar to that which has been observed in larger animals with respect to both the magnitude (with ∼20% depression of EPSPs at 0.5 ms after a train of stimuli) and the time course (returning to almost normal amplitudes by 5 ms after the train). This validates the use of mouse models to study PActD. Changes in such excitatory inputs to spinal motoneurons may have important implications for hyperreflexia and/or glutamate-induced excitotoxicity in the neurodegenerative disease amyotrophic lateral sclerosis (ALS). With the use of the G127X SOD1 mutant mouse, an ALS model with a prolonged asymptomatic phase and fulminant symptom onset, we observed that PActD is significantly reduced at both presymptomatic (16% depression) and symptomatic (17.3% depression) time points compared with aged-matched controls (22.4% depression). The PActD reduction was not markedly altered by symptom onset. Comparing these PActD changes at the EPSP with the known effect of the depression on the monosynaptic reflex, we conclude that this is likely to have a much larger effect on the reflex itself (a 20-40% difference). Nevertheless, it should also be accounted that in aged (580 day old) C57BL/6J mice there was also a reduction in PActD although, aging is not usually associated with spasticity.

Keywords: ALS; aging; postactivation depression.


Figures

Fig. 1.
Fig. 1.
Antidromic identification of motoneurons and recording of the Ia monosynaptic excitatory postsynaptic potential (EPSP). A, top trace: intracellular recording of the antidromic spike (in black) following stimulation of the peripheral nerve. The lower threshold Ia monosynaptic EPSP (in grey, see corresponding grey and black scale bars for size) is visible when the stimulus intensity is reduced to a threshold where only the Ia afferents are activated. A, bottom trace: corresponding cord dorsum potentials (CDPs) at the 2 different stimulus strengths. The monosynaptic nature of the EPSP can be confirmed by comparing the latency of the signal with the timing of the incoming volley arriving at the dorsal spinal cord, which is indicated with the dashed lines. B: experimental protocol for intracellular recording of postactivation depression (PActD). Bi: stimulation protocol used to measure PActD with a conditioning 20-Hz train of 4 pulses, where the 1st resulting EPSP is referred to as the control EPSP, followed by a variable gap and then the test EPSP. Bii: control EPSP (dashed line) and test EPSP (full line) are superimposed so that the magnitude of PActD can be seen. The magnitude is expressed as the size of the test EPSP as a percentage of the control EPSP. Biii: CDPs corresponding to the control EPSP stimulation (dashed line) and the test EPSP stimulation (full line) are superimposed. The grey lines indicate the amplitude of the incoming volley confirming no change.
Fig. 2.
Fig. 2.
Magnitude and time course of PActD in wild-type mice. A, left: illustration of the protocol with the conditioning trains (4 EPSPs at 20 Hz) and the varying time interval until activation of the test EPSP. A, right: test EPSPs (grey) are superimposed together with the control EPSP (black) for each time interval. In this example the size of the test EPSP gradually returns to 100% of the control EPSP over the course of 4 s. B: mean time course (with SE) of PActD in mice (black, connected dots, n = 12). The dashed line represents the size of the test EPSP having returned to 100% of the conditioning EPSP. The grey dots indicate data points obtained in cat, illustrated in Hultborn et al. (1996). This comparison shows that the magnitude and time course is similar between mice and cat. C: magnitude of PActD (expressed as a percentage of the control EPSP size) plotted with respect to the size of the initial control EPSP. From this it can clearly be seen that initial control EPSP size has no effect on the amount of PActD.
Fig. 3.
Fig. 3.
Postactivation depression effect is restricted to homonymous (previously activated) synapses. A. in a recording from a common peroneal (CP) motoneuron stimulation of the tibial nerve evoked monosynaptic EPSPs in the motoneuron. As in larger animals the PActD effect appears to be restricted to the homonymous nerve. Stimulation protocols are described at left and the resulting PActD is shown at right (control EPSP in black, test EPSP in red). Ai: clear depression of the test CP Ia EPSP is elicited by stimulation of the CP nerve if the conditioning volley used was from the CP nerve. Aii: If the conditioning volley of EPSPs was elicited by the stimulation of the tibial nerve, no depression of the test CP EPSP could be observed. In this case the control CP EPSP was obtained from alternate trials in which no conditioning train was given. Aiii: if the CP test pulse is given 100 ms after the conditioning volley elicited by the tibial nerve, then the test CP Ia EPSP is depressed consistent with the shorter lasting presynaptic inhibition. In this case the control CP EPSP was obtained from alternate trials in which no conditioning volley was given. B: example from a tibial motoneuron where both the train of EPSPs and the test EPSP is from the heteronymous CP nerve. In this case the test pulse at 0.5 s after the train is not depressed (top trace, right), yet a brief depression during the train (consistent with presynaptic inhibition) is still observed (bottom trace).
Fig. 4.
Fig. 4.
Postactivation depression in mice with amyotrophic lateral sclerosis. A: examples (representative of the means) of superimposed control and test EPSPs from the aged matched wild-type (left) and the presymptomatic (middle) and symptomatic (right) G127X groups, showing how the PActD is decreased on average in the G127X mice. B: scatterplot showing the mean magnitude of PActD (with SD) for the 3 groups (wild type, presymptomatic, and symptomatic) mice tested. The magnitude is expressed as the size of the test EPSP as a percentage of the control EPSP. The horizontal spread of data points reflects values close to each other. The vertical range of the data points indicates the spread of PActD magnitude within each group. From this a significant reduction in PActD can be observed in both the presymptomatic and symptomatic G127X mice. C: measurement of the postspike afterhyperpolarization (AHP). Dashed lines are used to show how the AHP duration and size was calculated. The duration of the AHP was measured at half height, as the return to baseline was not always easy to detect. D: plot of the magnitude of PActD (in terms of the size of the test EPSP expressed as a percentage of the size of the control EPSP) with respect to AHP duration measured in ms for the WT (black dots) and G127X (both groups, open dots) motoneurons. Linear regression analysis revealed that there is no relationship between the magnitude of PActD and AHP duration, as can be appreciated from the spread of the data points. Therefore, no motoneuron subtype specific difference in the reduction of PActD can be observed in the G127X mice. E: scatterplot showing the mean latency of the EPSP (measured from the stimulus artifact) with the SD for wild-type and G127X mice. There is no significant difference between wild-type and presymptomatic G127X mice but a slight increase in symptomatic G127X mice. F: scatterplot showing the mean latency of the incoming volley recorded at the spinal cord (measured from the stimulus artifact) with the standard deviation for wild-type and G127X mice. There are no significant differences between the groups. G: Scatterplot showing the mean width of the EPSP (measured at half height) with the SD for wild-type and G127X mice. There is no change in the results obtained from the presymptomatic group when compared with wild type, but a significant widening of the EPSPs at the symptomatic stage can be observed. H: scatterplot showing the mean amplitude (with SD) of the depressed EPSP at the 0.5-s interval after the stimulus train. There is a slight but significant increase in the EPSP amplitude in the presymptomatic G127X mice but not in the symptomatic mice. *P ≤ 0.05, **P ≤ 0.001, and ***P ≤ 0.001.
Fig. 5.
Fig. 5.
PActD at different ages in wild-type mice. A: examples representative of the means values for the 2 groups illustrating how the magnitude of depression is reduced in the aged mice. B: scatterplot showing the mean magnitude (with SD) of PActD for the 2 age groups of wild-type mice tested. The magnitude is expressed as the size of the test EPSP as a percentage of the control EPSP. The horizontal spread of data points reflects values close to each other. The vertical range of the data points indicates the spread of PActD magnitude within each group. The mean for the ∼580-day-old mice is significantly higher, indicating a reduction in PActD. C: scatterplot showing the mean latency of the EPSP measured from the stimulus artifact (with the SD) for adult and aged mice. There is a significant difference between the 2 groups. D: scatterplot showing the mean latency of the incoming volley recorded at the spinal cord measured from the stimulus artifact (with the SD) for adult and aged mice. There is a significant difference between the 2 groups, confirming that the delay seen in Fig. 4C is due to a reduction in conduction velocity of the Ia afferents in aged mice. E: scatterplot showing the mean width of the EPSP (measured at half height) with the standard deviation for adult and aged mice. There is a trend for the EPSPs to be slightly wider in aged mice. F: scatterplot showing the mean amplitude (with SD) of the depressed EPSP at the 0.5-s interval after the stimulus train. From here it can be seen that there is no change in amplitude between adult and aged mice. ***P ≤ 0.001.

Similar articles

Cited by

References

    1. Achache V, Roche N, Lamy JC, Boakye M, Lackmy A, Gastal A, Quentin V, Katz R. Transmission within several spinal pathways in adults with cerebral palsy. Brain 133: 1470–1483, 2010. - PubMed
    1. Andersson M, Hanse E. Astrocytes impose postburst depression of release probability at hippocampal glutamate synapses. J Neurosci 30: 5776–5780, 2010. - PMC - PubMed
    1. Andersson MS, Hanse E. Astrocyte-mediated short-term synaptic depression in the rat hippocampal CA1 area: two modes of decreasing release probability. BMC Neurosci 12: 87, 2011. - PMC - PubMed
    1. Aymard C, Katz R, Lafitte C, Lo E, Penicaud A, Pradat-Diehl P, Raoul S. Presynaptic inhibition and homosynaptic depression: a comparison between lower and upper limbs in normal human subjects and patients with hemiplegia. Brain 123: 1688–1702, 2000. - PubMed
    1. Bendotti C, Tortarolo M, Suchak SK, Calvaresi N, Carvelli L, Bastone A, Rizzi M, Rattray M, Mennini T. Transgenic SOD1 G93A mice develop reduced GLT-1 in spinal cord without alterations in cerebrospinal fluid glutamate levels. J Neurochem 79: 737–746, 2001. - PubMed

Publication types

LinkOut - more resources