. 2015 Aug 1;309(3):F189-203.
doi: 10.1152/ajprenal.00476.2014. Epub 2015 Jun 17.

AT1R blockade in adverse milieus: role of SMRT and corepressor complexes

Affiliations

AT1R blockade in adverse milieus: role of SMRT and corepressor complexes

Tejinder Singh et al. Am J Physiol Renal Physiol. .

Abstract

ANG II type 1 receptor blockade (AT1R-BLK) is used extensively to slow down the progression of proteinuric kidney diseases. We hypothesized that AT1R-BLK provides podocyte protection through regulation of silencing mediator of retinoic acid and thyroid hormone receptor (SMRT) and vitamin D receptor (VDR) expression under adverse milieus such as high glucose and human immunodeficiency virus infection. Both AT1R-BLK and VDR agonists (VDAs) stimulated VDR complex formation that differed not only in their composition but also in their functionality. AT1R-BLK-induced VDR complexes contained predominantly unliganded VDR, SMRT, and phosphorylated histone deacetylase 3, whereas VDA-VDR complexes were constituted by liganded VDR and CREB-binding protein/p300. AT1R-BLK-induced complexes attenuated podocyte acetyl-histone 3 levels as well as cytochrome P-450 family 24A1 expression, thus indicating their deacetylating and repressive properties. On the other hand, VDA-VDR complexes not only increased podocyte acetyl-histone 3 levels but also enhanced cytochrome P-450 family 24A1 expression, thus suggesting their acetylating and gene activation properties. AT1R-BLK- induced podocyte SMRT inhibited expression of the proapoptotic gene BAX through downregulation of Wip1 and phosphorylation of checkpoint kinase 2 in high-glucose milieu. Since SMRT-depleted podocytes lacked AT1R-BLK-mediated protection against DNA damage, it appears that SMRT is necessary for DNA repairs during AT1R-BLK. We conclude that AT1R-BLK provides podocyte protection in adverse milieus predominantly through SMRT expression and partly through unliganded VDR expression in 1,25(OH)2D-deficient states; on the other hand, AT1R-BLK contributes to liganded VDR expression in 1,25(OH)2D-sufficient states.

Keywords: angiotensin II; angiotensin II type 1 receptor blockade; glucose; silencing mediator of retinoic acid and thyroid hormone receptor; vitamin D receptor.


Figures

Fig. 1.
Fig. 1.
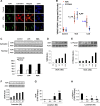
ANG II type 1 receptor (AT1R) blockade (AT1R-BLK) enhances podocyte vitamin D receptor (VDR) expression and downregulates cytochrome P-450 family 24A1 (CYP24A1) expression. A: human podocytes (HPs) were incubated in media containing either buffer, EB1089 [vitamin D agonist (VDA), 25 pM], or losartan (LOS; 10−7 M) for 24 h followed by colabeling for VDR and CYP24A1 (n = 3). Nuclei were labeled with 4′,6-diamidino-2-phenylindole (DAPI). Representative microfluorograms are shown. B: cumulative data (n = 3) of cells prepared for the protocol described in A (n = 3) are shown as a scattergram. Results are shown as means ± SD. *P < 0.05 compared with control; **P < 0.05 compared with LOS; ***P < 0.05 compared with control; #P < 0.05 compared with control; ##P < 0.05 compared with LOS. C: HPs were incubated in media containing either buffer, LOS (10−7 M), or EB1089 (VDA, 100 pM) for 48 h (n = 3). Subsequently, cells were harvested, and cytosolic and nuclear fractions were separated. Protein blots were probed for VDR and reprobed for actin. Gels are shown, and their densitometric data are shown as bar graphs. D: HPs were incubated in media containing variable concentrations of EB1089 (VDA, 0–10 nM) for 48 h. Protein blots were probed for VDR and reprobed for actin. Gels are shown, and densitometric data are shown in bar graphs. E: HPs were incubated in media containing variable concentrations of EB1089 (0–100 nM) for 48 h. Protein blots were probed for CYP24A1 and reprobed for actin. Gels along with densitometric data are shown. F: HPs were incubated in media containing variable concentrations of LOS (0 and 10−8–10−5 M) for 48 h. Protein blots were probed for VDR and reprobed for actin. Gels along with densitometric data are shown. G: HPs were incubated in media containing either buffer (0, control) or variable concentrations of LOS (10−8–10−6 M) for 24 h (n = 4). Subsequently, RNA was extracted, cDNA was amplified with VDR-specific primers, and mRNA expression was assayed by real-time PCR. *P < 0.05 compared with control and LOS (10−8 M); **P < 0.05 compared with other variables. H: HPs were incubated in media containing either buffer (0, control) or variable concentrations of LOS (10−8–10−6 M) for 24 h (n = 4). Subsequently, RNA was extracted, cDNA was amplified with CYP24A1-specific primers, and mRNA expression was quantified by real-time PCR. *P < 0.05 compared with control.
Fig. 2.
Fig. 2.
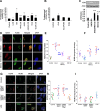
AT1R-BLK inhibits human immunodeficiency virus (HIV)-induced podocyte VDR downregulation. A: empty vector (control) or HIV-transduced HPs were incubated in media containing either buffer or LOS (10−7 M) for 48 h followed by labeling for VDR. Nuclei were stained with propidium iodide (PI; n = 3). Representative microfluorograms are shown. HIV downregulated podocyte VDR expression, whereas LOS enhanced podocyte VDR expression both under control and HIV-stimulated states. B: cumulative data of the protocol described in A (n = 3) are displayed in a scattergram. Results are shown as means ± SD. *P < 0.05 compared with control; **P < 0.05 compared with LOS; ***P < 0.05 compared with HIV/LOS; #P < 0.05 compared with control; ## P < 0.05 compared with HIV and LOS alone. C: HPs were incubated in media containing either buffer or high glucose (GLU) for 48 h followed by labeling for VDR (n = 3). Nuclei were stained with PI. Representative microfluorograms are shown. D: cumulative data of the protocol described in C (n = 3) are displayed in a scattergram. Results are shown as means ± SD. *P < 0.05 compared with control. E: HPs were incubated in media containing variable concentrations of ANG II (0 and 10−8–10−5 M) for 48 h. Protein blots were probed for VDR. The same blots were reprobed for actin. Gels are shown, and densitometric data are shown in bar graphs.
Fig. 3.
Fig. 3.
Podocyte CYP24A1 expression is inversely related to silencing mediator of retinoic acid and thyroid hormone receptor (SMRT) and unliganded VDR (VDR-UL). A: HPs were incubated in media containing variable concentrations of LOS (0 and 10−8–10−6M) for 48 h. Protein blots were probed for SMRT. The same blots were reprobed for CYP24A1 and actin. Gels along with densitometric data are shown. LOS enhanced podocyte expression of SMRT but decreased podocyte expression of CYP24A1. Densitometric analysis data are shown in bar graphs. B: HPs were transfected with VDR plasmid (VDR/HPs). Protein blots of control and VDR/HPs were probed for VDR, and the same blots were reprobed for CYP24A1 and actin (n = 4). Gels shown here displayed three observations only. Densitometric data are shown in bar graphs (n = 4). *P < 0.01 compared with the respective control; **P < 0.05 compared with the respective control. C: Control HPs and VDR/HPs were incubated in media containing either buffer or LOS (10−7 M) for 48 h (n = 4). Protein blots were probed for VDR. The same blots were probed for CYP24A1 and actin. Representative gels are shown, and cumulative densitometric data are shown in bar graphs. *P < 0.01 compared with control; **P < 0.05 compared with VDR/LOS. D: protein blots of empty vector (EV)-transduced HPs (EV/HPs; control) and HIV-transduced HPs (HIV/HPs) were probed for SMRT (n = 3). The same blots were reprobed for VDR, CYP24A1, and actin. Representative gels are shown, densitometric data are shown as bar graphs. *P < 0.05 compared with control (SMRT); **P < 0.05 compared with control (VDR); ***P < 0.05 compared with control (CYP24A1). E: HPs grown on coverslips were incubated in media containing either buffer (control), EB1089 (VDA, 100 pM), or LOS (10−7 M) for 48 h (n = 3). Subsequently, cells were colabeled for VDR and SMRT. Representative microfluorograms are shown. F: cumulative data (VDR/SMRT, integrated density) of the protocol described in E (n = 3) are shown in a scattergram. Results are presented as means ± SD. *P < 0.05 compared with control; **P < 0.05 compared with LOS; ***P < 0.05 compared with control; #P < 0.05 compared with control; ##P < 0.05 compared with VDA.
Fig. 4.
Fig. 4.
Both VDA and LOS enhance VDA expression but display a disparate effect on podocyte CYP24A1 expression in adverse milieus (AMs). A: HPs were incubated in media containing either buffer (containing 5 mM glucose), ANG II (10−8 M), or GLU (30 mM) with or without EB1089 (VDA, 100 pM) for 48 h (n = 5). Additionally, HIV/HPs were incubated with or without EB1089 (100 pM) for 48 h (n = 5). Protein blots were probed for VDR and reprobed for actin. Representative gels along with cumulative densitometric data are shown. *P < 0.005 compared with control; **P < 0.01 compared with ANG II; ***P < 0.04 compared with HIV; #P < 0.01 compared with GLU. B: HPs were incubated in media containing either buffer (with 5 mM glucose), ANG II (10−8 M), or GLU (30 mM) with or without LOS (10−7 M) for 48 h (n = 4–5). Additionally, HIV/HPs were incubated with or without LOS (10−7 M) for 48 h (n = 4–5). Protein blots were probed for VDR and reprobed for actin. Representative gels along with cumulative densitometric data are shown. *P < 0.05 vs. control; **P < 0.01 vs. ANG II; ***P < 0.01 vs. HIV; #P < 0.02 vs. GLU. C: HPs were incubated in media containing either buffer (with 5 mM glucose), ANG II (10−8 M) or GLU (30 mM) with or without LOS (10−7 M) (n = 3). Protein blots were probed for SMRT (C1) and reprobed for CYP24A1 (C2) and actin. Representative gels and cumulative densitometric analysis (bar graphs in C1 and C2) are shown. In C1, *P < 0.05 compared with control and **P < 0.05 compared with respective HIV alone, GLU alone, and ANG II alone; in C2, *P < 0.05 compared with control, **P < 0.05 compared with control, and ***P < 0.05 compared with respective HIV, GLU, and ANG II alone.
Fig. 5.
Fig. 5.
LOS enhances VDR expression and provides protection against DNA damage by inhibiting proteosomal degradation A: HPs were incubated in media containing either buffer (with 5 mM glucose), ANG II (10−8 M), or GLU (30 mM) with or without LOS (10−7 M) for 48 h (n = 4). Additionally, HIV/HPs were incubated with or without LOS (10−7 M) for 48 h (n = 4). Cellular lysates were analyzed for proteosomal activity. Cumulative data from 4 sets of experiments are shown. *P < 0.05 compared with control; **P < 0.05 compared with control and LOS; ***P < 0.05 compared with respective HIV, GLU, and ANG II alone. B: HPs were incubated in media containing either buffer or GLU (30 mM) in the presence or absence of phosphatidylinositol 3-kinase inhibitor [PI3Ki (LYZ94002); 10 μM] for 48 h (n = 3). Subsequently, cellular lysates were analyzed for proteosomal activity. Cumulative data from 3 sets of experiments are shown. *P < 0.05 compared with other variables. C: HPs were incubated in media containing either buffer or ANG II (10−8 M) in the presence or absence of MG132 (10−8 M, a proteosomal degradation inhibitor) for 48 h (n = 3–7). Protein blots were probed for VDR and reprobed for actin. Representative gels along with densitometric analysis in bar graphs are shown. *P < 0.05 vs. control; **P < 0.01 vs. control and ANG II alone; ***P < 0.05 vs. control; #P < 0.01 vs. ANG II alone. D: HPs grown on coverslips were treated with either buffer or ANG II (10−8 M) with or without MG132 (10−8 M) for 48 h (n = 3). Cells were colabeled for H2AX and KU80 and examined under a fluorescence microscope. Representative microfluorograms are shown. HPs treated with ANG II displayed attenuated expression of KU80 (DNA repair) and enhanced expression of H2AX (double strand breaks). E: cumulative data (number of H2AX foci) from the protocol described in D (n = 3) were summarized and are shown in a scattergram. Results are presented as means ± SD. *P < 0.05 compared with control; **P < 0.05 compared with control; ***P < 0.05 compared with ANG II; #P < 0.05 compared with control and MG132; ##P < 0.05 compared with ANG II/MG132. F: cumulative data (integrated density, KU80) from the protocol described in D were summarized and are shown in a scattergram. Results are shown as means ± SD. *P < 0.05 compared with control; **P < 0.05 compared with ANG II; #P < 0.05 compared with control. G: HPs grown on coverslips were transfected with SMRT small interfering (si)RNA. Control HPs and SMRT siRNA-transfected HPs were incubated in media containing either buffer or LOS (10−7 M) for 48 h (n = 3). Cells were colabeled for H2AX and KU80. Representative microfluorograms are shown. H: cumulative data (number of H2AX foci) from the protocol described in G (n = 3) are shown in a scattergram. Results are shown as means ± SD. *P < 0.05 compared with control; **P < 0.05 compared with LOS; #P < 0.05 compared with control; ##P < 0.05 compared with LOS. I: cumulative data (integrated density, KU80) from the protocol described in G (n = 3) were summarized and are shown in a scattergram (means ± SD). *P < 0.05 compared with control; #P < 0.05 compared with LOS.
Fig. 6.
Fig. 6.
Effect of LOS and VDA on the deacetylation and acetylation of histones via corepressor and coactivator complex formation. A: HPs were incubated in media containing either buffer, LOS (10−7 M), or EB1089 (VDA, 100 pM) for 48 h (n = 3). Subsequently, proteins were extracted from cell lysates, and protein blots were probed for VDR (A1). The same blots were reprobed for SMRT (A2), Sin3A (A3), phosphorylated (p)-histone deacetylase 3 (HDAC3; A4), CREB-binding protein (CBP)/p300 (A5), acetyl-histone 3 (Ac-H3; A6), and actin. Densitometric analyses (protein/actin) are shown in bar diagrams (A1A6). In A1, *P < 0.01 vs. control and **P < 0.001 vs. control; in A2, *P < 0.01 vs. control and **P < 0.05 vs. control; in A3, *P < 0.05 vs. control or LOS; in A4, *P < 0.01 vs. control and **P < 0.01 vs. LOS; in A5, not significant; in A6, *P < 0.05 vs control. B: immunoprecipitation (IP) of cell lysates from the protocol described in A with VDR antibody was carried out (n = 3). IP fractions were probed for VDR (B1), SMRT (B2), p-HDAC3 (B3), CBP/p300 (B4), and Ac-H3 (B5). IgG labeling is shown to display the loading of proteins. Densitometric analyses (protein/IgG) are shown in bar diagrams (B1–B5). In B1, *P < 0.01 vs. control; in B2, *P < 0.05 vs. control or VDA; in B3, P < 0.05 vs. control and **P < 0.05 vs. LOS; in B4, *P < 0.05 vs. other variables; in B5, *P < 0.05 vs. other variables. C: proposed mechanisms of binding of VDR-UL to repressor or liganded VDR to activator complexes. In the absence of the ligand, VDR-UL is bound with the repressor complex [transducin β-like 1 receptor (TBL1R), Sin3A, and SMRT], which recruits HDACs. The latter deacetlylates histones (H3 and H4). Deacetylation of histone tails initiates chromatin compaction and repression of gene activation, a consequence of which is inaccessibility of DNA. In the presence of 1,25(OH)2D or VDA, the AF2 region of VDR triggers the release of corepressors from the VDR. 1,25(OH)2D- or VDA-bound VDR form a coactivator complex [CBP/p300, SRC-1, p-p300/CBP-associated factor (p-CAF), and p-CBP-interacting protein (p-CIP)] containing histone acetyl transferase activity, which initiates acetylation of histones (H3 and H4) and thus induces chromatin decompaction and gene activation as a consequence of availability of accessible DNA. D: HPs were incubated in media containing either buffer or GLU (30 mM) in the presence or absence of LOS (10−7 M) for 48 h (n = 3). Subsequently, cell lysates were immunoprecipitated with anti-SMRT antibody. Immunoprecipitates were probed for p-SMRT and reprobed for SMRT. Gels are shown, and densitometric analyses are shown in bar diagrams. *P < 0.05 vs control; **P < 0.001 vs. control, LOS alone, or GLU/LOS; ***P < 0.01 vs. LOS. E: HPs were incubated in media containing either buffer or GLU (30 mM) in the presence or absence of LOS (10−7 M) for 48 h (n = 3). Protein blots were probed p-Akt (Ser473). The same blots were reprobed for actin. Gels are shown, and densitometric analyses are shown in bar graphs. *P < 0.01 vs. control; *P < 0.05 vs. LOS. F: HPs were incubated in media containing either buffer or GLU (30 mM) in the presence or absence of LOS (10−7 M) for 48 h. Cell lysates were immunoprecipitated with anti-TBL1R antibody (n = 3). Immunoprecipitates were probed for TBL1R and reprobed for phosphorylation (serine) status. IgG labeling is shown to display the loading of proteins. Gels and densitometric analyses in bar graphs are shown. *P < 0.05 vs. control; **P < 0.01 vs. control or LOS. G: proposed mechanism of disintegration of the corepressor complex. Phosphorylation of TBL1R induces the disintegration of the corepressor complex. Phosphorylation of Akt or MAPK3 leads to the phosphorylation of SMRT; p-SMRT translocates to the cytosol and undergoes proteosomal degradation.
Fig. 7.
Fig. 7.
AT1R-BLK downregulates proapoptotic gene expression through SMRT expression. A: HPs were incubated in media containing either buffer (with 5 mM glucose) or GLU (30 mM) with or without LOS (10−7 M) for 48 h (n = 3). Protein blots were probed for p53 (A1). The same blots were reprobed sequentially for p-checkpoint protein 2 (p-Chk2; A2), Wip1 (A3), SMRT (A4), BAX (A5), and actin. Gels and densitometric analyses in bar graphs (A1–A5) are shown. In A1, *P < 0.01 vs. control, **P < 0.001 vs. control, ***P < 0.001 vs. LOS, #P < 0.001 vs. LOS, and ##P < 0.01 vs. GLU; in A2, *P < 0.05 vs. control or LOS, **P < 0.01 vs. control, ***P < 0.05 vs. LOS, and #P < 0.001 vs. GLU; in A3, *P < 0.01 vs. control, **P < 0.01 vs. LOS, ***P < 0.05 vs. LOS, and #P < 0.05 vs. GLU; in A4, *P < 0.01 vs. control, **P < 0.05 vs. LOS, and ***P < 0.05 vs. GLU; in A5, *P < 0.001 vs. control, **P < 0.001 vs. LOS, and ***P < 0.001 vs. GLU. B: control HPs or HPs transfected with SMRT siRNA were incubated in media containing buffer (control) with or without LOS (10−7M) for 48 h (n = 3). Protein blots were probed for SMRT (B1), Wip1 (B2), p-Chk2 (B3), BAX (B4), and actin, sequentially. Gels and densitometric analyses in bar graphs (B1–B4) are shown. In B1, *P < 0.05 vs. LOS; in B2, *P < 0.05 vs. LOS; in B3, *P < 0.01 vs. control, **P < 0.001 vs. control, and ***P < 0.01 vs. LOS; in B4, *P < 0.01 vs. control, **P < 0.01 vs. SMRT siRNA; and ***P < 0.01 vs. LOS/SMRT siRNA.
Fig. 8.
Fig. 8.
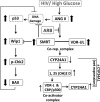
Proposed mechanism of VDR (UL)/SMRT in the suppression of proapoptotic gene expression and enhanced DNA repair. AMs work through podocyte generation of ANG II. Angiotensin receptor blockers (ARBs) block the effects of ANG II and stimulate the formation of corepressor complexes by enhancing expression of VDR and SMRT. Corepressor complexes downregulate CYP24A1 transcription; since CYP24A1 inhibits the degradation of 1,25(OH)2D and the later enhances the expression of CYP24A1, net CYP24A1 expression would depend on the presence of 1,25(OH)2D in the milieu. AMs through ANG II will also induce DNA damage. The latter activates the p53 pathway and expression of proapoptotic genes, such as BAX. SMRT would downregulate expression of proapoptotic gene expression through inhibition of Wip1 and phosphorylation of Chk2. Additionally, SMRT would directly enhance DNA repair and thus provide protection against DNA damage occurring in AMs. VDR-L, liganded VDR.

References

    1. Alimirah F, Vaishnav A, McCormick M, Echchgadda I, Chatterjee B, Mehta RG, Peng X. Functionality of unliganded VDR in breast cancer cells: repressive action on CYP24 basal transcription. Mol Cell Biochem 342: 143–150, 2010. - PMC - PubMed
    1. Aranda A, Pascual A. Nuclear hormone receptors and gene expression. Physiol Rev 81: 1269–1304, 2001. - PubMed
    1. Cantorna MT, Waddell A. The vitamin D receptor turns off chronically activated T cells. Ann NY Acad Sci 1317: 70–75, 2014. - PubMed
    1. Carlberg C, Mathiasen IS, Saurat JH, Binderup L. The 1,25-dihydroxyvitamin D3 (VD) analogues MC903, EB1089 and KH1060 activate the VD receptor: homodimers show higher ligand sensitivity than heterodimers with retinoid X receptors. J Steroid Biochem Mol Biol 51: 137–142, 1994. - PubMed
    1. Chandel N, Sharma B, Husain M, Salhan D, Singh T, Rai P, Mathieson PW, Saleem MA, Malhotra A, Singhal PC. HIV compromises integrity of the podocyte actin cytoskeleton through downregulation of the vitamin D receptor. Am J Physiol Renal Physiol 304: F1347–F1357, 2013. - PMC - PubMed

Publication types

MeSH terms

LinkOut - more resources