. 2015 Jul 31;290(31):19034-43.
doi: 10.1074/jbc.M115.640292. Epub 2015 Jun 17.

Hyperinsulinemia Enhances Hepatic Expression of the Fatty Acid Transporter Cd36 and Provokes Hepatosteatosis and Hepatic Insulin Resistance

Affiliations

Hyperinsulinemia Enhances Hepatic Expression of the Fatty Acid Transporter Cd36 and Provokes Hepatosteatosis and Hepatic Insulin Resistance

Pär Steneberg et al. J Biol Chem. .

Abstract

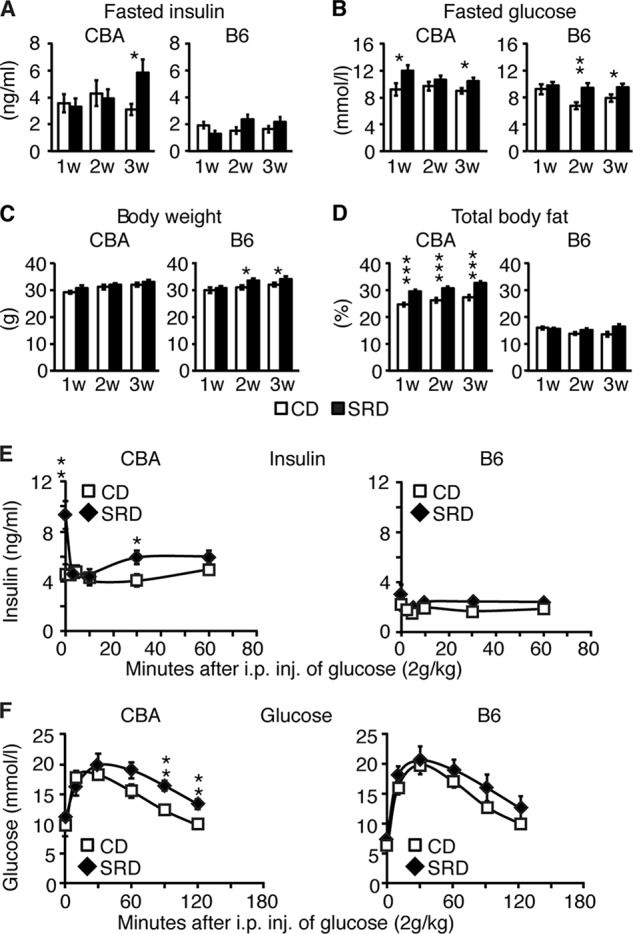
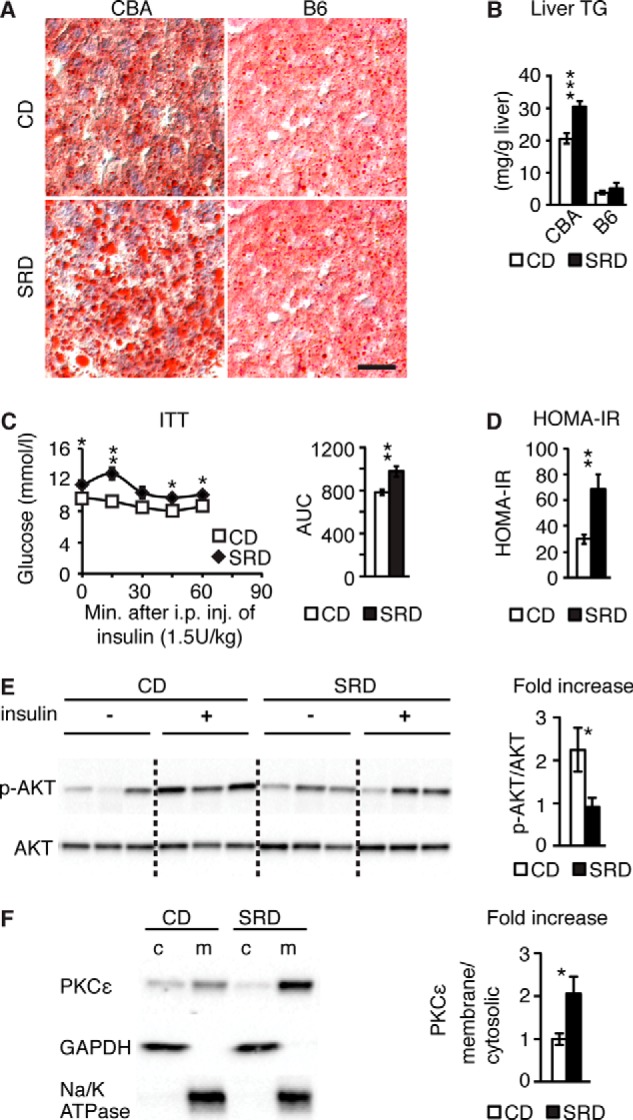
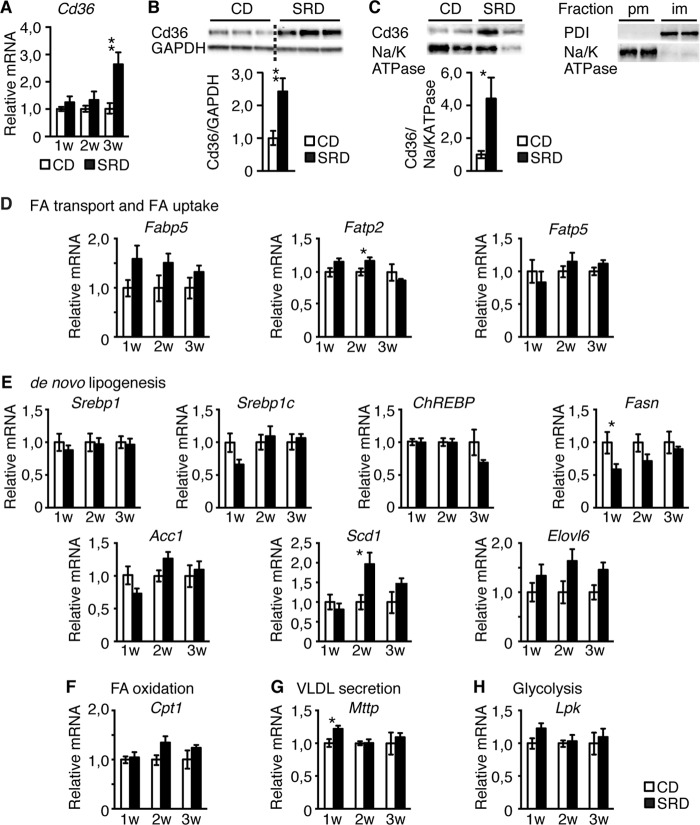
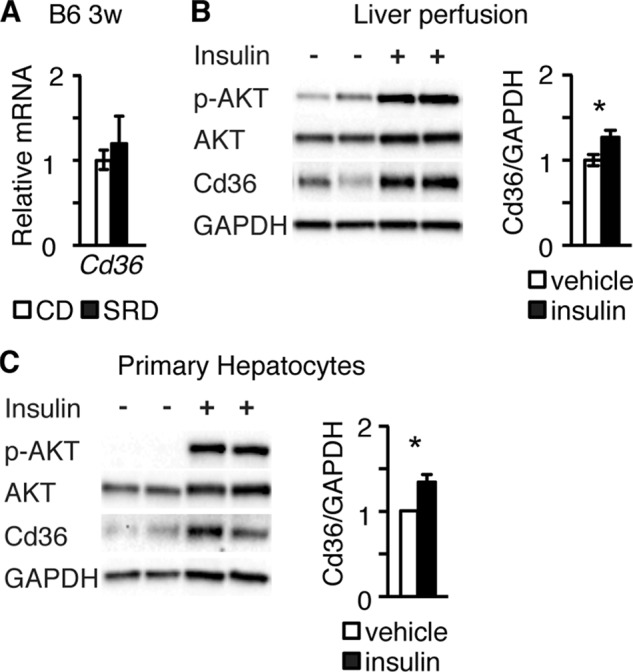
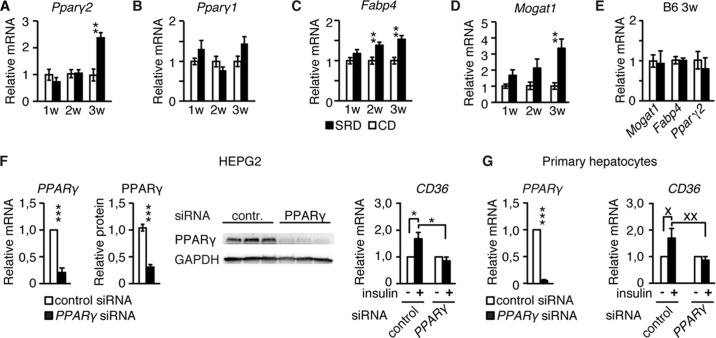
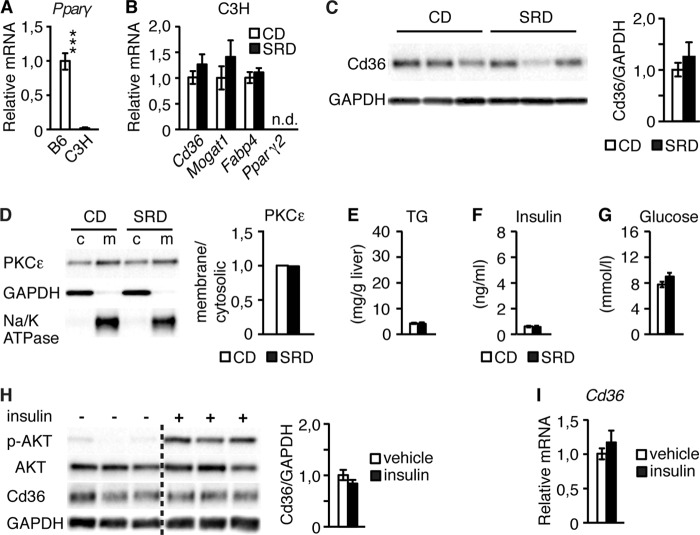
Hepatosteatosis is associated with the development of both hepatic insulin resistance and Type 2 diabetes. Hepatic expression of Cd36, a fatty acid transporter, is enhanced in obese and diabetic murine models and human nonalcoholic fatty liver disease, and thus it correlates with hyperinsulinemia, steatosis, and insulin resistance. Here, we have explored the effect of hyperinsulinemia on hepatic Cd36 expression, development of hepatosteatosis, insulin resistance, and dysglycemia. A 3-week sucrose-enriched diet was sufficient to provoke hyperinsulinemia, hepatosteatosis, hepatic insulin resistance, and dysglycemia in CBA/J mice. The development of hepatic steatosis and insulin resistance in CBA/J mice on a sucrose-enriched diet was paralleled by increased hepatic expression of the transcription factor Pparγ and its target gene Cd36 whereas that of genes implicated in lipogenesis, fatty acid oxidation, and VLDL secretion was unaltered. Additionally, we demonstrate that insulin, in a Pparγ-dependent manner, is sufficient to directly increase Cd36 expression in perfused livers and isolated hepatocytes. Mouse strains that display low insulin levels, i.e. C57BL6/J, and/or lack hepatic Pparγ, i.e. C3H/HeN, do not develop hepatic steatosis, insulin resistance, or dysglycemia on a sucrose-enriched diet, suggesting that elevated insulin levels, via enhanced CD36 expression, provoke fatty liver development that in turn leads to hepatic insulin resistance and dysglycemia. Thus, our data provide evidence for a direct role for hyperinsulinemia in stimulating hepatic Cd36 expression and thus the development of hepatosteatosis, hepatic insulin resistance, and dysglycemia.

Keywords: CD36; PPARγ; Type 2 diabetes; fatty acid transport; fatty liver; hepatocyte; insulin; insulin resistance.


Figures

FIGURE 1.
FIGURE 1.
CBA mice on SRD develop hyperinsulinemia and glucose intolerance. A and B, fasted circulating insulin (A) and glucose (B) levels in CBA (CD n = 15 and SRD n = 15) and B6 (CD n = 5 and SRD n = 5) mice. C and D, body weights (C) and total body fat content (D) in CBA (CD n = 15–20 and SRD n = 15–20) and B6 (CD n = 8–15 and SRD n = 8–15) mice. E and F, insulin (E) and glucose (F) levels during GTT in 3w CBA (CD n = 10 and SRD n = 10) and B6 (CD n = 5 and SRD n = 5) mice. Data are presented as mean ± S.E. *, p < 0.05; **, p < 0.01; ***, p < 0.001; inj, injection.
FIGURE 2.
FIGURE 2.
3w SRD results in hepatic steatosis and insulin resistance in CBA mice. A, representative Oil-red-O staining of fat droplets in liver sections from 3w and SRD CBA and B6 mice. Scale bar, 25 μm. B, TG content was measured in livers from 3w CBA (CD n = 10 and SRD n = 10) and B6 (CD n = 5 and SRD n = 5) mice. C, ITT in 3w CBA (CD n = 6 and SRD n = 6) mice. Diagram to the right show area under the curve (AUC) for the ITT. D, HOMA-IR in 3 weeks CBA (CD n = 20 and SRD n = 20) mice. E, representative Western blot and quantification of AKT phosphorylation in livers from 3w CD (n = 5) and SRD (n = 5) treated CBA mice following insulin injections. Dotted lines separate noncontiguous lanes of the same gel. F, PKCϵ membrane translocation assay. Liver lysates were fractionated from 3w CD (n = 4) and SRD (n = 4)-treated CBA mice. Representative Western blot and quantification of membrane (m)/cytosolic (c) ratio of PKCϵ are presented. The experiment was repeated with pooled liver samples (n = 6–7) with similar results. Data are presented as mean ± S.E., where *, p < 0.05; **, p < 0.01; ***, p < 0.001.
FIGURE 3.
FIGURE 3.
Hepatic Cd36 expression is increased in 3w SRD CBA mice. A, real time PCR analyses of hepatic Cd36 expression in CD (n = 6) and SRD (n = 5–6)-treated CBA mice. B, representative Western blot and quantification of Cd36 expression in liver extracts isolated from CBA mice after 3 weeks of CD (n = 12) and SRD (n = 12). Each lane represents a biological replicate. Dotted lines separate noncontiguous lanes of the same gel. C, representative Western blot and quantification of Cd36 localization in hepatic plasma membrane fractions isolated from 3-week-treated CBA (CD n = 4 and SRD n = 4) mice. Control Western blot to the right show protein-disulfate isomerase (PDI) and Na/K-ATPase markers for plasma membrane (pm) and intracellular membrane (im) fractions, respectively, to confirm the purity of the prepared plasma membrane fractions. D–H, qRT-PCR expression analyses of indicated genes in livers from CBA mice CD (n = 6) and SRD (n = 5–6). Data are presented as mean ± S.E., where *, p < 0.05; **, p < 0.01.
FIGURE 4.
FIGURE 4.
Insulin enhances Cd36 expression in perfused livers and primary hepatocytes. A, real time PCR analyses of hepatic expression Cd36 in liver lysates isolated from B6 mice after 3 weeks on CD (n = 6) and SRD (n = 6). B, representative Western blot of phosphorylated AKT and Cd36 protein expression in total protein lysates from vehicle and insulin perfused B6 livers. Quantification of Cd36 expression in B6 vehicle (n = 12) and insulin (n = 9) perfused livers is shown in the diagram. C, representative Western blot of phosphorylated AKT and Cd36 expression in vehicle and insulin-cultured primary hepatocytes. Quantification of Cd36 expression assessed by Western blot densitometry is shown in the diagram (n = 5). Data are presented as mean ± S.E., where *, p < 0.05.
FIGURE 5.
FIGURE 5.
Insulin-mediated enhancement of hepatic Cd36 expression is PPARγ-dependent. A–E, real time PCR analyses of Pparγ2 (A), Pparγ1 (B), Fabp4 (C), and Mogat1 (D) hepatic expression in CBA mice after 1–3 weeks of CD (n = 6) and SRD (n = 5–6) and in B6 mice (E) after 3 weeks of CD (n = 6) and SRD (n = 6). F, real time PCR and Western blot analyses of PPARγ (in control and PPARγ siRNA-transfected cells) and CD36 expression in siRNA-treated HepG2 cells incubated with insulin (n = 6–7). G, real time PCR analyses of Pparγ (in control and Pparγ siRNA-transfected cells) and Cd36 expression in siRNA-treated primary hepatocytes in the presence of absence of insulin (n = 9). Data are presented as mean ± S.E., where *, p < 0.05; **, p < 0.01; ***, p < 0.001. × represents p = 0.09, and ×× represents p = 0.06.
FIGURE 6.
FIGURE 6.
Insulin fails to induce Cd36 expression in C3H livers. A and B, real time PCR analyses of hepatic expression of Pparγ (A) in liver extracts from B6 (n = 6) and C3H (n = 5) mice and Cd36, Mogat1, Fabp4, and Pparγ2 expression (B) in liver extracts from C3H mice after 3 weeks of CD (n = 4) and SRD (n = 5) are shown. C, representative Western blot and quantification of Cd36 expression in liver cell lysates from 3-week CD (n = 5) and SRD (n = 5) C3H mice. D, representative Western blot and quantification of membrane/cytosolic ratio of PKCϵ in liver extracts pooled from 3w CD (n = 5) and SRD (n = 5)-treated C3H mice separated into cytosolic (c) and membrane (m) fractions. E–G, hepatic TG (E), plasma insulin (F), and blood glucose (G) levels in C3H mice after 3 weeks of CD (n = 5) and SRD (n = 5) are shown. H, representative Western blot and quantification of phosphorylated AKT and Cd36 expression in livers from C3H mice subjected to vehicle (n = 7) and insulin (n = 7) perfusion. Dotted lines separate noncontiguous lanes of the same gel. I, real time PCR analyses of Cd36 expression in liver extracts from C3H mice. Data are presented as mean ± S.E., where ***, p < 0.001.

References

    1. Kim C. H., Younossi Z. M. (2008) Nonalcoholic fatty liver disease: a manifestation of the metabolic syndrome. Cleve. Clin. J. Med. 75, 721–728 - PubMed
    1. Postic C., Girard J. (2008) Contribution of de novo fatty acid synthesis to hepatic steatosis and insulin resistance: lessons from genetically engineered mice. J. Clin. Invest. 118, 829–838 - PMC - PubMed
    1. Cohen J. C., Horton J. D., Hobbs H. H. (2011) Human fatty liver disease: old questions and new insights. Science 332, 1519–1523 - PMC - PubMed
    1. Birkenfeld A. L., Shulman G. I. (2014) Nonalcoholic fatty liver disease, hepatic insulin resistance, and Type 2 diabetes. Hepatology 59, 713–723 - PMC - PubMed
    1. Bradbury M. W. (2006) Lipid metabolism and liver inflammation. I. Hepatic fatty acid uptake: possible role in steatosis. Am. J. Physiol. Gastrointest. Liver Physiol. 290, G194–G198 - PubMed

Publication types