. 2015 Aug 28;290(35):21200-12.
doi: 10.1074/jbc.M114.630400. Epub 2015 Jun 17.

A Three-protein Charge Zipper Stabilizes a Complex Modulating Bacterial Gene Silencing

Affiliations

A Three-protein Charge Zipper Stabilizes a Complex Modulating Bacterial Gene Silencing

Tiago N Cordeiro et al. J Biol Chem. .

Abstract

The Hha/YmoA nucleoid-associated proteins help selectively silence horizontally acquired genetic material, including pathogenicity and antibiotic resistance genes and their maintenance in the absence of selective pressure. Members of the Hha family contribute to gene silencing by binding to the N-terminal dimerization domain of H-NS and modifying its selectivity. Hha-like proteins and the H-NS N-terminal domain are unusually rich in charged residues, and their interaction is mostly electrostatic-driven but, nonetheless, highly selective. The NMR-based structural model of the complex between Hha/YmoA and the H-NS N-terminal dimerization domain reveals that the origin of the selectivity is the formation of a three-protein charge zipper with interdigitated complementary charged residues from Hha and the two units of the H-NS dimer. The free form of YmoA shows collective microsecond-millisecond dynamics that can by measured by NMR relaxation dispersion experiments and shows a linear dependence with the salt concentration. The number of residues sensing the collective dynamics and the population of the minor form increased in the presence of H-NS. Additionally, a single residue mutation in YmoA (D43N) abolished H-NS binding and the dynamics of the apo-form, suggesting the dynamics and binding are functionally related.

Keywords: charge zipper complexes; electrostatics; gene silencing; horizontal gene transfer; nuclear magnetic resonance (NMR); nucleoid-associated proteins; protein dynamic; protein-protein interaction.


Figures

FIGURE 1.
FIGURE 1.
Electrostatics conservation in Hha/YmoA family. A, sequence and secondary structure of Hha/YmoA. Open boxes denote α-helical regions. B, clustering of 13 Hha-like proteins according to the similarity of their electrostatic potential: EC-Hha (E. coli Hha), ST-Hha (Salmonella enterica serovar Typhimurium Hha), Ent-Hha (Enterobacter cloacae Hha), YmoA (Yersinia spp. YmoA), PL-Hha (Photorhabdus luminescens Hha), EW-Hha (Erwinia carotovora Hha), WG-Hha (W. glossinidia Hha), SG-Hha (Sodalis glossinidius Hha), Rmoa (plasmid R100 RmoA), p0157 (plasmid p0157 Hha), pR27 (plasmid R27 Hha), EC-YdgT (E. coli YdgT), and ST-YdgT (S. enterica serovar Typhimurium YdgT). Negative (red) and positive (blue) isopotential contours of each protein are represented. The percentage of sequence identity with respect to EC-Hha is shown below. C, heat-map showing the pairwise electrostatic similarities. The scale is relative from low (light yellow) to high (red) ES. D, the local conservation of sequence (top) and electrostatic potential (bottom) of the ensemble of 13 proteins with respect to E. coli Hha is mapped on the surface of Hha.
FIGURE 2.
FIGURE 2.
Paramagnetic relaxation enhancement experiments. A, MTSL-tagging of singled-cysteine Hha variants. Nitroxide spin labels located at different points in Hha structure are rendered in sticks. B, EDTA-Mn2+ tagging positions on H-NS46 dimer. Mn2+ (paramagnetic centers) atoms are displayed as magenta spheres, representing the flexibility of the tag. C, intermolecular PRE restraints. The histograms show the experimental intensity ratios of each amide resonance of 15N-H-NS46C21S in the presence of substoichiometric amounts of Hha at natural isotopic abundance, with MTSL conjugated at D37C or S66C. Ipara is the intensity in the paramagnetic sample, and Idia is the intensity in the corresponding diamagnetic control. Signals that disappear in paramagnetic conditions are indicated by black dots. Red dots identify residues that could not be accurately measured due to broadening caused by complexation. White circles indicate missing signals. Stronger intermolecular PREs are displayed on H-NS46 structure and highlighted on the PRE profiles in blue scale. PRE ratios were converted into intermolecular distance restraints. D, intermolecular paramagnetic effects (open circles) induced on the backbone amide resonance of 15N-HhaC18I by EDTA-Mn2+ attached to H-NS46 The solid red line represents the average PRE profile predicted from the best structures. The inset displays the PREs effects mapped on the surface of representative Hha structures of both clusters.
FIGURE 3.
FIGURE 3.
Hha·H-NS interaction mapping. A, Hha residues most affected by broadening in the presence of 0.5 eq of H-NS64 are highlighted in yellow on ribbon and surface representations of Hha structure. C18 (in red) mutants do not affect H-NS binding. Asp-48 and Glu-25 mutants show null or reduced affinity toward H-NS. These residues are located in the same side of Hha structure, whereas C18 is located on the opposite side of H-NS binding site. B, H-NS46 residues most affected by the addition of Hha are highlighted in yellow. The Hha binding region is located around the first two helices of H-NS and R12 is essential for Hha binding. N9 mutants also strongly reduce Hha binding.
FIGURE 4.
FIGURE 4.
Hha·H-NS charge zipper. A, superposition of the 10 lowest energy PRE-derived solution complex structures. Hha (orange) and H-NS46 dimer (light blue and gray) are shown in ribbon representations. All models satisfy the experimental data clustered into two equivalent solutions. B, close-up of the charge zipper interface. The solid and dashed-line boxes denote residues, whose mutation completely or nearly abolishes the binding, respectively. C, surface representations of the electrostatics potential of Hha and H-NS46 show that the complex is stabilized by charge complementary.
FIGURE 5.
FIGURE 5.
Additional hydrophobic contacts in Hha·H-NS46 complex. Ribbon representation of the atomic model obtained by combining PRE, chemical shift perturbations, and mutagenesis data showing Hha in orange and H-NS46 dimer in gray/blue. Residues at the interface are shown in pink (H-NS46) or green (Hha) sticks. In addition to electrostatics complementary (Fig. 3), the complex is also stabilized by hydrophobic contacts, flanking the salt bridge formed by Asp-48 (Hha) and Lys-32 (H-NS46).
FIGURE 6.
FIGURE 6.
Corroborating experimental evidence for the charge zipper. A, 1H,15N HSQC spectra of 15N-labeled Hha in the presence of 0.5 eq of wild-type H-NS64 (left panel) or 1 eq of H-NS64 K32Q mutant (right panel). Residues showing >75% reduction in their intensities upon the addition of H-NS64 are indicated. The spectra of YmoA free and in the presence of NS64 K32Q are identical, indicating that the K32Q mutation completely prevents the interaction. B, modified HCACO spectra of 13C-YmoA showing the correlation between side-chain carbonyls of Asp and Glu residues and the corresponding β and γ protons in the absence (blue) and in the presence of H-NS64. C, close-up view of the structure of the Hha·H-NS complex. The residue Lys-32 is located in the center of the charge zipper at the complex interface, forming a salt bridge with Asp-48 of Hha. D, close-up view of the structure of the YmoA·H-NS complex generated by homology modeling from the Hha·H-NS complex. YmoA side chains that are perturbed in the presence of H-NS64 (panel B) are indicated.
FIGURE 7.
FIGURE 7.
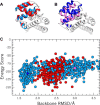
Comparison of x-ray and solution models of Hha·(H-NS46)2 complexes. A, superimposition of the two Hha molecules in the x-ray structure of Ali et al. (21) using the H-NS46 molecules with which they interact as a reference. Hha molecules are shown in red and light blue. B, comparison of the location of Hha in representative structures of both clusters shown in blue and pink ribbon representations. C, r.m.s.d. of the 400 best Hha models derived from solution experiments to the two Hha models derived from x-ray diffraction. The color code is the same. Using the x-ray model depicted in light blue as a reference, the solution models fall into two clusters with low (1.73 ± 0.12 Å) and high (2.99 ± 0.23 Å) r.m.s.d. In contrast, using the “red” x-ray model, the solution models fall in a single cluster with intermediate r.m.s.d. (1.9–2.7 Å).
FIGURE 8.
FIGURE 8.
SAXS data confirm the homology models of YmoA·H-NS64 complexes. Comparison of experimental (circles) and calculated (continuous lines) SAXS curves. A, pure YmoA. The theoretical curve was based on the NMR structure (18) allowing for flexibility in the connection between helices 3 and 4. B, pure H-NS64. The theoretical curve of the H-NS64 dimer was extracted from the x-ray structure of an H-NS oligomer and adding the flexible His tag. C and D, YmoA and HNS64 mixtures. The YmoA·H-NS64 complexes were modeled using the Hha·H-NS structure presented in this study and allowing the same level of flexibility that the free partners. The molar fractions of the species, calculated on the basis of the binding constant and the actual concentrations, were 0.73 (YmoA), 0.03 (H-NS64 dimer), 0.12 H-NS64-YmoA (2:1), and 0.12 (H-NS64-YmoA (2:2) (C) and 0.46 (YmoA), 0.10 (H-NS64 dimer), (0.26 (H-NS64-YmoA (2:1)), and 0.16 (H-NS64-YmoA (2:2)) (D). The quality of the agreement can be evaluated from the residuals shown below each curve and their individual figure of merit χi).
FIGURE 9.
FIGURE 9.
CPMG dispersion profiles and mapping of affected residues. A, H65 in helix 4 of free YmoA at two magnetic fields. B, residue T4 dynamics becomes observable only in the presence of H-NS64. C and D, residues 33 and 43 of the core region in the presence of 40 μm and 80 μm of H-NS64, respectively. The solid lines represent the simultaneously curve fitting to the data from the two magnetic fields. B, residues showing exchange are colored in the YmoA structure according to the exchange rates. The three boxes show the results in the absence (red dashed box) or presence of 40 μm (black dashed-box), 80 μm (blue dashed-box) of H-NS64.
FIGURE 10.
FIGURE 10.
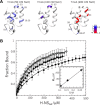
Ionic strength dependence of YmoA dynamics H-NS binding. A, YmoA residues showing ms-μs exchange at different ionic strength. B, fluorescence anisotropy titrations of YmoA with H-NS64 at various ionic strength values. The inset shows the linear dependence of KD with ionic strength.

References

    1. WHO (2014) Antimicrobial Resistance. Global Report on Surveillance, World Health Organization Press
    1. Ochman H., Lawrence J. G., Groisman E. A. (2000) Lateral gene transfer and the nature of bacterial innovation. Nature 405, 299–304 - PubMed
    1. Davies J. (1994) Inactivation of antibiotics and the dissemination of resistance genes. Science 264, 375–382 - PubMed
    1. Davies J., Davies D. (2010) Origins and evolution of antibiotic resistance. Microbiol. Mol. Biol. Rev. 74, 417–433 - PMC - PubMed
    1. Nieto J. M., Carmona M., Bolland S., Jubete Y., de la Cruz F., Juárez A. (1991) The hha gene modulates haemolysin expression in Escherichia coli. Mol. Microbiol. 5, 1285–1293 - PubMed

Publication types

MeSH terms