. 2015 Jun 18;10(6):e0130799.
doi: 10.1371/journal.pone.0130799. eCollection 2015.

Functional Traits and Water Transport Strategies in Lowland Tropical Rainforest Trees

Affiliations

Functional Traits and Water Transport Strategies in Lowland Tropical Rainforest Trees

Deborah M G Apgaua et al. PLoS One. .

Abstract

Understanding how tropical rainforest trees may respond to the precipitation extremes predicted in future climate change scenarios is paramount for their conservation and management. Tree species clearly differ in drought susceptibility, suggesting that variable water transport strategies exist. Using a multi-disciplinary approach, we examined the hydraulic variability in trees in a lowland tropical rainforest in north-eastern Australia. We studied eight tree species representing broad plant functional groups (one palm and seven eudicot mature-phase, and early-successional trees). We characterised the species' hydraulic system through maximum rates of volumetric sap flow and velocities using the heat ratio method, and measured rates of tree growth and several stem, vessel, and leaf traits. Sap flow measures exhibited limited variability across species, although early-successional species and palms had high mean sap velocities relative to most mature-phase species. Stem, vessel, and leaf traits were poor predictors of sap flow measures. However, these traits exhibited different associations in multivariate analysis, revealing gradients in some traits across species and alternative hydraulic strategies in others. Trait differences across and within tree functional groups reflect variation in water transport and drought resistance strategies. These varying strategies will help in our understanding of changing species distributions under predicted drought scenarios.


Conflict of interest statement

Competing Interests: The authors have declared that no competing interests exist.

Figures

Fig 1
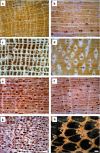
Fig 1. Contrasting wood anatomical features (a-h) of tropical lowland rainforest trees from Daintree, Australia.
Early successional trees (a) Alstonia scholaris and (b) Elaeocarpus angustifolius with light coloured wood and scattered vessels; mature-phase trees (c) Argyrodendron peralatum, (d) Castanospermum australe, (e) Endiandra microneura, (f) Myristica globosa, and (g) Syzygium graveolens with varying vessel and parenchyma arrangements, and; palm (h) Normanbya normanbyi with dark fiber bundles. The white scale bar in Syzygium equal 0.2 mm and serves for all images except for Normanbya where it equals 0.25mm.
Fig 2
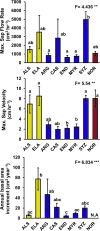
Fig 2. Means (±S.E) of sap flow measures and annual basal area increment of tropical lowland rainforest tree species from Daintree, Australia.
Species codes are as follows for early successional (yellow bars), mature-phase (blue bars) and palm species (maroon bars): Alstonia scholaris (ALS); Elaeocarpus angustifolius (ELA); Argyrodendron peralatum (ARG); Castanospermum australe (CAS); Endiandra microneura (END); Myristica globosa (MYR); Syzygium graveolens (SYZ); Normanbya normanbyi (NOR). The palm species NOR was excluded from the annual basal area increment graph as it does not exhibit secondary growth comparable with the other seven eudicot trees. One-way ANOVA F-values are given and significance levels are indicated by asterisks as follows: P<0.05*, <0.01**, <0.001***. Numerator degrees of freedom and denominator error degrees of freedom are 7 and 22 respectively for sap flow measures and 6 and 19 respectively for annual basal area increment. Significant differences between species are indicated by different letters (Tukeys HSD, p < 0.05).
Fig 3
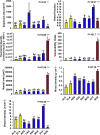
Fig 3. Means (±S.E) of stem traits of tropical lowland rainforest tree species from Daintree, Australia.
Species and colour codes follows Fig 2. One-way ANOVA F-values are given and significance levels are indicated by asterisks as follows: P<0.05*, <0.01**, <0.001***. Numerator degrees of freedom and denominator error degrees of freedom are 7 and 22 respectively for all variables. Significant differences between species are indicated by different letters (Tukeys HSD, p < 0.05).
Fig 4
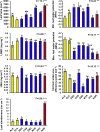
Fig 4. Means (±S.E) of leaf traits of tropical lowland rainforest tree species from Daintree, Australia.
Species and colour codes follows Fig 2. One-way ANOVA F-values are given and significance levels are indicated by asterisks as follows: P<0.05*, <0.01**, <0.001***. Numerator degrees of freedom and denominator error degrees of freedom are 7 and 22 respectively for all variables. Significant differences between species are indicated by different letters (Tukeys HSD, p < 0.05).
Fig 5
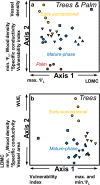
Fig 5. Non-metric multidimensional scaling ordinations of traits of tropical lowland rainforest species including (a) and excluding (b) the palm species.
Traits and their abbreviations (in parentheses) include: vessel area, vessel density, *theoretical specific conductivity, wood density, leaf dry matter content (LDMC), leaf slenderness, minimum and maximum leaf water potentials (min ΨL, max ΨL respectively), intrinsic water-use-efficiency (WUEi) and vulnerability index. Species symbols are as follows: Secondary-successional species – Alstonia scholaris (yellow circles); Elaeocarpus angustifolius (yellow inverted triangles); Mature-phase species – Argyrodendron peralatum (blue circles); Castanospermum australe (blue squares); Endiandra microneura (blue inverted triangles); Myristica globosa (blue diamonds); Syzygium graveolens (blue triangles), and; Palm – Normanbya normanbyi (maroon circles). The arrows by the axes indicate significant positive or negative Pearson correlations between individual traits and axes.

References

    1. Kharin VV, Zwiers FW, Zhang X, Hegerl GC. Changes in temperature and precipitation extremes in the IPCC ensemble of global coupled model simulations. J Climate. 2007;20: 1419–1444. 10.1175/JCLI4066.1 - DOI
    1. Giorgi F, Coppola E, Raffaele F. A consistent picture of the hydroclimatic response to global warming from multiple indices: models and observations, J Geophys Res-Oc Atm. 2014;119: 11,695–11,708.
    1. Sherwood S, Fu S. A Drier Future? Science. 2014;343: 737–739. 10.1126/science.1247620 - DOI - PubMed
    1. Phillips OL, Aragão LEOC, Lewis SL, Fisher JB, Lloyd J, López-González G, et al. Drought sensitivity of the Amazon rainforest. Science. 2009;323: 1344–1347. 10.1126/science.1164033 - DOI - PubMed
    1. Zwieniecki MA, Secchi F. Threats to xylem hydraulic function of trees under ‘new climate normal’ conditions. Plant Cell Environ. 2014; 10.1111/pce.12412 - DOI - PubMed

Publication types