. 2015 Jun 17;86(6):1369-84.
doi: 10.1016/j.neuron.2015.05.018.

Epigenomic Signatures of Neuronal Diversity in the Mammalian Brain

Affiliations

Epigenomic Signatures of Neuronal Diversity in the Mammalian Brain

Alisa Mo et al. Neuron. .

Abstract

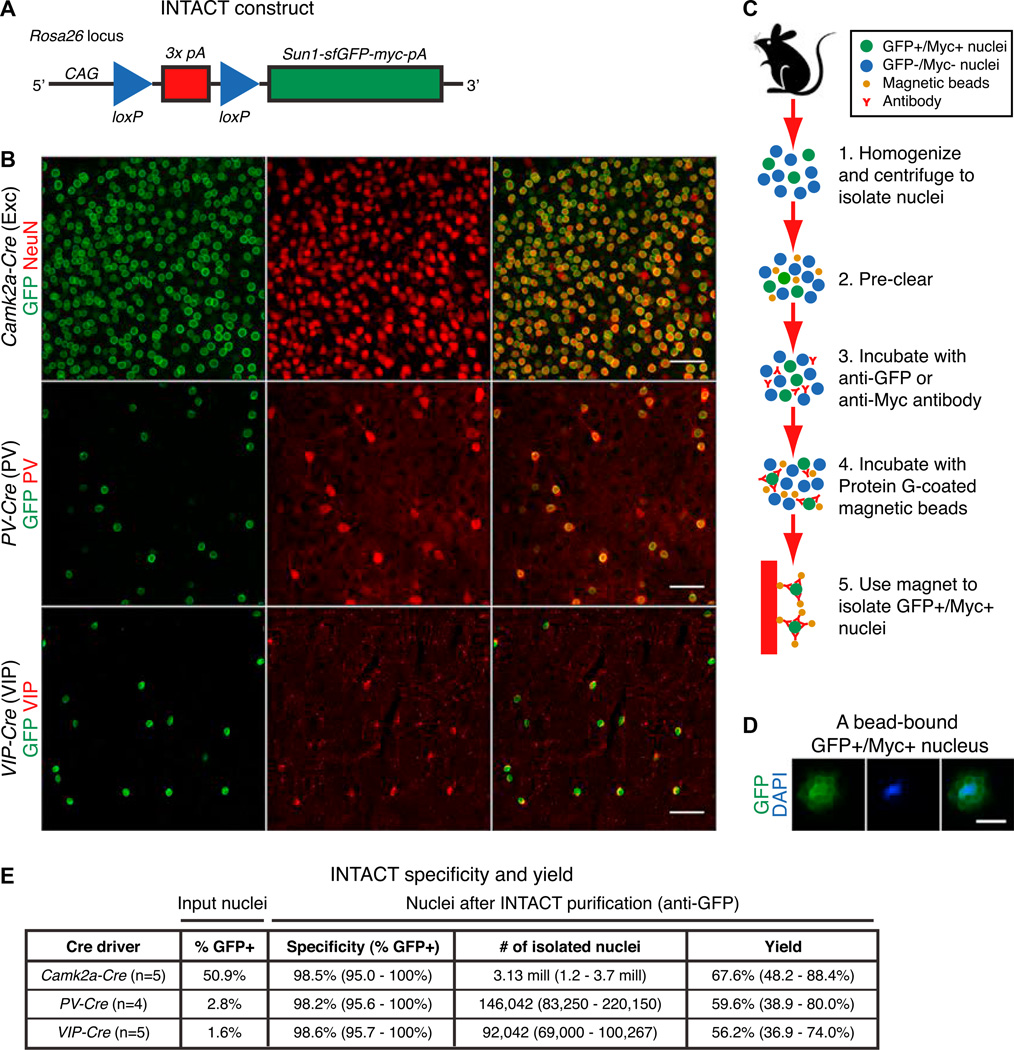
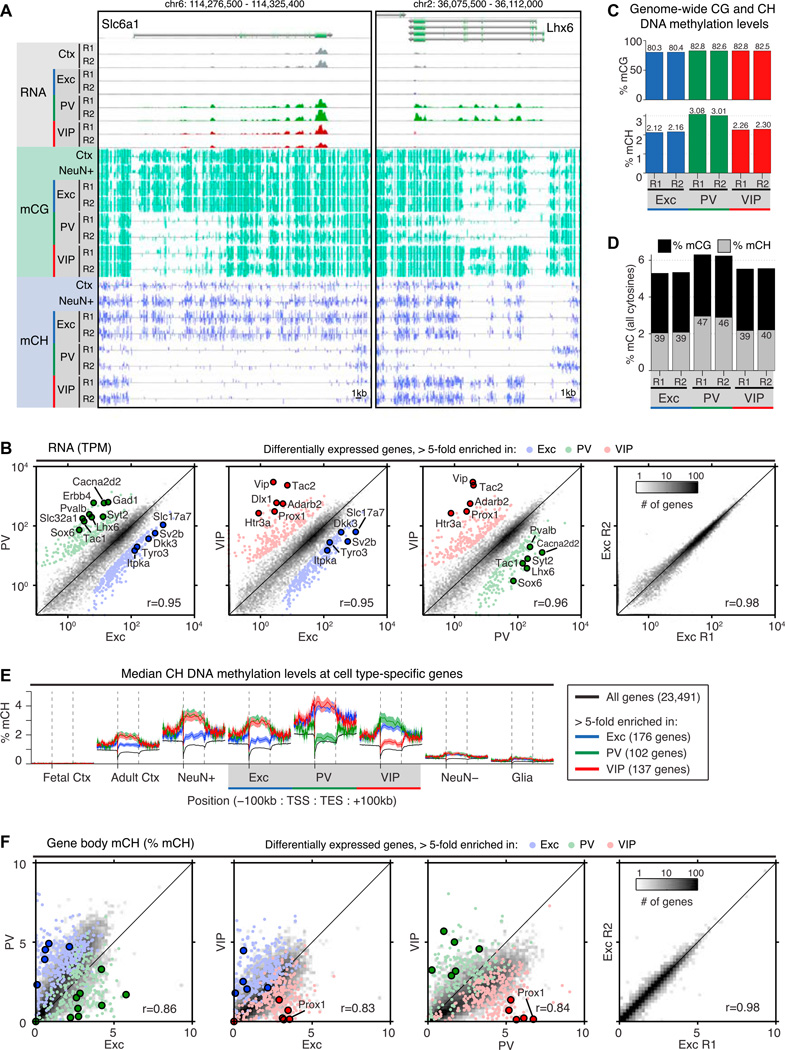
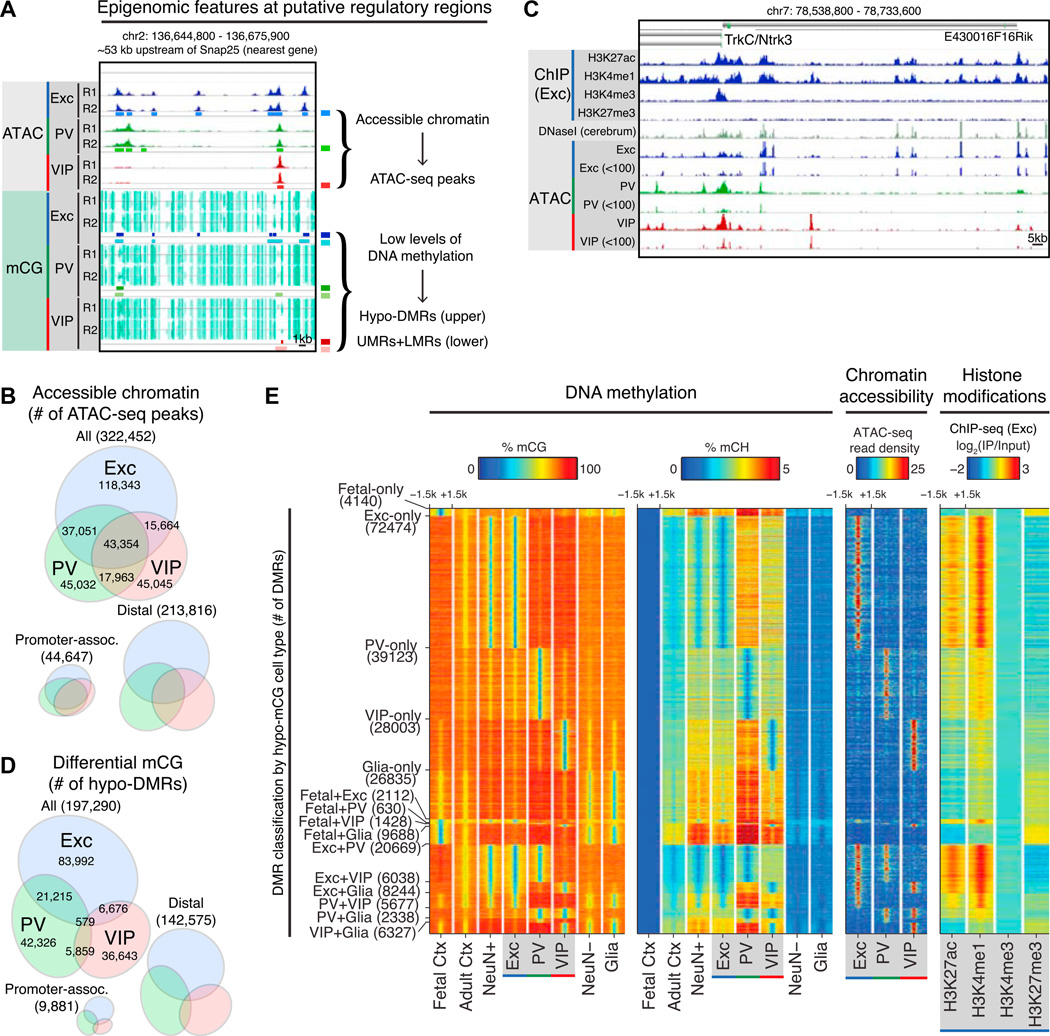
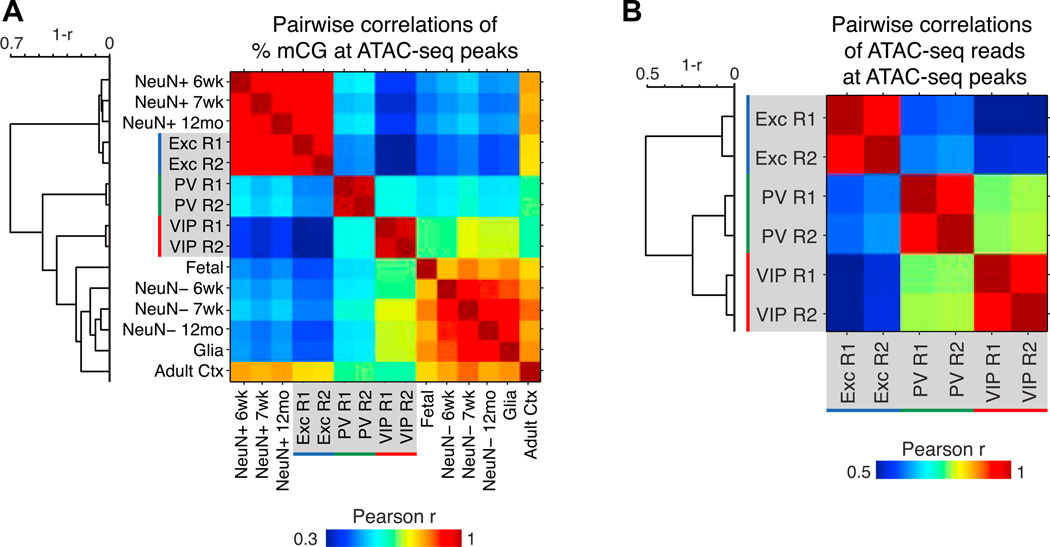
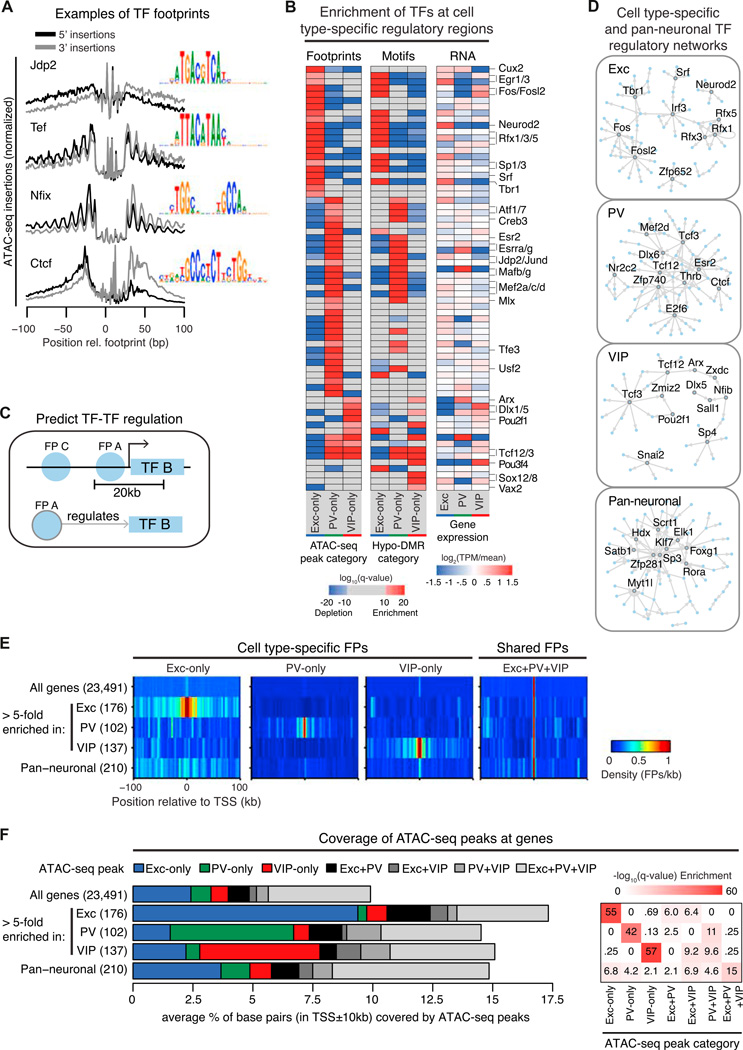
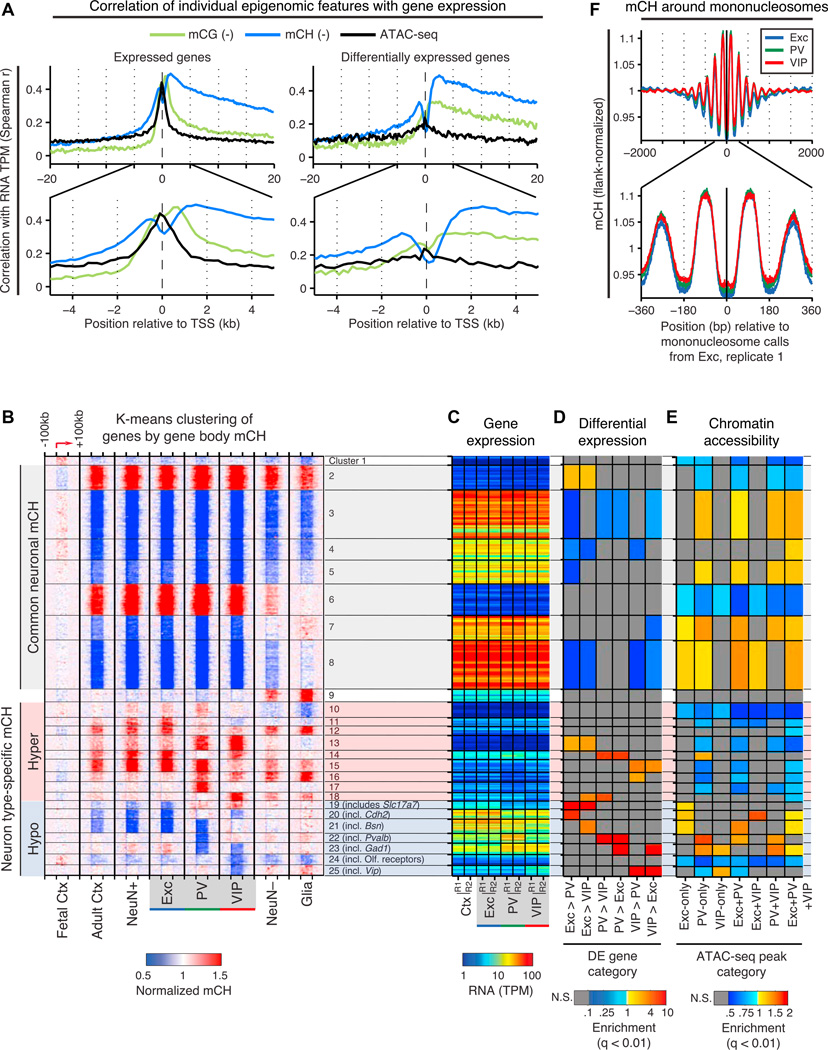
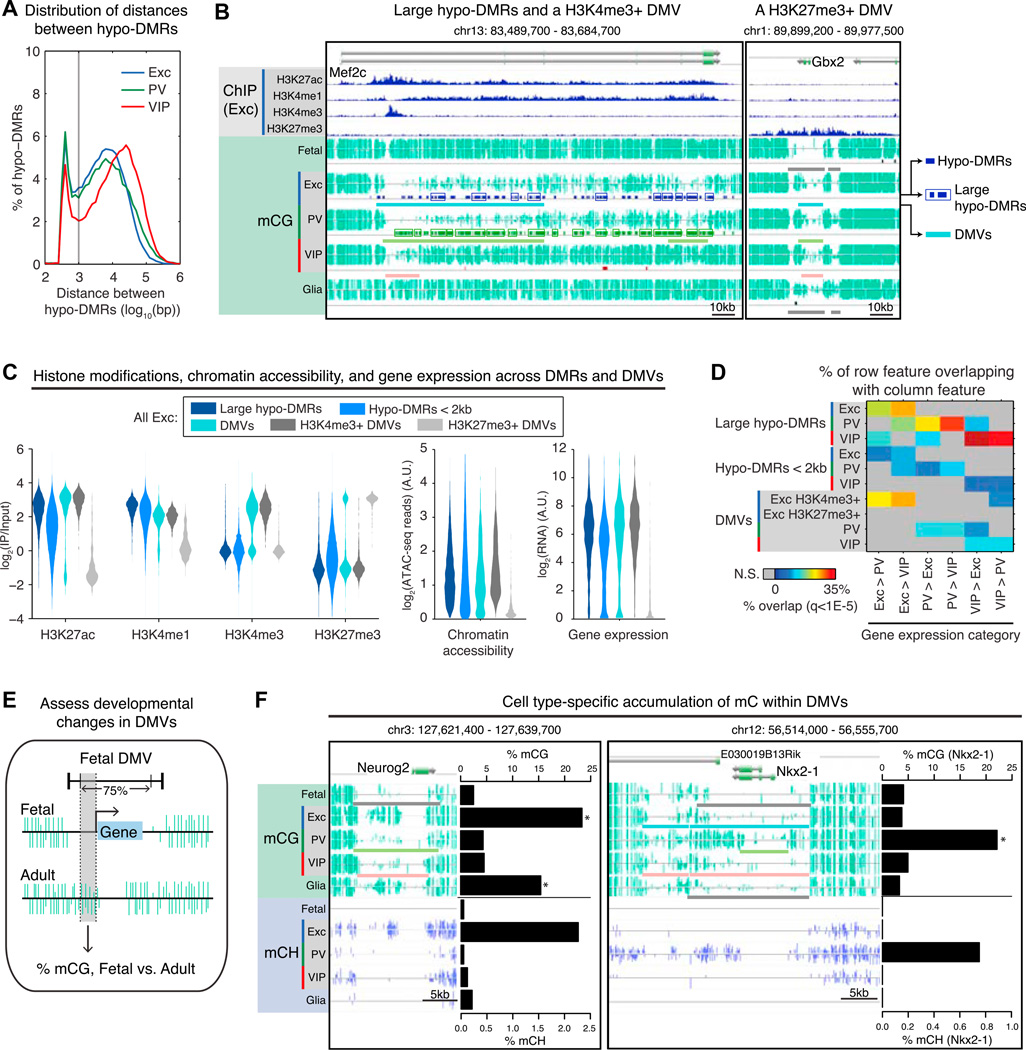
Neuronal diversity is essential for mammalian brain function but poses a challenge to molecular profiling. To address the need for tools that facilitate cell-type-specific epigenomic studies, we developed the first affinity purification approach to isolate nuclei from genetically defined cell types in a mammal. We combine this technique with next-generation sequencing to show that three subtypes of neocortical neurons have highly distinctive epigenomic landscapes. Over 200,000 regions differ in chromatin accessibility and DNA methylation signatures characteristic of gene regulatory regions. By footprinting and motif analyses, these regions are predicted to bind distinct cohorts of neuron subtype-specific transcription factors. Neuronal epigenomes reflect both past and present gene expression, with DNA hyper-methylation at developmentally critical genes appearing as a novel epigenomic signature in mature neurons. Taken together, our findings link the functional and transcriptional complexity of neurons to their underlying epigenomic diversity.


Figures

Figure 1
Figure 1. An Affinity Purification Method Isolates Cell-Type-Specific Nuclei in Mice
(A) Diagram of the INTACT knockin mouse construct. Cre-mediated excision of the transcription stop signals activates expression of the nuclear membrane tag (Sun1 -sfGFP-myc) in the cell type of interest. (B) Immunohistochemistry showing localization of SUN1-sfGFP-Myc in neocortical excitatory, PV, and VIP neurons in mice that carry R26-CAG-LSL-Sun1 sfGFP-myc together with a Cre driver. Scale bars, 50 µm. (C) Steps in the affinity purification method (INTACT). (D) An example of a GFP+/Myc+ nucleus bound by Protein G-coated magnetic beads following INTACT purification and staining with DAPI. Scale bar, 10 µm. (E) For each experiment, INTACT purifications were performed with anti-GFP using pooled neocortices of two mice. Specificity of mouse INTACT: after INTACT purification, bead-bound nuclei were stained with DAPI, and the numbers of GFP+ versus GFP− nuclei were quantified by fluorescence microscopy (100–200 nuclei per experiment). Yield of mouse INTACT: the total number of input nuclei, the percentage of GFP+ nuclei in the input, and the total number of bead-bound nuclei after INTACT purification were quantified using fluorescence microscopy or a hemocytometer (100–200 nuclei per experiment). The yield was calculated based on the observed number of bead-bound nuclei versus the expected number from the input. For percentage of GFP+ nuclei in the input, the mean is shown. For quantities after INTACT purification, both the mean and ranges are shown. See also Figure S1.
Figure 2
Figure 2. Widespread Differences in Gene Expression and DNA Methylation among Neuron Subtypes
(A) Browser representation of RNA-seq read density and DNA methylation in CG and non-CG contexts (mCG, mCH) at two genes. Slc6a1 (GAT-1, left) is expressed primarily in inhibitory neurons. Lhx6 (right) is PV neuron specific. Methylated CG (green) and CH(blue) positions are marked by upward (plus strand) and downward (minus strand) ticks. The height of each tick represents the percentage of methylation, ranging from 0% to 100%. NeuN+ and Ctx (cortex) adult mouse methylomes are from Lister et al. (2013). R1, replicate 1; R2, replicate 2. (B) Pairwise comparisons of protein-coding gene expression measured by RNA-seq across cell types (left three panels) or between replicates (right panel). The most differentially expressed genes (>5-fold change) are shown as colored points, and selected cell-type-specific genes are labeled, r, Pearson correlation of log(TPM+0.1); TPM, transcripts per million. (C) Percentage of MethylC-seq calls supporting methylation in the CG and CH contexts for each cell type on autosomes. (D) Percentage of all MethylC-seq calls supporting methylation. The number in each bar indicates the percentage of all methylated cytosines on autosomes that occur in the CH context. (E) Median ± 1 SEM of percentage of mCH within and surrounding gene bodies, showing an inverse correlation between expression and DNA methylation at differentially expressed genes identified from our RNA-seq data (>5-fold change for one cell type relative to both of the other cell types). TSS, transcription start site; TES, transcription end site; SEM, standard error of the mean. (F) Pairwise comparisons of gene body percentage of mCH across cell types (left three panels) or between replicates (right panel). Colored dots correspond to the same genes shown in (B). See also Figure S2.
Figure 3
Figure 3. Epigenomic Marks Are Coordinated and Highly Cell Type Specific
(A) Examples of intergenic regulatory elements marked by accessible chromatin (peaks in ATAC-seq read density, upper tracks) and low levels of DNA methylation (hypo-DMRs and UMRs+LMRs, lower tracks) at an intergenic region ~53 kb upstream of Snap25 (both the nearest gene and the nearest TSS). Locations of ATAC-seq peaks, hypo-DMRs, and UMRs+LMRs are shown below the corresponding raw data. R1, replicate 1; R2, replicate 2. (B) Area-proportional Venn diagram showing the numbers of all cell-type-specific and shared ATAC-seq peaks across excitatory, PV, and VIP neurons (top). Area-proportional Venn diagrams showing that a greater fraction of promoter-associated peaks (within 2.5 kb of a TSS) are shared compared to distal peaks (>20 kb from a TSS), which are predominantly cell type specific (bottom). (C) Browser representation of regulatory elements around trkC/Ntrk3 marked by histone modifications in excitatory neurons, DNasel hypersensitivity in whole cerebrum (from ENCODE), and peaks in ATAC-seq read density in excitatory, PV, and VIP neurons. For ATAC-seq, greater spatial resolution is achieved by using reads <100 bp in length (tracks labeled < 100). (D) Area-proportional Venn diagram showing the numbers of DMRs identified to be hypo-methylated in excitatory, PV, and/or VIP neurons in a statistical comparison of CG methylation levels across five cell types. Two of these cell types, fetal cortex and glia, are not shown in the diagram. Most DMRs are distal to the TSS rather than promoter associated. (E) Heatmap showing percentage of mCG plotted in 3 kb windows centered at DMRs hypo-methylated in one or two cell types (panel 1). At the same genomic regions, the following additional features were plotted: percentage of mCH (panel 2), chromatin accessibility (ATAC-seq reads) (panel 3), and histone modification ChlP-seq reads in excitatory neurons (panel 4). The number of DMRs in each category is shown in parentheses. See also Figure S3.
Figure 4
Figure 4. Relationships across Cell Types and Development via Epigenomic Marks
Matrices showing pairwise Pearson correlations for percentage of mCG (A) and ATAC-seq read densities (B) at ATAC-seq peaks. Dendrograms show hierarchical clustering using complete linkage and 1-Pearson correlation as the metric. See also Figure S4.
Figure 5
Figure 5. Neuronal Subtypes Are Associated with Distinct Patterns of TF Binding
(A) The average density of ATAC-seq read endpoints (Tn5 transposase insertions) within ±100 bp relative to the estimated locations of footprints for four example TFs, showing characteristic footprint structures. Each footprint profile is normalized by the maximum over the profiled region. Inset: position weight matrix showing sequence motifs at the footprint center. (B) Heatmaps showing the enrichment (red) and depletion (blue) of footprints in cell-type-specific ATAC-seq peaks (left) or motifs in hypo-DMRs (middle). The relative TF expression level across excitatory, PV, and VIP neurons is also shown (right). Selected TFs are labeled; the full matrix can be found in Table S4. (C) Schematic for assessing TF-TF interactions by detecting footprints of one TF (FP A) in a 20 kb window around the TSS of a second TF (TF B); footprints located farther away (FP C) are not predicted to interact. (D) Networks of TF interactions predicted by the method shown in (C) using cell-type-specific and pan-neuronal footprints. Full networks can be found in Table S4. (E) Heatmaps showing the average density of cell-type-specific and pan-neuronal footprints within a TSS ± 100 kb window for each category of genes. (F) Barplot showing the average percentage of base pairs within a TSS ± 10 kb window that overlaps each ATAC-seq peak category, for each category of genes (left). Heatmap showing an enrichment of cell-type-specific peaks at both cell-type-specific and pan-neuronal genes (right). Pan-neuronal genes are from Hobert et al. (2010); q from one-sided Wilcoxon rank-sum test with Benjamini-Hochberg FDR correction. See also Figure S5.
Figure 6
Figure 6. Integrative Analysis of DNA Methylation, Gene Expression, and Chromatin Features
(A) Spearman correlations of three epigenomic features (CG DNA methylation, CH DNA methylation, and ATAC-seq read density) with RNA expression level around the TSS of autosomal expressed (TPM > 0.1) genes (left) and differentially expressed genes (right). The signs of the correlations for mCG and mCH are negative, as these features inversely correlate with gene expression. (B–E) Protein-coding genes were clustered by k-means based on patterns of intragenic mCH. For each cluster (1–25), the following features are plotted: mCH level within each gene body and flanking 100 kb (B); mRNA abundance (C); enrichment or depletion for differentially expressed (DE) genes (D), and enrichment or depletion for cell-type-specific and shared ATAC-seq peaks within ±10 kb of the TSS (E). mCH levels for each gene are normalized by the levels at distal flanking regions (50–100 kb upstream and downstream of the gene body). For clusters with cell-type-specific hypo-methylation, an example gene or gene set is listed. TPM, transcripts per million; N.S., not significant (FET, q < 0.01). (F) mCH levels are higher in the nucleosomal linker region and lower in the nucleosome core. mCH levels are normalized by the level at flanking regions (1–2 kb upstream and downstream of the nucleosome center). See also Figure S6.
Figure 7
Figure 7. Large Domains of Low Methylation Link to Gene Expression, Including Unexpected Hyper-methylation at Developmental Genes
(A) Bimodal distribution of distances between hypo-DMRs in each cell type indicates that some hypo-DMRs are closely spaced (<1 kb separation) and form large blocks of differential methylation (“large hypo-DMRs”). (B) Large hypo-DMRs and an H3K4me3+ DNA methylation valley (DMV) overlap Mef2c (left); an H3K27me3+ DMV overlaps Gbx2 (right). As diagrammed for the excitatory neuron tracks, dark-colored bars indicate hypo-DMRs (top), boxes indicate hypo-DMRs that were grouped into large hypo-DMRs, and light-colored bars indicate DMVs (bottom). (C) For excitatory neurons, violin plots show the distribution of histone modification enrichments (left), ATAC-seq read densities (middle), and gene expression levels (right) within large hypo-DMRs, hypo-DMRs < 2 kb, and DMVs. A.U., arbitrary units. (D) Matrix showing the percentage of each row feature that overlaps with differentially expressed genes. Large hypo-DMRs and H3K4me3+ DMVs (in excitatory neurons) have higher enrichment for differentially expressed genes, compared to hypo-DMRs < 2 kb. H3K27me3+ DMVs (in excitatory neurons) are not enriched for differentially expressed genes at q < 1 × 10⁻⁵. (E) Schematic for assessing the accumulation of CG methylation in each adult cell type (excitatory, PV, and VIP neurons, and glia) compared to fetal cortex, at fetal DMVs overlapping genes. See Table S6. (F) DNA methylation levels for a region around Neurog2 (left), an active TF in excitatory and many glial progenitors, and Nkx2-1 (right), a transiently active TF in PV neuron development. See Table S6 for annotations and references. Barplots show percentage of mCG and percentage of mCH for each cell type in the region between dotted lines in (E). *q < 1 × 10⁻¹⁰ (mCG, adult cell type compared to fetal cortex, one-sided FET with Benjamini-Hochberg correction). In the browser representation, light-colored bars indicate DMVs. See also Figure S7.

Comment in

References

    1. Amin NM, Greco TM, Kuchenbrod LM, Rigney MM, Chung MI, Wallingford JB, Cristea IM, Conlon FL. Proteomic profiling of cardiac tissue by isolation of nuclei tagged in specific cell types (INTACT) Development. 2014;141:962–973. - PMC - PubMed
    1. Bird A. DNA methylation patterns and epigenetic memory. Genes Dev. 2002;76:6–21. - PubMed
    1. Buenrostro JD, Giresi PG, Zaba LC, Chang HY, Greenleaf WJ. Transposition of native chromatin for fast and sensitive epigenomic profiling of open chromatin, DNA-binding proteins and nucleosome position. Nat. Methods. 2013;10:1213–1218. - PMC - PubMed
    1. Burger L, Gaidatzis D, Schübeler D, Stadler MB. Identification of active regulatory regions from DNA methylation data. Nucleic Acids Res. 2013;41:e155. - PMC - PubMed
    1. Deal RB, Henikoff S. A simple method for gene expression and chromatin profiling of individual cell types within a tissue. Dev. Cell. 2010;18:1030–1040. - PMC - PubMed

Publication types

MeSH terms

Associated data