. 2015 Aug 7;290(32):19942-54.
doi: 10.1074/jbc.M115.659011. Epub 2015 Jun 18.

Cysteine-independent Catalase-like Activity of Vertebrate Peroxiredoxin 1 (Prx1)

Affiliations

Cysteine-independent Catalase-like Activity of Vertebrate Peroxiredoxin 1 (Prx1)

Cen-Cen Sun et al. J Biol Chem. .

Retraction in

Abstract

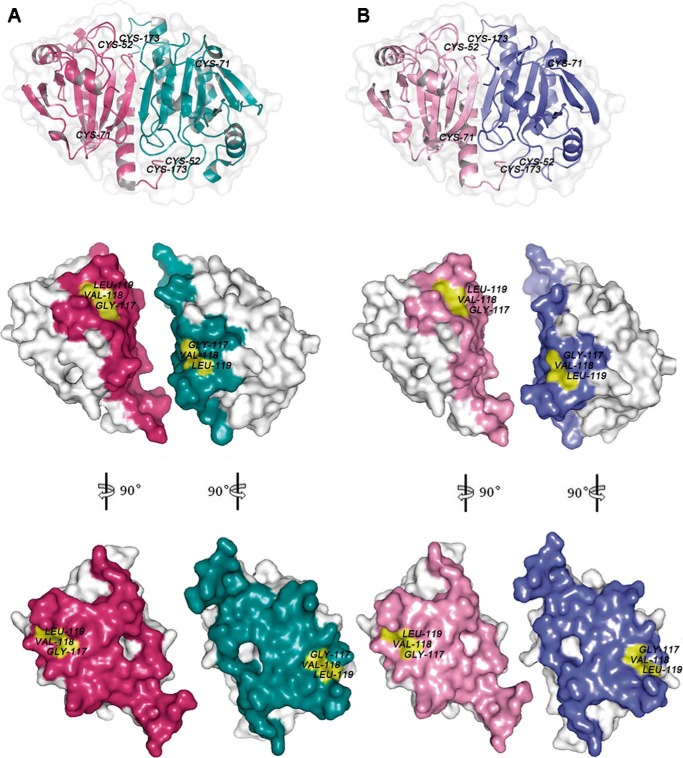
Peroxiredoxins (Prxs) are a ubiquitous family of antioxidant proteins that are known as thioredoxin peroxidases. Here we report that Prx1 proteins from Tetraodon nigroviridis and humans also possess a previously unknown catalase-like activity that is independent of Cys residues and reductants but dependent on iron. We identified that the GVL motif was essential to the catalase (CAT)-like activity of Prx1 but not to the Cys-dependent thioredoxin peroxidase (POX) activity, and we generated mutants lacking POX and/or CAT activities for individually delineating their functional features. We discovered that the TnPrx1 POX and CAT activities possessed different kinetic features in reducing H2O2. The overexpression of wild-type TnPrx1 and mutants differentially regulated the intracellular levels of reactive oxygen species and p38 phosphorylation in HEK-293T cells treated with H2O2. These observations suggest that the dual antioxidant activities of Prx1 may be crucial for organisms to mediate intracellular redox homeostasis.

Keywords: catalase; hydrogen peroxide; peroxidase; peroxiredoxin; signaling.


Figures

FIGURE 1.
FIGURE 1.
Verification of the CAT-like activity of Prx1 and mutants. A, expression and purification of soluble TnPrx1 protein. Lane 1, protein markers; lane 2, crude cell lysate; lane 3, flow-through; lanes 4 and 5, 40 mm imidazole wash; lanes 6–8, eluted recombinant protein (250 mm imidazole). B, reductive dissociation of TnPrx1 dimer induced by DTT. Lane 1, protein markers; lanes 2–8, proteins treated with different concentrations of DTT (0, 0.1, 0.5, 1, 5, 10, and 50 mm). C and D, activities of TnPrx1 in monomers (C) and dimers (D) in the absence of a reducing agent by detecting the reduction of H2O2 using a luminol chemiluminescence assay after incubation with 300 μm H2O2 for 10 min at 25 °C. The bands in the red dashed box denoted the TnPrx1 monomers and dimers used in the corresponding assays. Theoretical values represent the maximal reduction of H2O2 possibly achieved by the oxidation of 3 TnPrx1 Cys residues in a given amount of TnPrx1 protein in the absence of reductants or redox recycling. hd, heated-denatured TnPrx1 protein. E and F, detection of O2 production in reactions containing H2O2 and various protein constructs (i.e. 0.32 μm POX+CAT+ dimers, 0.64 μm POXCAT+ monomers, 8 nm catalase, and 6 μm BSA) using an oxygen electrode technique. G and H, gradient elution of TnPrx1 protein with varied concentrations of imidazole in elution buffer (G) and their corresponding activity by measuring the reduction of H2O2 with or without the addition of extra iron (200 μm) by luminol chemiluminescence (H). Activity was normalized to μmol of H2O2 reduced/min/g of TnPrx1 protein. Data are representative of at least three independent experiments. The error bars represent S.D., and statistical significances between experimental and control groups were determined by Student's t test. ***, p < 0.001.
FIGURE 2.
FIGURE 2.
Iron dependence and inhibition of TnPrx1 and mutants determined by measuring the reduction of H2O2 by a luminol chemiluminescence assay. A and B, effects of iron chelators (25 mm Tiron and 50 mm 2,2-dipyridy (DP)) on the CAT activity of WT TnPrx1 and mutants and restoration of the activity by the addition of Fe3+ (200 μm). Residual activities are expressed as the percent activity (versus untreated WT TnPrx1). C, dose-dependent WT TnPrx1 activity on Fe3+. Residual activities are expressed as the percent activity (versus WT TnPrx1 treated with 200 μm Fe3+). D, molar ratio between TnPrx1 protein and bound iron determined by inductively coupled plasma optical emission spectroscopy. TnPrx1 was treated as specified followed by extensive washes with water by ultrafiltration prior to inductively coupled plasma. Bovine catalase and PBS were used as controls. E and F, effects of catalase inhibitors 3-amino-1,2,4-triazole (3-AT) and DTT on the CAT activity of WT TnPrx1 and mutants. Catalase was used as a positive control. Residual activities are expressed as the percent activity (versus untreated WT TnPrx1). Data are representative of at least three independent experiments. The error bars represent S.D., and statistical significances between experimental and control groups were determined by Student's t test. **, p < 0.01; ***, p < 0.001.
FIGURE 3.
FIGURE 3.
Kinetic features of Prx1 proteins. A–E, enzyme kinetics curves for pufferfish Prx1 (TnPrx1 WT and mutants) and human Prx1 (WT HsPrx1) with or without DTT. F, structural comparison of the potential cavity of wild-type Prx1 protein (yellow) and its mutant (pink) in mesh form. The image is a merged model of the two Prx1 proteins. G and H, the dimeric versus monomeric status of TnPrx1 proteins in non-reducing or reducing SDS-PAGE, respectively. All TnPrx1 proteins were treated with a monomer-to-dimer transition protocol prior to the assays.
FIGURE 4.
FIGURE 4.
Structural comparison between rat Prx1 (Protein Data Bank code 1QQ2) (A) and TnPrx1 determined by homology modeling (B). Structural models are represented in surface forms prepared using PyMOL software. The amino acids located at the dimer interface are shown in colors. The pockets containing the 117GVL119 motif in rat Prx1 and TnPrx1 are highlighted in yellow.
FIGURE 5.
FIGURE 5.
The effect of pH and temperature on catalase-like activity and stability of TnPrx1 wild-type (POX+CAT+) and mutant (POXCAT+) proteins. A, the effect of temperature on residual Prx1-CAT activity. The activity assay was performed at pH 7.0 and at various temperatures. B, the effect of temperature stability of Prx1-CAT. All the proteins were incubated at pH 7.0 and at various temperatures for 1 h, and then the residual activity was estimated. C, the effect of pH on residual Prx1-CAT activity. The activity assay was performed at room temperature and at various pH values. D, the effect of pH stability of Prx1-CAT. The proteins were incubated at various pH values at 4 °C for 6 h, and then residual activity was measured. Error bars represent S.D.
FIGURE 6.
FIGURE 6.
Involvement of TnPrx1 constructs in regulating intracellular ROS and ROS-mediated phosphorylation of p38 MAPK in transfected HEK-293T cells. A and B, the expression of various TnPrx1 constructs in transfected cells was confirmed by qRT-PCR in comparison with the expression of endogenous HsPrx1 and catalase genes. The relative levels of Prx1 transcripts (HsPrx1 only in blank control or HsPrx1 + TnPrx1 in transfected cells) were determined using a pair of primers derived from regions conserved between fish and mammalian Prx1 genes (Table 2). -Fold changes of Prx1 and catalase transcripts are expressed relative to the catalase transcripts in the blank control (A) or to the transcripts of their own genes (B). C and D, effects of TnPrx1 constructs on intracellular ROS and ROS-mediated phosphorylation of p38 MAPK in transfected cells treated with exogenous H2O2 as determined by dichlorodihydrofluorescein fluorescence assay and Western blot analysis, respectively. In the Western blot analysis, antibody to human GAPDH was used as a control (D, lower panel). Representative data from one of three or more independent experiments are shown. The error bars represent S.D., and statistical significances between experimental and control groups were determined by Student's t test. *, p < 0.05. p-p38, phosphorylated p38.
FIGURE 7.
FIGURE 7.
Summary of Prx1 and CAT protein levels in various human cells and tissues. A, relative expression levels of Prx1 and CAT proteins in cancer and non-cancer samples. Each set of three dots above the same x axis point represent the levels of Prx1, CAT, and total (CAT + Prx1) from the same sample. B, comparison of the Prx1 and CAT protein levels in cancer and non-cancer samples by plotting those of Prx1 (x axis) against CAT (y axis). Data were derived from the Multi-Omics Profiling Expression Database (MOPED).

References

    1. McGonigle S., Dalton J. P., James E. R. (1998) Peroxidoxins: a new antioxidant family. Parasitol. Today 14, 139–145 - PubMed
    1. Kang S. W., Chae H. Z., Seo M. S., Kim K., Baines I. C., Rhee S. G. (1998) Mammalian peroxiredoxin isoforms can reduce hydrogen peroxide generated in response to growth factors and tumor necrosis factor-α. J. Biol. Chem. 273, 6297–6302 - PubMed
    1. Mitsumoto A., Takanezawa Y., Okawa K., Iwamatsu A., Nakagawa Y. (2001) Variants of peroxiredoxins expression in response to hydroperoxide stress. Free Radic. Biol. Med. 30, 625–635 - PubMed
    1. Rhee S. G., Kang S. W., Jeong W., Chang T. S., Yang K. S., Woo H. A. (2005) Intracellular messenger function of hydrogen peroxide and its regulation by peroxiredoxins. Curr. Opin. Cell Biol. 17, 183–189 - PubMed
    1. Rhee S. G., Woo H. A., Kil I. S., Bae S. H. (2012) Peroxiredoxin functions as a peroxidase and a regulator and sensor of local peroxides. J. Biol. Chem. 287, 4403–4410 - PMC - PubMed

Publication types

Associated data

LinkOut - more resources