

Emergent vortices in populations of colloidal rollers
- PMID: 26088835
- PMCID: PMC4557359
- DOI: 10.1038/ncomms8470
Emergent vortices in populations of colloidal rollers
Abstract
Coherent vortical motion has been reported in a wide variety of populations including living organisms (bacteria, fishes, human crowds) and synthetic active matter (shaken grains, mixtures of biopolymers), yet a unified description of the formation and structure of this pattern remains lacking. Here we report the self-organization of motile colloids into a macroscopic steadily rotating vortex. Combining physical experiments and numerical simulations, we elucidate this collective behaviour. We demonstrate that the emergent-vortex structure lives on the verge of a phase separation, and single out the very constituents responsible for this state of polar active matter. Building on this observation, we establish a continuum theory and lay out a strong foundation for the description of vortical collective motion in a broad class of motile populations constrained by geometrical boundaries.
Figures
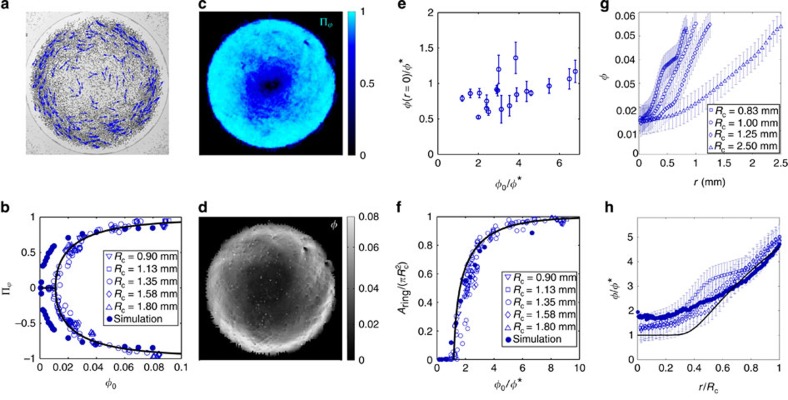
 and plotted versus the average packing fraction. Error bars: one standard deviation. (f) Fraction of the disc where
  versus the average packing fraction. Open symbols: experiments. Full line: theoretical prediction with no free fitting parameter. Filled circles: numerical simulations (b=3a, Rc=1 mm). (g) Radial density profiles plotted as a function of the distance to the disc centre r. All the experiments correspond to φ0=0.032±0.002, error bars: 1σ. (h) Open symbols: same data as in g. The radial density profiles are rescaled by
  and plotted versus the rescaled distance to the centre r/Rc. All the profiles are seen to collapse on a single master curve. Filled symbols: Numerical simulations. Solid line: theoretical prediction. All the data correspond to E0/EQ=1.1.
References
-
- Vicsek T., Czirók A., Ben-Jacob E., Cohen I. & Shochet O. Novel type of phase transition in a system of self-driven particles. Phys. Rev. Lett. 75, 1226–1229 (1995). - PubMed
-
- Toner J., Tu Y. & Ramaswamy S. Hydrodynamics and phases of flocks. Ann. Phys 318, 170–244 (2005).
-
- Vicsek T. & Zafeiris A. Collective motion. Phys. Rep. 517, 71–140 (2012).
-
- Marchetti M. C. et al. Hydrodynamics of soft active matter. Rev. Mod. Phys. 85, 1143–1189 (2013).
-
- Cavagna A. & Giardina I. Bird flocks as condensed matter. Annu. Rev. Condens. Matter Phys. 5, 183–207 (2014).
Publication types
LinkOut - more resources
Full Text Sources
Other Literature Sources
