. 2015 Sep;14(9):2479-92.
doi: 10.1074/mcp.M115.048090. Epub 2015 Jun 18.

Characterization of the Tyrosine Kinase-Regulated Proteome in Breast Cancer by Combined use of RNA interference (RNAi) and Stable Isotope Labeling with Amino Acids in Cell Culture (SILAC) Quantitative Proteomics

Affiliations

Characterization of the Tyrosine Kinase-Regulated Proteome in Breast Cancer by Combined use of RNA interference (RNAi) and Stable Isotope Labeling with Amino Acids in Cell Culture (SILAC) Quantitative Proteomics

Justin Stebbing et al. Mol Cell Proteomics. 2015 Sep.

Abstract

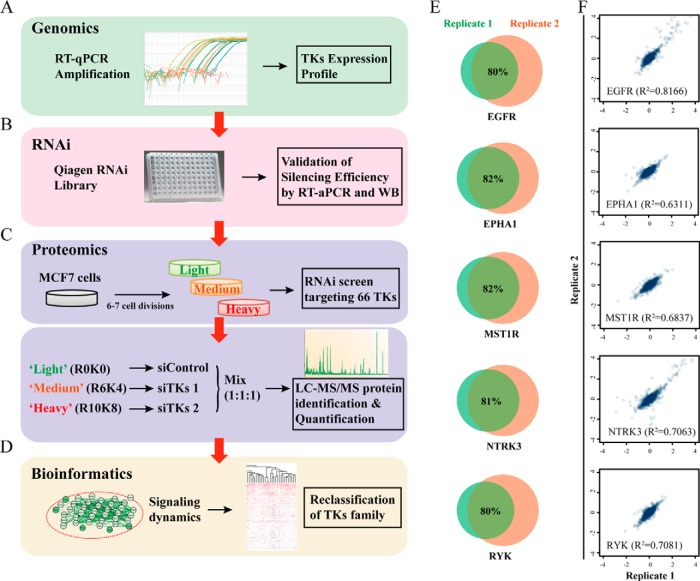
Tyrosine kinases (TKs) are central regulators in cellular activities and perturbations of TK signaling contribute to oncogenesis. However, less than half of the TKs have been thoroughly studied and a global functional analysis of their proteomic portrait is lacking. Here we conducted a combined approach of RNA interference (RNAi) and stable isotope labeling with amino acids in cell culture (SILAC)-based quantitative proteomics to decode the TK-regulated proteome and associated signaling dynamics. As a result, a broad proteomic repertoire modulated by TKs was revealed, upon silencing of the 65 TKs expressed in MCF7 breast cancer cells. This yielded 10 new distinctive TK clusters according to similarity in TK-regulated proteome, each characterized by a unique signaling signature in contrast to previous classifications. We provide functional analyses and identify critical pathways for each cluster based on their common downstream targets. Analysis of different breast cancer subtypes showed distinct correlations of each cluster with clinical outcome. From the significantly up- and down-regulated proteins, we identified a number of markers of drug sensitivity and resistance. These data supports the role of TKs in regulating major aspects of cellular activity, but also reveals redundancy in signaling, explaining why kinase inhibitors alone often fail to achieve their clinical aims. The TK-SILACepedia provides a comprehensive resource for studying the global function of TKs in cancer.


Figures

Fig. 1.
Fig. 1.
Strategy for identification of TK signaling by combined use of SILAC-based quantitative proteomics and RNAi. A, The expression profile of all 90 TKs was examined using RT-qPCR in MCF7 cells. B, Silencing efficiency of a certified RNAi library composed of two siRNAs per each TK was validated by RT-PCR and Western blotting. C, MCF7 cells were then grown in either R0K0 “light” or unlabeled medium l-[12C6,14N4] arginine (R0) and l-[12C6,14N2] lysine (K0), or R6K4 “medium” labeled l-[13C6] arginine (R6) and l-[2H4] lysine (K4), or R10K8 “heavy” medium labeled l-[13C6, 15N4] arginine (R10) and l-[13C6, 15N2] lysine (K8). Subsequently, SILAC-based proteomic analysis was performed after silencing each verified TKs in MCF7 cells. D, Further bioinformatic analyses were implemented to reclassify the family of TKs and to characterize the associated functional portrait. E, Validation of the experimental approach performed in this study. Venn graphs showing a high overlap of identified proteome between different replicates after silencing EGFR, EPHA2, MST1R, NTRK3, and RYK are presented. F, Comparison of quantifications between different replicates after silencing EGFR, EPHA2, MST1R, NTRK3, and RYK. Correlation analysis of the protein ratios plotted against each replicate is shown.
Fig. 2.
Fig. 2.
Heatmap of quantified proteins after TK silencing. The overall pattern of regulation is shown in the heatmap of quantified values. After normalized to siControl, values of fold changes are all above zero, with value one showing that the expression levels of the specific protein are not altered after silencing TKs. For each knockdown (rows) the quantified value for an identified protein is plotted in red for down regulated proteins (below one), white for nondifferential and nonidentified and blue for up-regulated proteins (above one). The row labels indicate the knock out experiment and the colors correspond to the clusters described below.
Fig. 3.
Fig. 3.
Correlation heatmap of the distance metric between all 65 TKs in MCF7 cells. Pairwise distances were calculated and plotted according to the quantifications of TK-regulated proteomic signatures using centered Pearson correlation. In the correlation heatmap showing the distance metric between all kinases in our study, the smaller distances are displayed in purple, whereas the longer distances are in green.
Fig. 4.
Fig. 4.
Hierarchical clustering of the 65 TKs expressed in MCF7 cells. A, Hierarchical clustering of the 65 TKs was performed using R's hclust function. The complete linkage method which aims to identify similar clusters based on overall cluster measure was used. Ten distinctive clusters were obtained and the complete dendrogram is shown with the labels colored for these clusters. B, Full list of the TKs included in each cluster. The color-coding of the clusters is used throughout to identify the analysis relevant to the corresponding clusters. C, Heatmap of the proteomic quantifications (log2 values of normalized fold changes against control) for the downstream effects (significantly up- or down-regulated proteins, Significant B test p < 0.05) after silencing TKs in cluster 1. D, Number of proteins significantly up or down-regulated in each identified cluster. x axis shows 10 different clusters and y axis indicates the counts.
Fig. 5.
Fig. 5.
Characterization of a functional portrait for each cluster. A, A functional profile of top GO biologic processes that the up- and down-regulated proteins belong to is presented. x axis shows the percentage of hits in each cluster that belong to a GO biologic process term. The color coding and the number for each cluster are indicated as above. B, A functional profile of top GO molecular functions that the up- and down-regulated proteins belong to is presented. x axis shows the percentage of hits in each cluster that belong to a GO molecular function term.
Fig. 6.
Fig. 6.
Representatives of defined functional networks in each classified TK cluster. The functional networks were generated using GO analysis combined with the STRING platform. Proteins in lighter color are up-regulated, whereas brighter color indicates down-regulation. Arrows show the interactions between connected proteins. Representative defined functional networks associated with their clusters are shown here. The color coding and the number for each cluster are indicated as above.
Fig. 7.
Fig. 7.
Associations of each classified TK with clinical outcomes and drug response in breast cancer. A, Clinical significance of classified TK clusters in different molecular subtypes of breast cancer. Kaplan-Meier curves showing associations of expression levels of TKs in cluster 1 with relapse free survival (RFS) in luminal A and luminal B breast cancer were presented. B, Heatmap for the associations of each classified TK cluster with drug sensitivity and resistance in breast cancer cell lines. Gene expressions of downstream effects (up- and down-regulated) in each cluster were gained from CCLE and regressed against the GDSC IC50 values for doxorubicin in breast cancer cell lines. The genes those were most significantly associated with sensitivity (yellow)/resistance (purple) to doxorubicin are presented here (linear regression with ANOVA p < 0.01). The color coding and the number for each cluster are indicated as above.

References

    1. Hanahan D., Weinberg R. A. (2011) Hallmarks of cancer: the next generation. Cell 144, 646–674 - PubMed
    1. Kolch W., Pitt A. (2010) Functional proteomics to dissect tyrosine kinase signalling pathways in cancer. Nat. Rev. Cancer 10, 618–629 - PubMed
    1. Gstaiger M., Aebersold R. (2009) Applying mass spectrometry-based proteomics to genetics, genomics, and network biology. Nat. Rev. Genet. 10, 617–627 - PubMed
    1. Amanchy R., Kalume D. E., Iwahori A., Zhong J., Pandey A. (2005) Phosphoproteome analysis of HeLa cells using stable isotope labeling with amino acids in cell culture (SILAC). J. Proteome Res. 4, 1661–1671 - PubMed
    1. Olsen J. V., Blagoev B., Gnad F., Macek B., Kumar C., Mortensen P., Mann M. (2006) Global, in vivo, and site-specific phosphorylation dynamics in signaling networks. Cell 127, 635–648 - PubMed

Publication types