. 2015 Nov 1;21(21):4970-84.
doi: 10.1158/1078-0432.CCR-14-1566. Epub 2015 Jun 18.

Identification and Functional Validation of Reciprocal microRNA-mRNA Pairings in African American Prostate Cancer Disparities

Affiliations

Identification and Functional Validation of Reciprocal microRNA-mRNA Pairings in African American Prostate Cancer Disparities

Bi-Dar Wang et al. Clin Cancer Res. .

Abstract

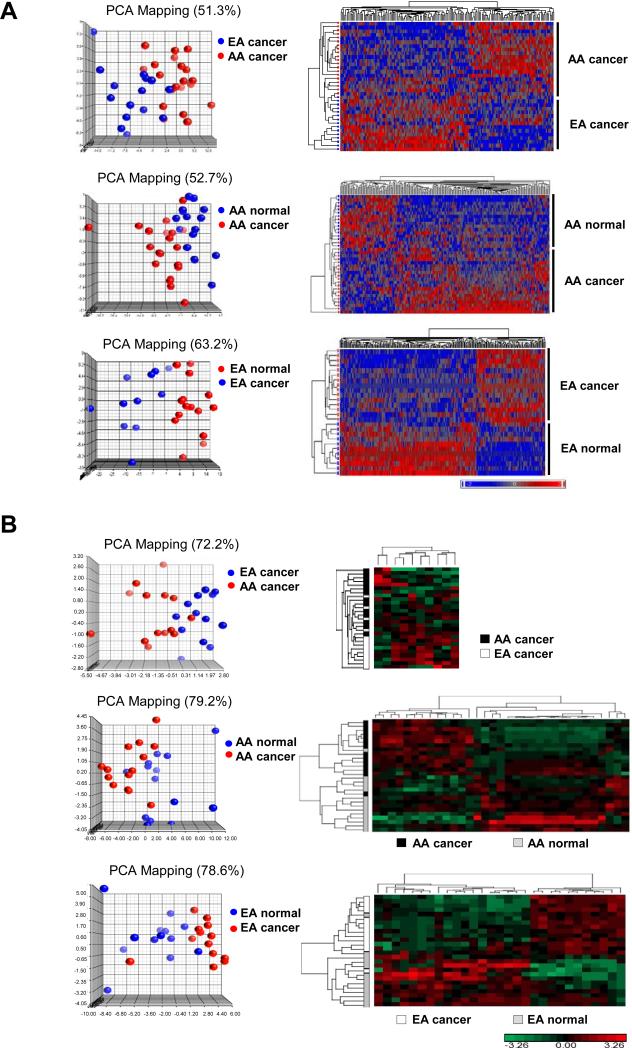
Purpose: African Americans (AA) exhibit higher rates of prostate cancer incidence and mortality compared with European American (EA) men. In addition to socioeconomic influences, biologic factors are believed to play a critical role in prostate cancer disparities. We investigated whether population-specific and -enriched miRNA-mRNA interactions might contribute to prostate cancer disparities.

Experimental design: Integrative genomics was used, combining miRNA and mRNA profiling, miRNA target prediction, pathway analysis, and functional validation, to map miRNA-mRNA interactions associated with prostate cancer disparities.

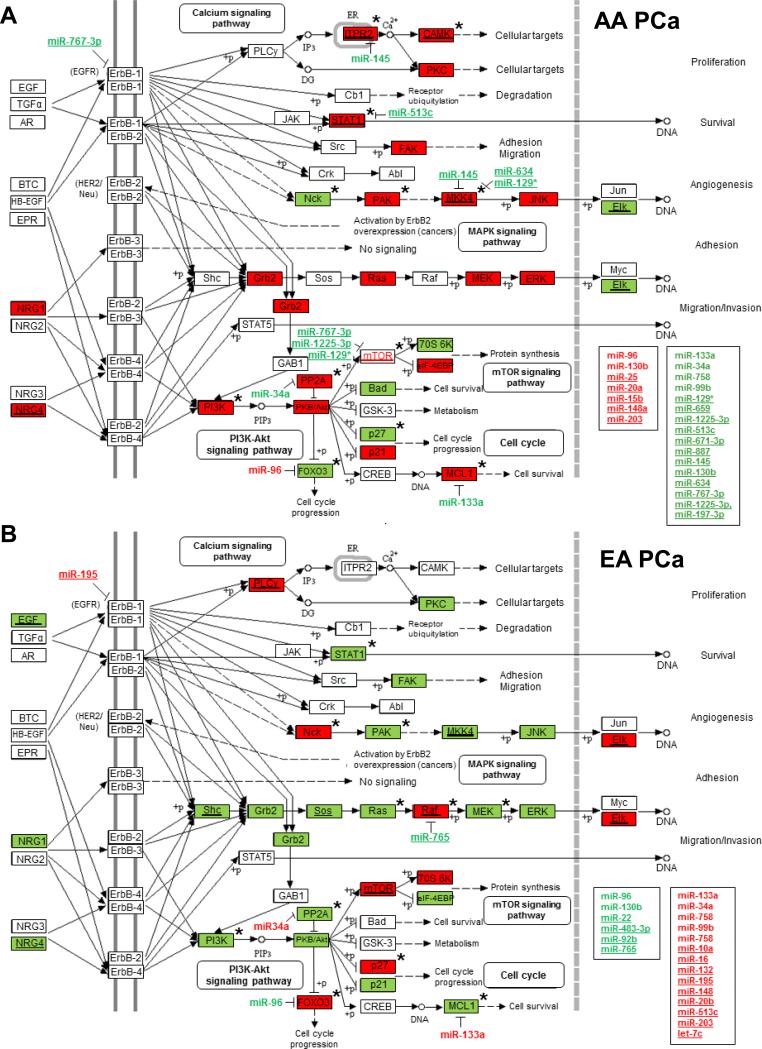
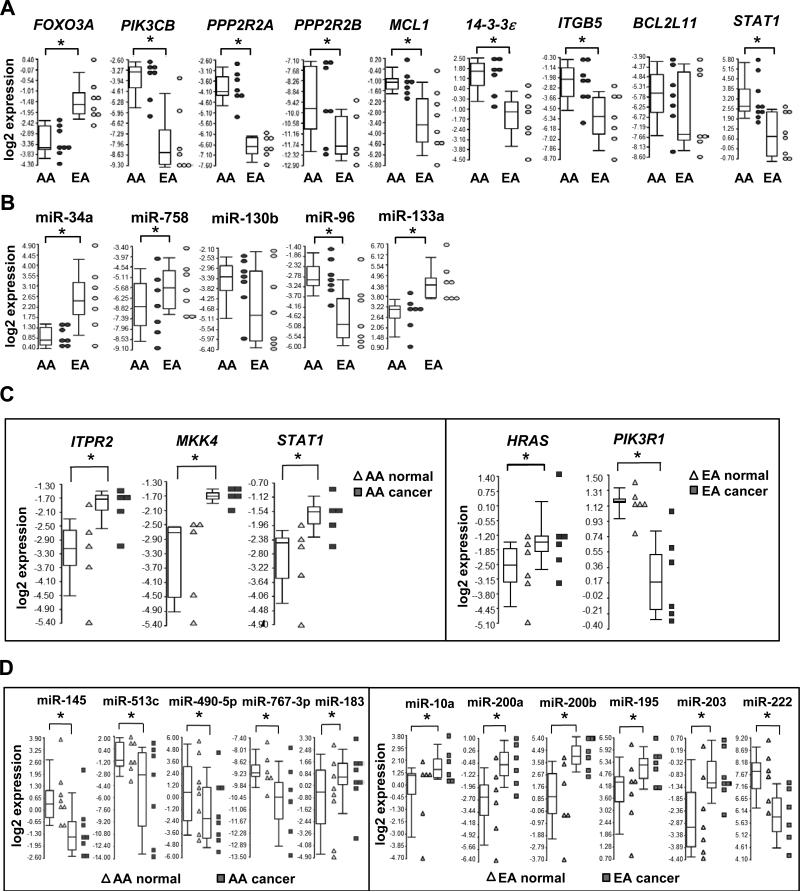
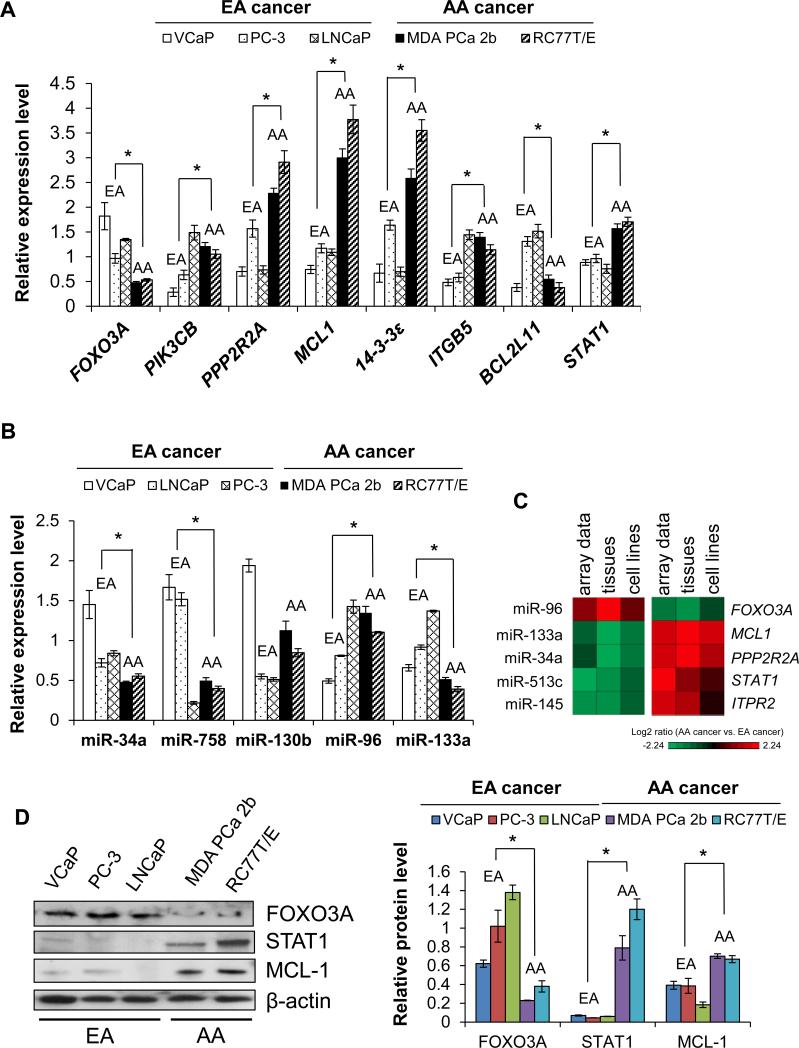
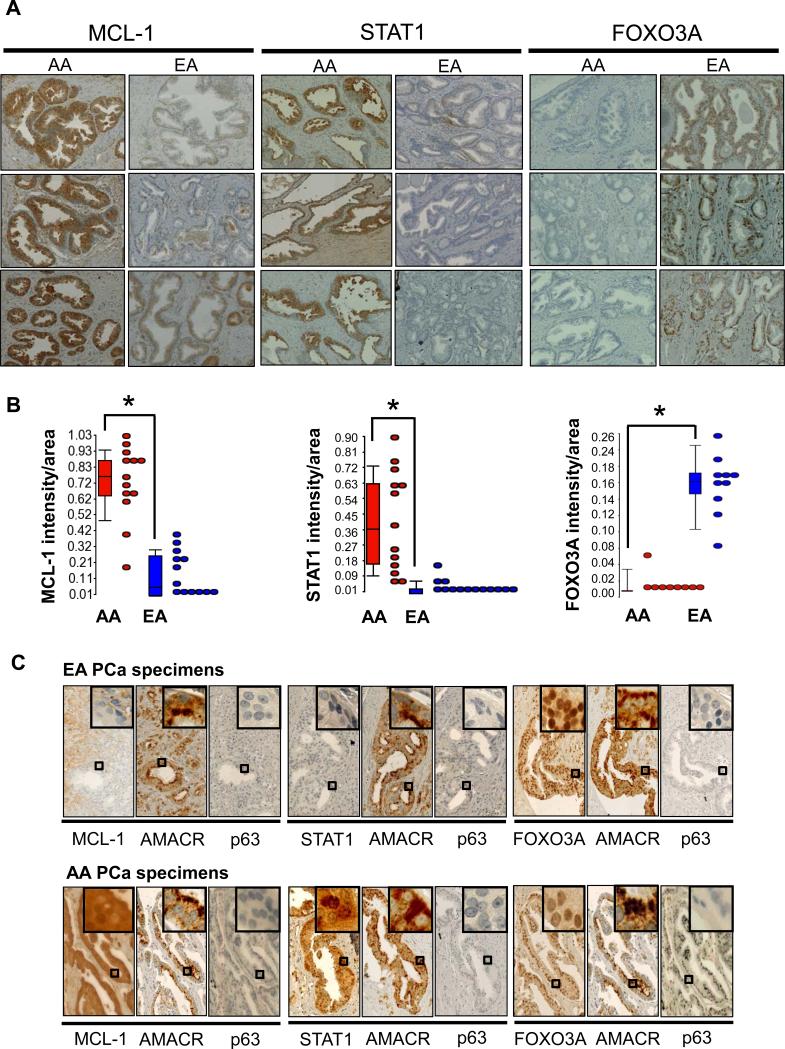
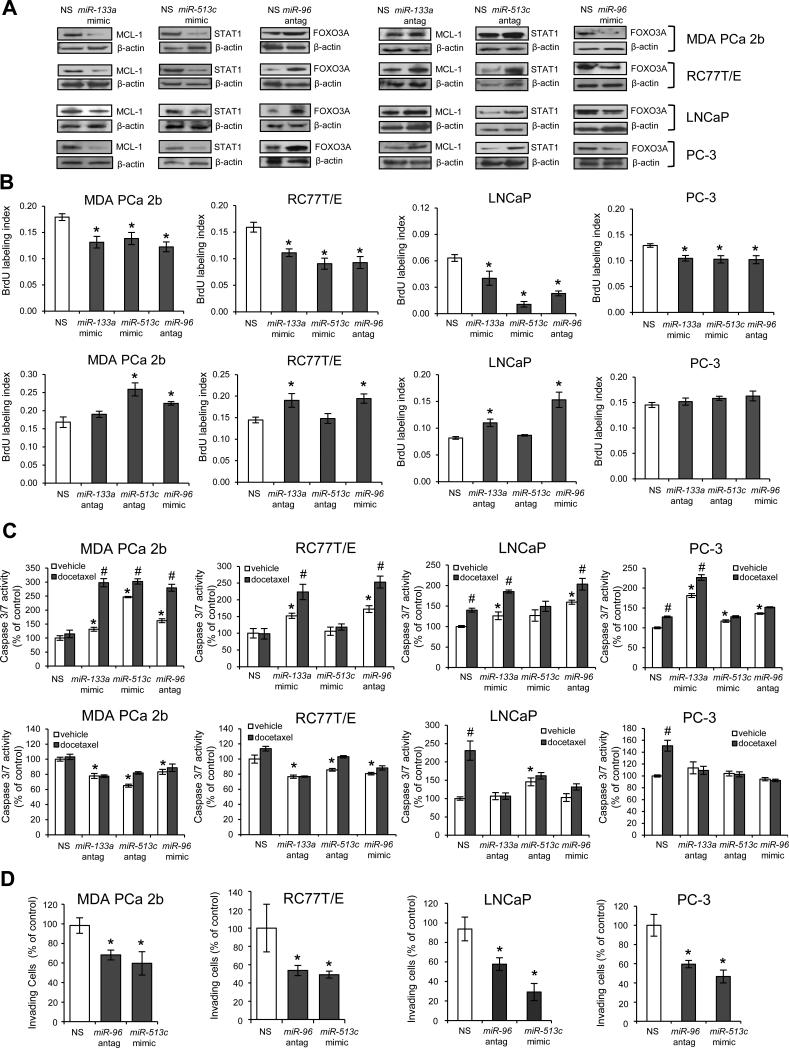
Results: We identified 22 AA-specific and 18 EA-specific miRNAs in prostate cancer versus patient-matched normal prostate, and 10 "AA-enriched/-depleted" miRNAs in AA prostate cancer versus EA prostate cancer comparisons. Many of these population-specific/-enriched miRNAs could be paired with target mRNAs that exhibited an inverse pattern of differential expression. Pathway analysis revealed EGFR (or ERBB) signaling as a critical pathway significantly regulated by AA-specific/-enriched mRNAs and miRNA-mRNA pairings. Novel miRNA-mRNA pairings were validated by qRT-PCR, Western blot, and/or IHC analyses in prostate cancer specimens. Loss/gain of function assays performed in population-specific prostate cancer cell lines confirmed miR-133a/MCL1, miR-513c/STAT1, miR-96/FOXO3A, miR-145/ITPR2, and miR-34a/PPP2R2A as critical miRNA-mRNA pairings driving oncogenesis. Manipulating the balance of these pairings resulted in decreased proliferation and invasion, and enhanced sensitization to docetaxel-induced cytotoxicity in AA prostate cancer cells.

Conclusions: Our data suggest that AA-specific/-enriched miRNA-mRNA pairings may play a critical role in the activation of oncogenic pathways in AA prostate cancer. Our findings also suggest that miR-133a/MCL1, miR-513c/STAT1, and miR-96/FOXO3A may have clinical significance in the development of novel strategies for treating aggressive prostate cancer.


Figures

Figure 1
Figure 1
mRNA and miRNA expression profiling of PCa specimens and patient-matched normal tissues derived from AA and EA patients. (A) PCA plots and hierarchical 2D clustering of mRNA expression in AA PCa versus EA PCa, and PCa versus patient-matched normal tissue. (B) PCA plots and hierarchical clustergrams of miRNA expression in AA PCa versus EA PCa, and PCa versus patient-matched normal tissue. For both (A) and (B), samples are in rows, and mRNAs or miRNAs are in columns. Plots demonstrated clear separation and consistency of mRNA and miRNA expression profiles in group comparisons. For mRNA profiling, n=20, 20, 15, and 15 for AA PCa, AA matched normal, EA PCa and EA matched normal, respectively. For miRNA profiling, n=14, 14, 13, and 13 for AA PCa, AA matched normal, EA PCa and EA matched normal, respectively.
Figure 2
Figure 2
ERBB signaling pathway is highly activated in AA PCa specimens. Differentially expressed mRNAs (identified by Global test or Global test plus ANOVA (indicated by asterisk) and miRNAs (identified by ANOVA or paired t-test) populating the ERBB signaling pathway in (A) AA PCa and (B) EA PCa. Up- (in red) and down-regulated (in green) miRNAs with underline representing population-specific miRNAs, while miRNAs not underlined represent population-enriched (red) or -depleted (green) miRNAs. The same coloring and underlining scheme is used for differentially expressed mRNAs. ERBB pathway in AA PCa (A) is more highly activated compared to EA PCa (B) as determined by GO-Elite. Eight novel reciprocal miRNA-mRNA pairings are highlighted, including miR-133a/MCL1, miR-96/FOXO3A, miR-513c/STAT1, miR-34a/PPP2R2A, miR-145/ITPR2, miR-145/MKK4, miR-634/MKK4 and miR-129*/MKK4. MiRNAs listed in boxes represent the population-specific (underlined) or -enriched/depleted miRNAs predicted to target genes in the ERBB signaling pathway belonging to positively or negatively correlated pairings or non-differentially expressed targets (see Supplementary Table S6).
Figure 3
Figure 3
QRT-PCR validation of population-enriched/depleted and -specific mRNAs and miRNAs in AA and EA PCa. (A) QRT-PCR validation of differentially expressed mRNAs in AA PCa versus EA PCa. (B) QRT-PCR validation of differentially expressed miRNAs in AA PCa versus EA PCa. (C) QRT-PCR validation of population-specific mRNAs. (D) QRT-PCR validation of population-specific miRNAs. The expression levels of mRNA or miRNAs from AA and EA patients are presented as Box-and-Whiskers plots (in A-D). Box: upper quantile, median and lower quantile. Whiskers: upper extreme (90 percentile of the dataset) and lower extreme (10 percentile of the dataset). Dot plots represent the relative expression levels of mRNA or miRNA from individual patient samples. * represents p < 0.05 using Student’s t-test (n = 6-9 independent experiments in A and B), or a paired Student's t-test (n= 5-8 independent experiments in C and D).
Figure 4
Figure 4
Population-specific PCa cell lines are in-vitro cell models for PCa disparities. (A) qRT-PCR validation of microarray mRNA data in population-specific PCa cell lines. (B) qRT-PCR validation of microarray miRNA data in population-specific PCa cell lines. (C) Heat maps demonstrating inverse correlation between expression of miRNAs and mRNAs in AA PCa versus EA PCa comparisons. (D) Western blot analysis reveals protein expression correlates with mRNA expression in population-specific cell lines. Relative protein level was normalized to β-actin. Representative blots of 4-6 independent determinations. Data (in A, B and D) are presented as the mean ± SEM, with * p < 0.05 using an unpaired Student's t-test, n = 4-6 independent experiments for each cell line. Means were derived by combining results from AA cell lines versus EA cell lines.
Figure 5
Figure 5
Immunohistochemistry reveals differential protein expression in AA PCa versus EA PCa. (A) Paraffin-embedded tissue sections of human PCa specimens show strong MCL-1 and STAT1 expression in the cytoplasm of cancer cells of AA specimens, while FOXO3A immunoreactivity was detected in cancer cell nuclei of EA specimens. Images shown are representative of 13 AA and 13 EA specimens from different patients. (B) The intensities of cytoplasmic MCL-1 and STAT1, and nuclear FOXO3A were quantified by using the ratio of total intensity of immunoreactive MCL-1, STAT1 or FOXO3A over the total area of cells in the images. Data presented as box plots of n = 13 AA or EA samples, with * p < 0.05 using Student's t-test. (C) Serial FFPE sections derived from AA and EA PCa patients were immuno-stained for AMACR (a PCa marker), p63 (a normal basal cell marker) and the protein of interest (MCL-1, STAT1 or FOXO3A). Enlarged pictures (rectangles as indicated) enhance the nuclear or cytoplasmic distribution of these proteins at the cellular level.
Figure 6
Figure 6
Functional validation of miR-133a/MCL1, miR-513c/STAT1 and miR-96/FOXO3A pairs in PCa aggressiveness. (A) Overexpression of miR-133a mimic, miR-513c mimic or miR-96 antagomir in PCa cell lines resulted in down-regulation of MCL-1 and STAT1, and up-regulation of FOXO3A, respectively. In contrast, inhibition of miR-133a or miR-513c with antagomirs or overexpression of miR-96 mimic resulted in up-regulation of MCL-1 and STAT1, and down-regulation of FOXO3A. AA lines are MDA PCa 2B, RC77T/E, and EA cell lines are LNCaP and PC-3. Representative western blots from 3-6 independent experimets. (B) BrdU-labeled cell proliferation assays of PCa cell lines transfected with miR-133a mimic, miR-513c mimic or miR-96 antagomir, or ‘converse’ antagomir/mimic treatments (miR-133a antagomir, miR-513c antagomir, or miR-96 mimic) were compared to cells treated with NS (nonsense scrambled negative control). Data are presented as mean ± SEM of n = 3-4 independent experiments, with * p < 0.05 using ANOVA and Tukey post-hoc test. (C) Apoptosis assays in population-specific PCa cell lines transfected with mimics or antagomirs. Apoptosis activity was assayed by measuring caspase3/7 activity using Apo-ONE kit (Promega), and the data were normalized to caspase 3/7 level of vehicle-treated NS control. Data are presented as mean ± SEM for n = 3-6 independent experiments, with p < 0.05 using ANOVA and Tukey post-hoc test comparing mimic or antagomir transfection plus vehicle treatment to NS transfection plus vehicle (*), or mimic or antagomir transfection plus vehicle to mimic or antagomir transfection plus docetaxel (#). (D) PCa cells transfected with miR-96 antagomir or miR-513c mimic were significantly less invasive compared to NS control-treated cells. Data are presented as mean ± SEM of n = 4-6 independent experiments, with * p < 0.05 using ANOVA and Holmes post-hoc test. Antag = antagomir.

References

    1. Volinia S, Calin GA, Liu CG, Ambs S, Cimmino A, Petrocca F, et al. A microRNA expression signature of human solid tumors defines cancer gene targets. Proc Natl Acad Sci U S A. 2006;103:2257–61. - PMC - PubMed
    1. Esquela-Kerscher A, Slack FJ. Oncomirs - microRNAs with a role in cancer. Nat Rev Cancer. 2006;6:259–69. - PubMed
    1. Cummins JM, Velculescu VE. Implications of micro-RNA profiling for cancer diagnosis. Oncogene. 2006;25:6220–7. - PubMed
    1. Calin GA, Liu CG, Sevignani C, Ferracin M, Felli N, Dumitru CD, et al. MicroRNA profiling reveals distinct signatures in B cell chronic lymphocytic leukemias. Proc Natl Acad Sci U S A. 2004;101:11755–60. - PMC - PubMed
    1. Lee YS, Dutta A. MicroRNAs in cancer. Annu Rev Pathol. 2009;4:199–227. - PMC - PubMed

Publication types

MeSH terms