. 2015 Jun 19;348(6241):1352-5.
doi: 10.1126/science.aab0551.

Cortical information flow during flexible sensorimotor decisions

Affiliations

Cortical information flow during flexible sensorimotor decisions

Markus Siegel et al. Science. .

Abstract

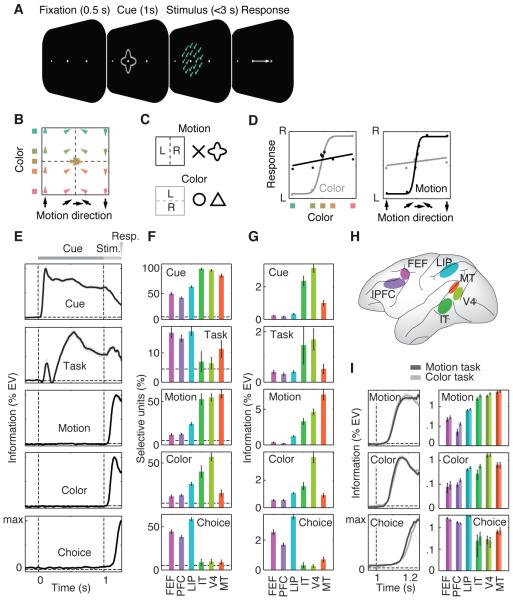
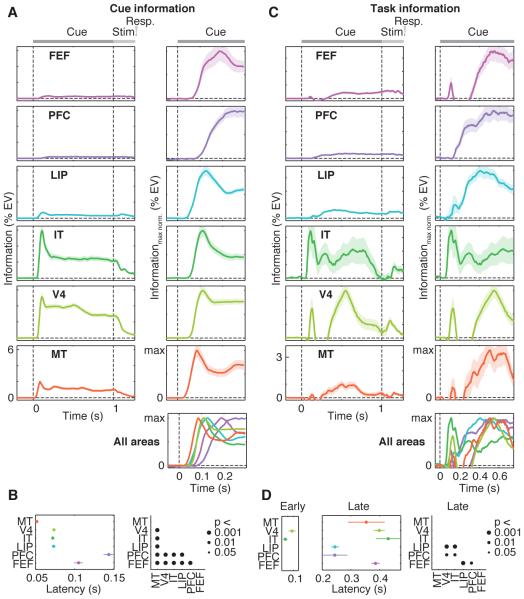
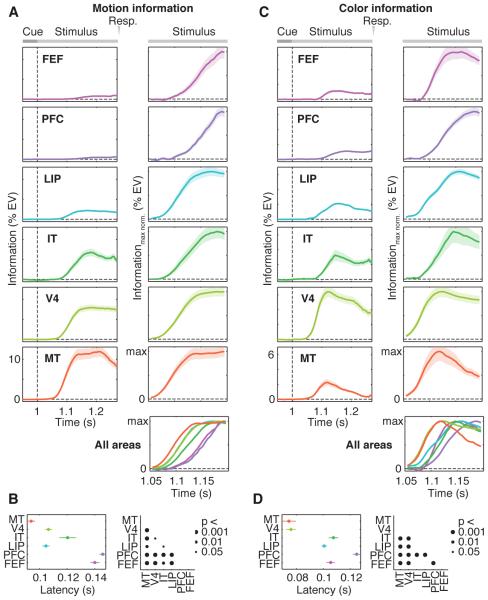
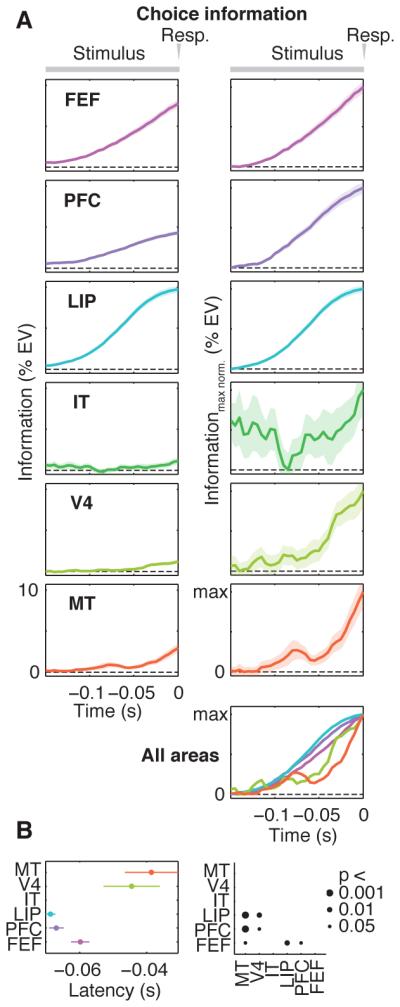
During flexible behavior, multiple brain regions encode sensory inputs, the current task, and choices. It remains unclear how these signals evolve. We simultaneously recorded neuronal activity from six cortical regions [middle temporal area (MT), visual area four (V4), inferior temporal cortex (IT), lateral intraparietal area (LIP), prefrontal cortex (PFC), and frontal eye fields (FEF)] of monkeys reporting the color or motion of stimuli. After a transient bottom-up sweep, there was a top-down flow of sustained task information from frontoparietal to visual cortex. Sensory information flowed from visual to parietal and prefrontal cortex. Choice signals developed simultaneously in frontoparietal regions and travelled to FEF and sensory cortex. This suggests that flexible sensorimotor choices emerge in a frontoparietal network from the integration of opposite flows of sensory and task information.


Figures

Fig. 1
Fig. 1. Task, behavior, and neuronal information
(A) Monkeys categorized the motion direction or color of centrally presented, colored random dot stimuli. Before stimulus onset, a central cue indicated which feature to categorize. Monkeys indicated their choice with a leftward or rightward saccade and held central fixation throughout each trial until their response. Monkeys were free to respond any time up to 3 s past stimulus onset. (B) Stimuli systematically covered motion direction and color space between opposite motion directions (up/down) and opposite colors (red/green; Lab space). All stimuli were 100% coherent, iso-speed, iso-luminant, and iso-saturated. (C) Two different cue shapes cued each task. (D) Responses were strongly modulated by motion and color for the motion and color task, respectively. (E) Time courses of neuronal information in spiking activity about five different task variables averaged across all units and brain regions. Information is measured as percent variance of spiking explained by the variable of interest, independent of all other variables (%EV). (F) Percentage of units per region significantly encoding each type of information (P < 0.05). Dashed lines indicate chance level. (G) Average information encoded for each region and type of information. (H) Schematic display of the recorded brain regions. (I) Time course of average motion, color and choice information analyzed separately for motion and color categorization tasks. Note information is log-scaled to facilitate comparison between tasks. All error bars denote SEM.
Fig. 2
Fig. 2. Dynamics of cue and task information
(A) Each row displays for one brain region the average time-course of neuronal information about cue identity. Left panels display raw information (%EV, same scale for all regions). To support comparison across regions, right panels display time-courses normalized by maximum information for the interval of interest. The bottom right panel shows an overlay of all regions’ information time-courses. Cue and stimulus onset are at Time = 0 s and Time = 1 s, respectively. (B) Comparison of cue information latencies between regions. Latencies are quantified as the time to reach half maximum information. Black dots in the right panel indicate significant latency differences between regions. (C) Time-courses of task information across regions. Same conventions as in (A). (D) Comparison of task information latencies between regions. Latencies were separately analyzed for the early transient peak around 100 ms and for the later sustained increase of task information after 200 ms. Early peak latencies were only estimated for regions that showed a significant effect (V4 and IT, P < 0.05). Same conventions as in (B). All error bars denote SEM.
Fig. 3
Fig. 3. Dynamics of motion and color information
Time-courses and latencies of neuronal information about (A and B) motion direction and (C and D) color of the categorized stimulus. Stimulus onset is at Time = 1 s. All other conventions as in Figure 2.
Fig. 4
Fig. 4. Dynamics of choice information
Response-locked (A) time-courses and (B) latencies of neuronal information about the animals’ choice. Responses are at Time = 0 s. Latency was not estimated for IT because there was no significant increase of choice information in IT in the analyzed interval (linear regression, p > 0.05). All other conventions as in Figures 2 and 3.

References

    1. Crowe DA, et al. Prefrontal neurons transmit signals to parietal neurons that reflect executive control of cognition. Nat. Neurosci. 2013;16:1484–1491. - PMC - PubMed
    1. Goodwin SJ, Blackman RK, Sakellaridi S, Chafee MV. Executive control over cognition: stronger and earlier rule-based modulation of spatial category signals in prefrontal cortex relative to parietal cortex. J. Neurosci. 2012;32:3499–3515. - PMC - PubMed
    1. Shadlen MN, Newsome WT. Motion perception: seeing and deciding. Proc Natl Acad Sci U A. 1996;93:628–33. - PMC - PubMed
    1. Freedman DJ, Assad JA. Experience-dependent representation of visual categories in parietal cortex. Nature. 2006;443:85–88. - PubMed
    1. Donahue CH, Lee D. Dynamic routing of task-relevant signals for decision making in dorsolateral prefrontal cortex. Nat. Neurosci. 2015;18:295–301. - PMC - PubMed

Publication types